

Search “aviation asset recovery costs” and you’ll find repossession firms quoting you for leased-aircraft retrieval, recycling companies selling teardown economics, and market reports with forecast ranges so wide they’re useless for planning. What you won’t find is a clear view of what aviation operators actually spend recovering the assets they lose, damage, or misplace every single day.
That’s because aviation asset recovery costs don’t live in one ledger. They split across at least four distinct pools: passenger baggage, unit load devices (ULDs), ground support equipment (GSE), and disabled aircraft. Each pool has different failure modes, different cost structures, and different solutions. Treating them as one problem is the first mistake. Budgeting for recovery without budgeting for visibility is the second.
I’ve deployed IoT tracking across aviation operations for over 15 years. The pattern repeats everywhere: recovery costs balloon not because assets vanish permanently, but because nobody has real-time custody data to intercept the loss before it becomes expensive. Here’s what each pool actually costs and where the leverage is.
Four Cost Pools, Four Different Problems
Before quoting a number, define the asset. A “recovered” passenger bag, a repaired ULD, a relocated baggage tractor, and a crane-lifted aircraft on a closed runway have almost nothing in common except the word “recovery.” Their cost drivers differ fundamentally.
| Cost pool | Public benchmark | What the number includes | What it excludes |
|---|---|---|---|
| Passenger baggage | $6.3 billion/year; $260 per mishandled bag | Delayed, lost, and damaged bag handling across the industry | Individual passenger reimbursement varies; total includes transport, storage, disposal for lost bags |
| ULDs | $330 million/year in repair and loss | Physical repair and unit replacement for ~1 million ULDs in service | Aircraft damage, flight delays, and cancellations caused by ULD failures |
| Ground support equipment | Case-specific; one project showed up to 10% fleet reduction | Avoided purchases and improved utilization | No published global annual loss estimate |
| Disabled aircraft | ~150 incidents/year; average 15-hour closure | Runway or airport closure duration | No standard global dollar total for crane, salvage, or downtime costs |
These pools should not be summed. They use different populations, timeframes, and definitions. But taken individually, each one reveals a specific cost that tracking and visibility can measurably reduce.

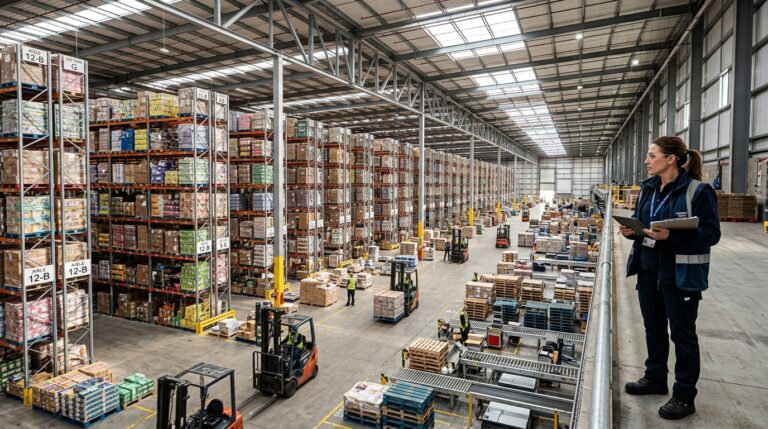
Baggage Mishandling Still Costs $6.3 Billion a Year
Baggage mishandling is the most quantified cost pool in aviation asset recovery. SITA’s 2026 report puts the number at $6.3 billion annually, with 24 million bags mishandled among 5 billion passengers in 2025. The average cost per mishandled bag: $260.
The rate is improving. Mishandling dropped 23% in 2025. Rates have fallen roughly 75% since 2007 while passenger traffic more than doubled. But a 75% improvement still leaves a $6.3 billion residual. The industry moves far more people now, so even a better rate produces a massive absolute bill.
Where does the money actually leak? Transfers. Transfer handoffs accounted for 39% of all mishandling in 2025, down slightly from 41% the year before. That concentration makes interline connections the highest-value intervention point for anyone trying to cut recovery spend.
This is a custody-data problem, not a search-party problem. IATA Resolution 753 defines four mandatory tracking points: acceptance from the passenger, loading to aircraft, transfer between operators, and arrival delivery. When one of those checkpoints fails (a scan missed, a handoff unrecorded), the bag enters a blind spot. Recovery then costs labor, transport, storage, and passenger compensation.
Consumer-device location sharing is adding a new recovery layer. SITA reports that Apple Find My integration cut permanently lost bags by 90% and shortened delayed-bag recovery time by 26% for bags where passengers shared their tracker location. In early 2026, SITA added Google’s Find Hub to WorldTracer, broadening the signal pool further. These are passenger-opt-in overlays, not replacements for airline custody scans. But they prove the point: better location data directly lowers the cost of getting a bag back to its owner.
ULD Repairs Hit $330 Million, and That’s the Partial Count
Unit load devices are the shipping containers of air freight. IATA estimates roughly 1 million ULDs in service globally, with a combined replacement value above $1 billion and annual repair-and-loss costs of $330 million. That figure, large as it is, explicitly excludes aircraft damage, flight delays, and cancellations linked to ULD failures. The real number is higher. Nobody publishes the full figure.
Here’s the part that should bother fleet managers: IATA’s own handling campaign says 80% of ULD repair costs could be avoided with correct handling procedures. That’s roughly $264 million a year in damage caused by process failures, not by wear or age. A misloaded container. A forklift impact. A ULD left on the ramp in conditions it wasn’t rated for.
Industry data from ULD CARE suggests 5 to 10% of freight equipment assets may be unavailable at any given time, and notes that putting a dollar value on lost utilization is difficult to calculate. That’s a polite way of saying nobody really knows the full cost, because the assets cycle through too many hands without continuous visibility.
The industry is starting to respond. Unilode launched Super Sentinel in early 2026, using Bluetooth and LoRa tags to track ULDs beyond its fixed-reader network, with a planned rollout across more than 220,000 units. The shift matters because fixed readers only see a ULD when it passes through an instrumented facility. Once it leaves (transferred to a handler, parked at an outstation, sitting at a foreign airport), it goes dark. Off-network tracking is designed to close that gap.
For operators running their own ULD pools or managing interline transfers, the math is straightforward. Every day a container sits unreturned or unlocated is a day you’re either renting a replacement or buying one. Recovery here isn’t just about finding the unit. It’s about knowing where it is before it becomes a problem.
Why Airports Keep Rebuying Ground Equipment
GSE doesn’t get the headlines baggage does, but the economics are real. Baggage tractors, belt loaders, ground power units, container dollies: airports are full of equipment that moves constantly, changes handlers, and lacks persistent tracking—making reducing aviation inventory costs a critical priority for operators seeking to control spending.
The best documented case is an Australian airline that deployed IoT tracking across 5,000 pieces of equipment at 12 airports, covering more than 40 asset types. The result: up to 10% fewer assets needed in selected categories. Not because they found lost equipment (though they did). Because they could finally see utilization patterns and stop buying duplicates for equipment that was already on the ramp, just parked in the wrong place—a direct improvement in aviation asset utilization rate.
Hong Kong International Airport took a different approach. The airport authority launched a GSE pooling scheme where ramp handlers rent critical equipment from a central pool rather than each maintaining separate fleets. The authority invested more than HK$300 million (roughly US$38.6 million) to procure the pool, with 95% electric units. Pooling reduces duplication at the fleet level; tracking improves control over individual items that remain distributed.
A separate project at Gruppo SAVE tracked 2,200 baggage trolleys across an airport with 25 pickup bays, reliably recovering abandoned trolleys and matching bay counts to actual inventory. The operational question it answered was simple but expensive to guess wrong: which bay is short, and where should staff look next?
GSE recovery costs don’t show up as a single industry figure because every airport and handler runs a different fleet model. But the pattern is consistent. When you can’t see your equipment in real time, you compensate by owning more of it. That’s capital tied up in redundancy, not in operations.
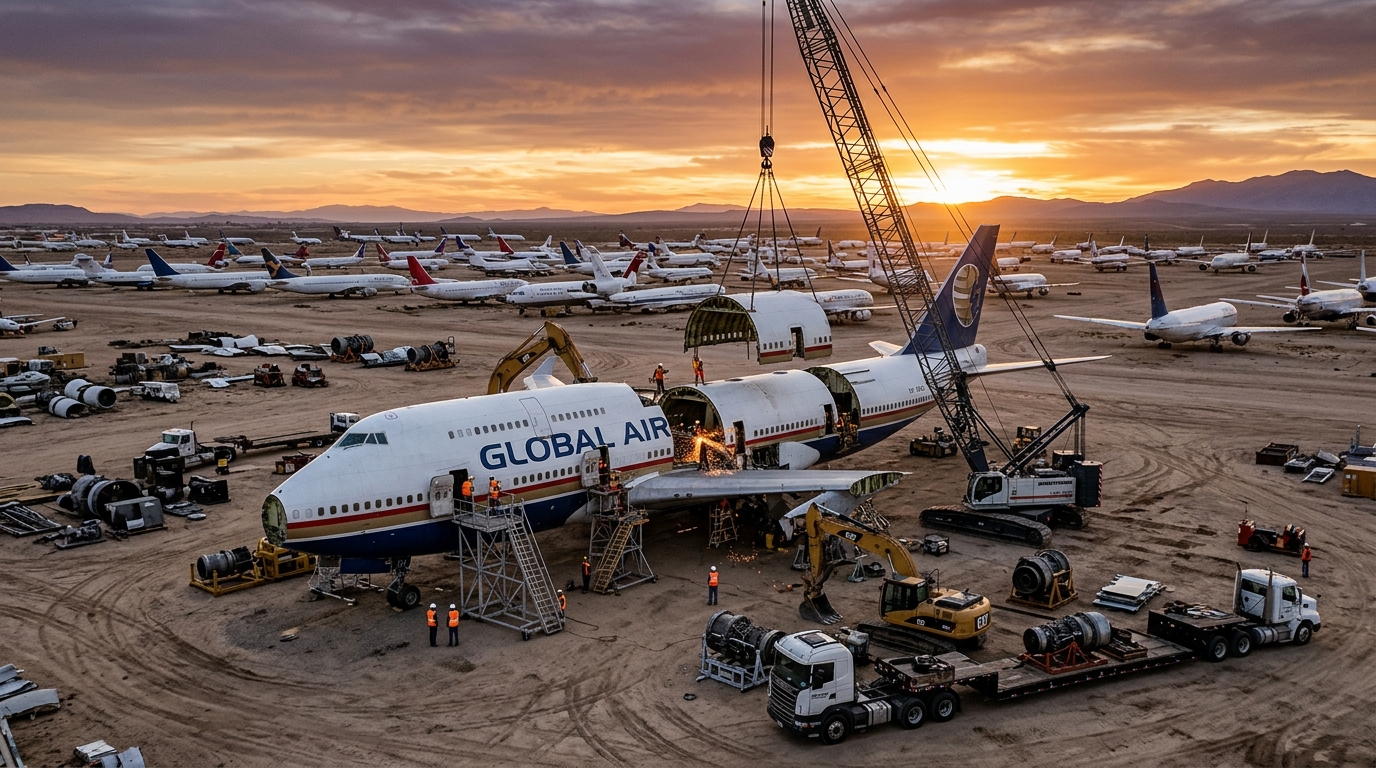
Disabled Aircraft Recovery Shuts Runways for 15 Hours
IATA reports approximately 150 disabled-aircraft incidents worldwide each year, with an average runway or airport closure of 15 hours. These are gear collapses, runway excursions, tires sinking into softened pavement, and other events that leave an aircraft unable to move under its own power.
There’s no standardized global cost figure. ACRP describes a case at Riverside Municipal Airport where a donated Boeing 727’s tires sank into ramp asphalt during pushback. Recovery took a week and required off-site equipment; the avoidable-cost estimate was $25,000, though that was a planning figure, not an invoice. FAA’s general-aviation tables put average hull damage at $235,552 in 2024 dollars, about 20% of average hull value, but that measures aircraft damage, not the recovery operation itself.
Disabled-aircraft recovery is a different category of problem. It’s low-frequency, high-consequence, and dominated by disruption costs rather than asset-location costs. Fifteen hours of runway closure at a busy hub cascades into diversions, cancellations, and passenger rebooking across the network. The preparedness question matters more than the tracking question here: does the airport have a recovery plan, trained staff, and accessible equipment before the event happens?
Still, asset location plays a supporting role. Knowing exactly where specialized recovery equipment is stored, which crane is closest, and whether the right lifting bags are available at the affected station can shorten mobilization time. In a 15-hour average closure, even a two-hour reduction in response has measurable downstream value.
Invisible Assets Cost More to Recover
Across all four pools, one pattern holds: recovery costs rise when custody and location data are absent or delayed.
A bag that misses a transfer scan enters a blind spot that takes labor and time to resolve. A ULD that leaves an instrumented facility can sit unreported for days. A baggage tractor parked at the wrong gate forces a handler to walk the ramp or request a replacement. Specialized recovery equipment stored at a distant station adds hours to an already expensive runway closure.
The right technology differs by pool. Baggage benefits from RFID checkpoints and passenger-shared location. ULDs need off-network tags that survive the cargo environment. GSE needs persistent GPS or cellular tracking across tarmac, hangar, and maintenance areas. Disabled-aircraft readiness needs asset registers and pre-positioned equipment, not necessarily real-time tracking on the aircraft itself.
But the principle is the same. Every hour between “asset missing” and “asset located” accumulates cost: labor, replacement rental, operational disruption, customer claims. Shortening that hour is the measurable return on a tracking investment.
This is the distinction I keep coming back to with aviation clients. Shipment tracking ends when the asset reaches a destination. Asset tracking follows it through the entire cycle: return, dwell time, reuse, repair. Most aviation asset recovery costs live in that post-delivery gap, the stretch where shipment tracking has already stopped caring but the asset hasn’t stopped costing you money.
Three Outcomes That Actually Move the Number
If you’re evaluating where to invest in reducing aviation asset recovery costs, focus on outcomes over feature lists.
- Reduce transfer blind spots for baggage. Transfers cause 39% of mishandling. Any improvement in custody data at interline handoffs, whether through better RFID reads, process compliance, or shared location signals, directly targets the single largest cost driver in the $6.3 billion pool.
- Track ULDs and GSE beyond the facility perimeter. Fixed readers work where they’re installed. The value gap is at off-network locations: outstations, partner facilities, third-party handlers. Devices rated for the aviation environment (like DO-160 approved trackers built for airfreight) maintain visibility where reader infrastructure doesn’t reach.
- Measure utilization, not just location. Finding a missing asset is reactive. Knowing which assets are underused, misallocated, or sitting idle prevents the next purchase you don’t need. The Australian airline case reduced its fleet by 10% in some categories not by recovering lost items, but by understanding where the existing ones actually were.
The cost of aviation asset recovery is, at its core, the cost of not knowing where things are. The technology to close that gap exists and is field-proven. The question is whether your organization budgets for visibility before the recovery invoice arrives.
If your ULD pool, GSE fleet, or cargo containers go invisible after they leave your facility, that’s the gap continuous asset tracking closes. Talk to our team or reach us at info@datanetiot.com.
Frequently Asked Questions
What does “aviation asset recovery costs” actually cover?
It spans at least four separate cost pools: passenger baggage handling ($6.3 billion/year), ULD repair and loss ($330 million/year), ground support equipment replacement and underutilization, and disabled-aircraft removal. Each pool has different economics and solutions. There is no single published industry-wide total.
How much does a single mishandled bag cost an airline?
SITA’s 2026 data puts the industry average at $260 per mishandled bag, covering delayed, lost, and damaged outcomes combined. Lost bags add transport, storage, and disposal costs on top. The figure is an industry average, not a fixed reimbursement to individual passengers.
What percentage of ULD repair costs are avoidable?
IATA estimates 80%. That means roughly $264 million of the $330 million annual ULD repair bill results from incorrect handling rather than normal wear. Process discipline and real-time damage reporting can significantly reduce this figure.
Can IoT tracking reduce ground equipment costs at airports?
Yes. A documented deployment covering 5,000 pieces of GSE across 12 airports showed up to 10% fleet reduction in selected asset categories. The savings came from understanding utilization patterns and avoiding unnecessary purchases, not just from locating missing items.
How many disabled-aircraft events occur each year?
IATA reports approximately 150 worldwide, with an average runway or airport closure of 15 hours per event. No published standard cost per incident exists; the primary financial impact comes from operational disruption cascading across the airline’s network.
What is the difference between shipment tracking and asset tracking in aviation?
Shipment tracking ends at delivery. Asset tracking follows the item through its full lifecycle: return, dwell, maintenance, reuse. Most aviation recovery costs accumulate after delivery, in the gap where shipment tracking has stopped. Continuous asset visibility closes that gap and prevents costs from compounding.


 +1 508 292 2210

3 Responses