

A $200 bearing sits on a shelf for three years, accumulating carrying costs. Then the day it’s needed, it’s not there. The line stops, an aircraft sits on the ground, and the real bill arrives: tens of thousands per hour in downtime, emergency freight, cascading schedule disruptions. This scenario is central to reducing aviation inventory costs without compromising operational readiness.
That scenario captures the core tension behind reducing MRO inventory costs. You’re not optimizing a warehouse. You’re managing a risk portfolio where both excess and shortage have steep penalties.
Global aviation MRO demand hit $136 billion in 2025, up 8% year over year, and it’s projected to approach $198 billion by 2036. The stakes keep climbing. Material cost inflation ran 7.7% in 2024 when the industry expected 6.5%, and 2025 inflation again exceeded forecasts by 100 to 200 basis points per segment. If you’re still running MRO inventory on old reorder points and tribal knowledge, you’re burning cash on both ends: too much stock and too many stockouts.
Having spent 15+ years watching aviation operators wrestle with this exact problem, I’ve noticed a pattern. The teams that actually reduce inventory cost (not just inventory levels) share one thing: they can see their parts. Not in a spreadsheet updated last quarter. In real time, across sites, through the full lifecycle. That visibility gap is where most “optimization” programs quietly fail.
Why MRO Inventory Stays Expensive Despite Repeated Optimization
Every MRO manager I’ve talked to has been through at least one inventory reduction initiative. Most produced a satisfying purge of obvious dead stock, a brief dip in carrying costs, and then a slow return to the same bloated levels within 18 months.
The reason is structural, not behavioral.
A 2026 benchmark of 362 global manufacturers found that more than half lack global inventory visibility, and 18% of MRO stock has sat unused for over five years. That’s not a procurement failure. It’s a data failure. When item masters are polluted with duplicate descriptions, mismatched units of measure, and missing lead times, no optimization algorithm can produce trustworthy recommendations.
The typical ERP or EAM system holds the transaction history. But it doesn’t know whether the part it says is in Bin 47-C is actually there, whether it’s been informally borrowed by another work order, or whether it’s sitting in a technician’s toolbox on the other side of the hangar. The gap between system state and physical reality is where inventory costs hide.
Three root causes keep reasserting themselves:
- Stale parameters. Reorder points and safety stocks set years ago for a different fleet, a different supplier base, or a different operational tempo. Nobody revisits them because nobody owns the review cycle.
- Fragmented visibility. Parts exist in multiple locations (line stations, hangars, MRO shops, vendor consignment, in-transit, in-repair) but no single system reflects the full picture in real time.
- Tribal knowledge as the backup system. When the veteran storeroom manager retires, the institutional memory of where things actually are, which substitutes work, and which suppliers will expedite walks out the door.
You can’t fix any of these with a one-time warehouse cleanup. They require continuous, automated visibility into what you have, where it is, and what condition it’s in.
The Cost Anatomy Most Teams Get Wrong
Ask a finance team what MRO inventory costs, and they’ll point to the balance sheet: the capital tied up in stock. That number matters, but it’s one line in a much longer invoice.
Annual carrying and handling costs typically run 17% to 25% of item value. On a $20 million parts inventory, that’s $3.4 to $5 million per year just to store and manage what you already own. But carrying cost is only the visible portion.
The full cost includes:
| Cost category | What it includes | Why it’s often missed |
|---|---|---|
| Capital lock-up | Cash tied in stock that could fund operations, fleet growth, or debt reduction | Treated as an asset on the balance sheet, not as opportunity cost |
| Carrying and handling | Warehousing, insurance, labor, climate control, security | Spread across facility budgets, rarely attributed to specific SKUs |
| Obsolescence and write-offs | Parts for retired equipment, expired shelf-life items, superseded components | Recognized only during periodic reviews or audits |
| Emergency procurement | Expedited shipping, premium pricing, AOG desk fees | Booked as one-off maintenance costs, not inventory management failures |
| Downtime | Lost revenue, schedule disruption, penalty clauses, passenger compensation | Charged to operations, not linked back to the missing part |
IATA estimated the airline supply-chain crisis cost the industry $11 billion in 2025: $3.1 billion in higher maintenance costs, $1.4 billion in extra spare inventory, and $2.6 billion in excess engine leasing to cover grounded aircraft. That last number is the one people miss. When you don’t have the part, you don’t just pay for the part. You pay for everything the aircraft isn’t doing while it waits.
Research on repairable spare parts makes the dynamic explicit: stockouts cause significant downtime costs, while the parts themselves tie up capital. The optimization target is total lifecycle cost, not the lowest possible inventory balance.
Criticality Segmentation Beats Uniform Cuts
The most common mistake in MRO inventory reduction? Applying the same target across every part category. A 20% blanket cut sounds clean in a boardroom presentation. On the shop floor, it means you’ve reduced safety stock on a critical hydraulic actuator with a 16-week lead time by the same percentage as commodity fasteners you can source overnight.
Effective programs segment the portfolio, then apply different policies to each segment.
The classic approach combines ABC analysis (ranking parts by annual spend) with VED classification (vital, essential, desirable based on failure consequence). A part can be low-cost and high-criticality at the same time. That $200 bearing on a critical rotating assembly might be a C-item by spend but a V-item by consequence. Treating it as a C-item alone is how you end up with an aircraft on the ground. This segmentation framework is foundational to effective aviation inventory optimization.
A hybrid research model combining Analytical Hierarchy Process with VED categories increased the average criticality score by 20.2% and the number of items flagged for stocking by 16.6% in the tested company. That’s the counterintuitive finding: sound optimization sometimes means stocking more of the right things, not less of everything.
The practical segmentation produces distinct policies:
- High-criticality, long-lead items (insurance spares): hold on-site or at the nearest hub. The cost of not having them dwarfs carrying cost. Low annual usage is not a reason to eliminate the buffer.
- High-value, low-frequency items (rotables, repairables): candidates for pooling across sites or repair-loop management. Reduce duplication, not availability.
- High-turn consumables: optimize order frequency, negotiate supplier-managed inventory or consignment, automate replenishment.
- Obsolete or superseded stock: identify and dispose. Every month they sit on the shelf, they consume carrying cost and warehouse space for zero operational value.
The segmentation only works when it’s connected to live asset data. If you don’t know which aircraft or equipment a part supports, you can’t assess failure consequence. If you don’t know what’s already at another site or in repair, you can’t pool.
Pooling Expensive Spares Across Sites
Multi-site operators face a specific version of the inventory cost problem: the same expensive, slow-moving spare held independently at every location, each site ordering its own buffer because it can’t see or access what other sites have.
Seadrill tackled this directly. Across 17 offshore rigs, they identified $48 million in inventory and verified $3.3 million in the first phase by shifting selected slow-moving spares to shared shorebase hubs. Instead of each rig holding its own buffer for a part used once every two years, the part sits at a central hub and transfers when needed.
The logic is sound. But it only works under two conditions:
- You know exactly where every pooled item is, in real time, at the hub level and in transit.
- Transfer and repair turnaround times fit within the failure-response window for that asset class.
If your hub-to-site logistics can deliver within the acceptable downtime window, pooling releases capital without increasing risk. If they can’t, you’ve just moved the stockout problem to a more centralized location.
This is where I see the most operational programs stall. The strategy is right. The data infrastructure to execute it is missing. You consolidate parts at a hub, then lose track of what moved where, what’s in repair, what’s in transit. The ERP says 4 units at the hub. Two are actually en route to different sites. One is at a vendor for repair with no estimated return date. The fourth is physically present. That’s not a 4-unit buffer. It’s a 1-unit buffer, and nobody knows it until someone needs the part.
The Visibility Layer Most Programs Skip
Here’s where I have a strong opinion, and it comes from watching dozens of MRO operations try to optimize inventory without first solving the visibility problem.
You cannot optimize what you cannot see.
Sichuan Airlines deployed RFID across a 60,000-part MRO inventory integrated with SAP. Their fixed inventory count dropped from 5 to 6 staff over 80 days to a two-week process. Daily counts went from two people and up to eight hours to one person and two to three hours. That’s not a marginal improvement. It’s a structural change in how fast and accurately they know what they have.
TAP Maintenance & Engineering invested EUR 750,000 in RFID for maintenance and inspection workflows and projected EUR 1.6 million in annual inventory-process savings, plus EUR 125,000 from digitizing inspection worksheets. The payback math worked because the problem wasn’t “we buy too much.” It was “we can’t find what we already bought.”
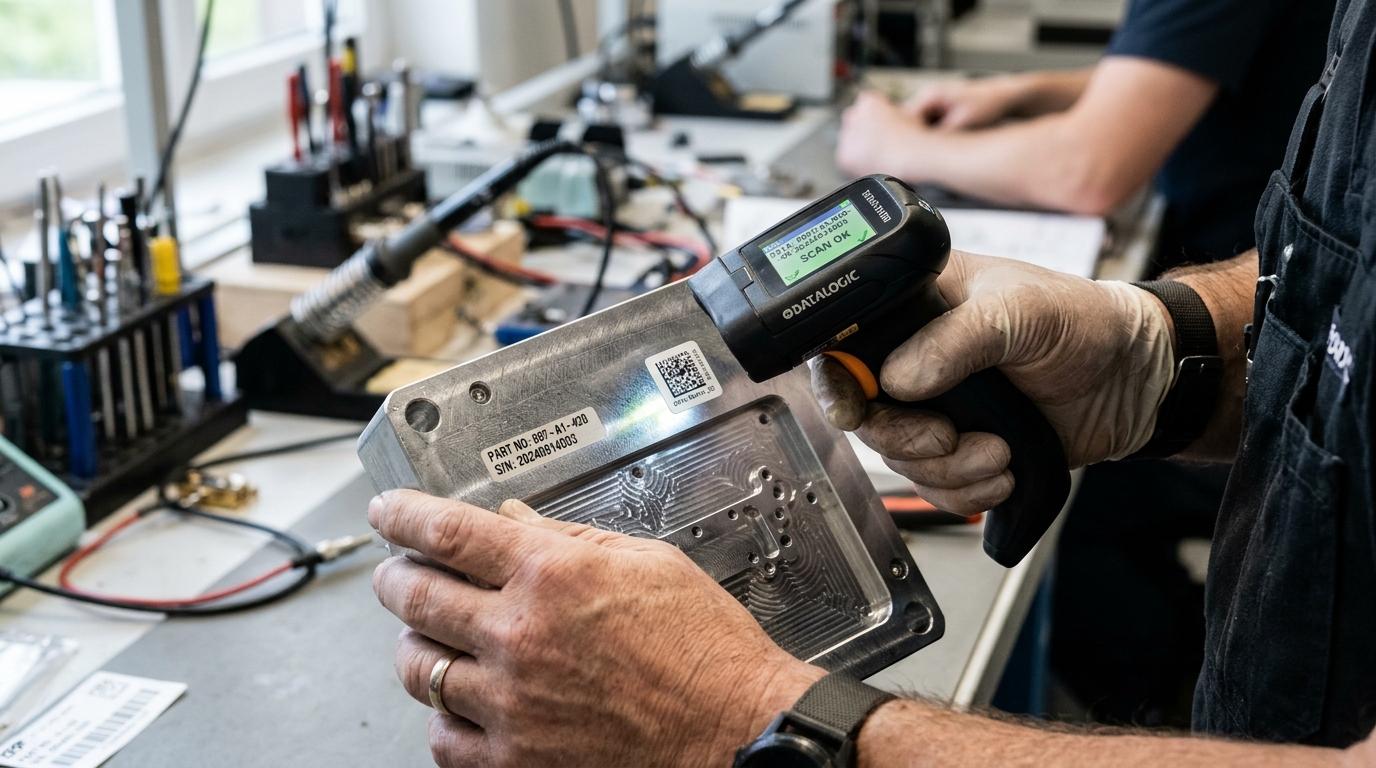
These cases focus on warehouse-level RFID. But the visibility gap extends beyond the storeroom. MRO parts move through a lifecycle: procurement, receiving, storage, issue, installation, removal, repair, return, restock, or disposal. At any moment, a significant percentage of your “inventory” is somewhere between those stages, and most systems lose track once a part leaves the shelf.
That’s the asset tracking dimension. When reusable containers carry parts between MRO shops and airline hangars, when ground support equipment moves across airport ramps, when rotable components cycle through repair vendors, each of those movements creates a blind spot if it’s not tracked. And every blind spot leads to either over-ordering (because you assume the part is gone) or stockout (because you assumed it was there).
Cellular and GNSS-based trackers on high-value reusable assets (ULDs, GSE, rotable containers, tooling kits) provide continuous position and status data that feeds back into the inventory picture. Not as a replacement for warehouse management systems, but as the layer that covers everything outside the four walls of the storeroom.
What Real Reductions Actually Look Like
I want to be honest about something the vendor ecosystem often glosses over: there’s no universal savings percentage for MRO inventory reduction. Anyone quoting a single number is selling, not advising.
What the evidence does show is a range, and the range depends heavily on starting conditions:
| Case | Intervention | Reported outcome | Evidence quality |
|---|---|---|---|
| Denbury Resources (oil & gas) | Contract high-turn items, automate purchase orders | $3.8M lower minimum stock, carrying cost down ~20%, turns from 1x to 3.3x, 73% fewer late deliveries in 30 days | Vendor case sheet; no independent audit disclosed |
| Tennessee Valley Authority | Five-year program with training, standardized policies | $47M net inventory reduction | Academic case study with organizational detail |
| GE Power | Planning optimization and simulation (GAINS) | 25% lower inventory investment, 23% lower carrying costs, 97%+ service levels | Vendor case study with quantified service metric |
| Seadrill (offshore) | Hub-and-spoke pooling of slow movers | $48M identified across 17 rigs, $3.3M verified in phase one | Vendor case; “identified” vs. “verified” language matters |
BCG has reported potential inventory and working-capital reductions of 10% to 50% and warehouse-cost reductions of 5% to 20% in manufacturing MRO. That range is wide enough to be almost meaningless without context. A company with zero prior optimization might see 30% to 40%. A company that’s already run two rounds of rationalization might see 8% to 12%.
The important discipline: separate what was identified from what was realized. Separate inventory value reduced from cash actually released. Separate cost avoided from cost eliminated. And always, always track service level, fill rate, and downtime alongside inventory value. A 25% inventory reduction that coincides with a 15% rise in emergency buys is not a win.
Building a Program That Doesn’t Backfire
The sequence matters more than the tools you choose.
- Establish a trustworthy baseline. Physical count or cycle count reconciled against the EAM/ERP. If your system says 10,000 SKUs and your shelves hold 7,200 (plus 1,800 items with no system record), you need to know that before you start cutting.
- Clean and harmonize item data. Merge duplicates, standardize descriptions, verify units of measure, link parts to asset bills of material. This is unglamorous work. It’s also where the largest hidden savings typically live.
- Segment by criticality, value, and lead time. Apply different stocking policies to each segment. Protect insurance spares. Target excess in low-criticality categories first.
- Identify pooling and repair-loop opportunities. For high-value, low-frequency items across multiple sites, evaluate whether centralized or regional hubs can serve the required response time.
- Deploy the visibility layer. RFID for storeroom accuracy. Asset trackers for items in transit, at repair vendors, or moving between sites. The goal is closing the gap between system state and physical reality on a continuous basis, not just during annual counts.
- Release stock in controlled waves. Reduce, don’t purge. Monitor fill rate, critical-spare coverage, and downtime after each wave before proceeding to the next.
- Measure what matters. Inventory value and turns, carrying cost, obsolete stock percentage, fill rate, stockout frequency, emergency purchases, repair turnaround, and downtime. If you only measure inventory dollars, you’ll optimize the wrong thing.
One more note on resilience. Satair’s 2026 outlook cites a Bain projection that engine shop-visit demand could exceed supply by 17% in 2030 if current trends continue. Oliver Wyman reports that half of MRO survey respondents plan AI investment in the next five years, but only a third plan to invest in IT infrastructure. That mismatch should concern you. AI recommendations are only as good as the data underneath them.
The goal is not the leanest possible inventory. It’s the most informed inventory: where every dollar of stock is there for a reason you can articulate, and every item’s location and status is known in real time.
If your MRO parts, tooling, or reusable containers become invisible once they leave the storeroom, that’s the gap that asset tracking closes. Whether it’s RFID at the bin level or cellular GNSS trackers on high-value rotables moving between hangars, shops, and vendors, the principle is the same: you can’t optimize what you can’t see.
If this is the problem you’re solving, talk to our team. We build these visibility layers for aviation and industrial MRO operations every day.

Frequently Asked Questions
What’s included in the true cost of MRO inventory?
Capital tied up in stock, carrying and handling (typically 17% to 25% of item value annually), obsolescence write-offs, emergency procurement premiums, and the downtime cost when a needed part is unavailable. Most organizations measure only the first two categories and miss the largest cost drivers.
How much can MRO inventory costs realistically be reduced?
There’s no universal number. Published cases range from 10% to 50% depending on starting conditions. A company with clean data and prior optimization rounds might see 8% to 15%. An organization with significant dead stock, duplicate SKUs, and no cross-site visibility could see 25% or more. Always track service level alongside cost reductions to ensure you’re not trading inventory savings for downtime.
Should all MRO parts be centralized in one location?
No. Pool expensive, slow-moving items at shared hubs when transfer time fits within the acceptable downtime window. Keep critical parts with long lead times at the site where they’re needed. Centralization of the wrong items just moves the stockout risk to a different address.
How does asset tracking help reduce MRO inventory costs?
Most MRO systems lose visibility once a part leaves the storeroom shelf. Asset tracking (RFID, cellular, GNSS) provides continuous location and status data for parts in transit, at repair vendors, or cycling between sites. This prevents over-ordering of items that already exist elsewhere and eliminates phantom inventory that inflates system counts.
Does AI alone solve MRO inventory optimization?
No. AI can improve demand forecasting and stocking recommendations, but it depends on accurate, consistent item master data, lead-time records, and real-time location information. If your underlying data is fragmented or stale, AI will automate bad decisions faster. Fix the data and visibility layer first.
What KPIs should an MRO inventory reduction program track?
At minimum: inventory value and turns, carrying cost, obsolete or inactive stock percentage, fill rate, service level, critical-spare coverage, stockout frequency, emergency purchase count, repair turnaround time, and asset downtime. Measuring only inventory dollars creates the illusion of progress while costs shift to emergency procurement and lost availability.








 +1 508 292 2210

2 Responses