

The global environmental monitoring market sits at roughly $14.4 billion as of 2024, projected to cross $20 billion by 2030. That number covers sensors, software, services, laboratory testing, and maintenance. A big tent. And yet, most industrial sites shopping for a real-time environmental data platform start their evaluation by looking at dashboards. Pretty tiles, color-coded alerts, a map with pins.
Here is the problem I keep seeing in the field: the dashboard is the last 5% of the system. The other 95% is measurement hardware, connectivity infrastructure, calibration routines, data validation logic, and the human workflow that turns an alert into an action. When that 95% falls short, the dashboard just visualizes unreliable data faster.
This article is for EHS managers, plant directors, and environmental consultants who need to evaluate real-time environmental data platforms for industrial sites without getting seduced by the demo. I will walk through what “real-time” actually means in regulatory terms, where deployments break down, what case studies reveal about ROI, and how to structure a procurement process that protects you.
“Real-Time” Means Different Things to Different Regulators
The phrase “real-time” sounds binary. Either data streams continuously or it does not. In practice, regulators define measurement intervals across a wide spectrum, and your permit dictates which definition applies to your facility.
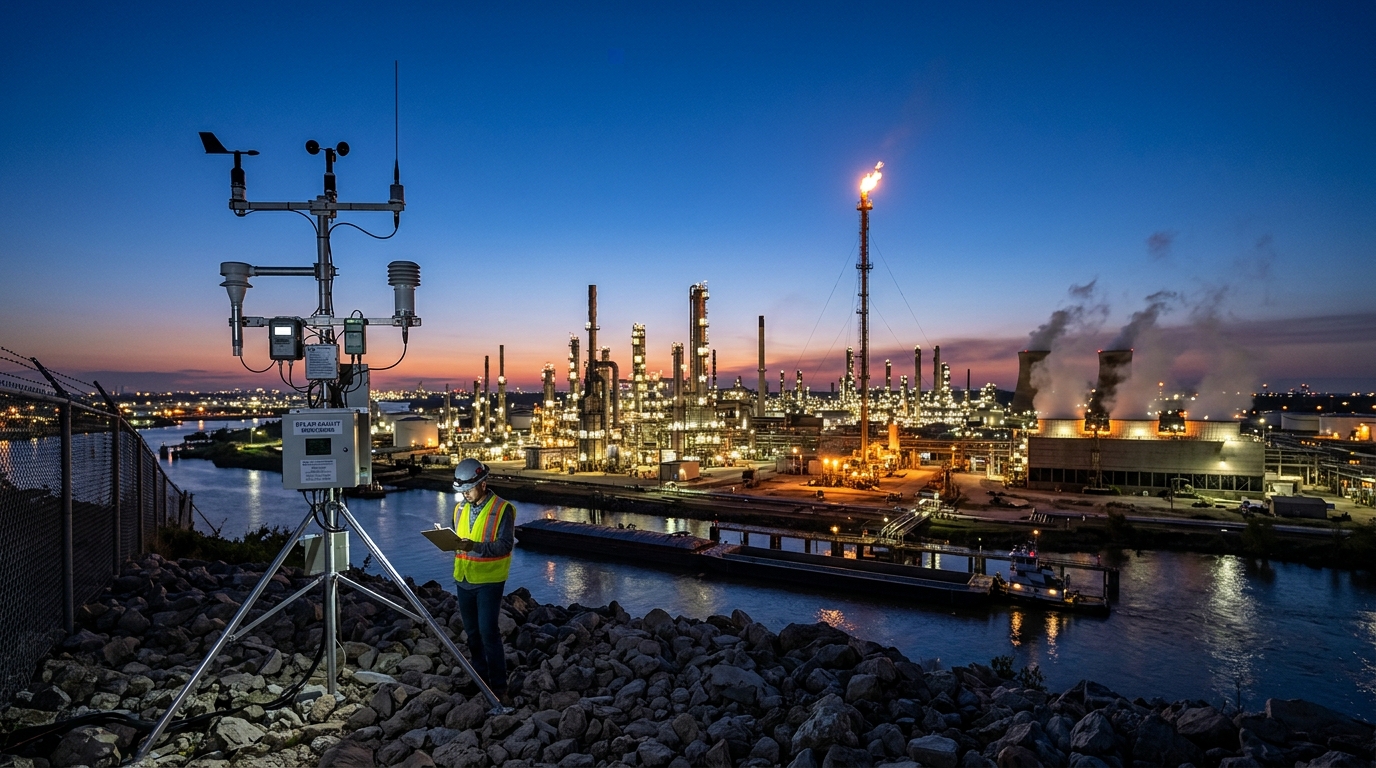
At one end, U.S. power-plant rules require continuous emissions monitoring (CEMS) for stack CO2, NOx, and SO2, with prescribed quality assurance checks. That is genuinely continuous: the instrument runs, the data flows, the record must be defensible.
At the other end, the federal refinery benzene fenceline monitoring program uses passive sorbent tubes collected every 14 days. The action level is 9 micrograms per cubic meter calculated as an annual average concentration difference. Not per-second. Not per-hour. Annual. A platform vendor calling both scenarios “real-time environmental monitoring” is stretching the term past its useful meaning.
Water permits add another layer. A published Pennsylvania industrial wastewater permit specifies continuous flow monitoring at one outfall, daily pH and dissolved oxygen monitoring, and quarterly PFAS sampling at another outfall. Four different measurement frequencies in a single facility permit.
Before you evaluate any platform, pull out your permit. List every parameter, the required measurement method, the sampling interval, and the reporting period. If the platform cannot accommodate those differences (continuous flow alongside quarterly grab samples alongside daily readings), it will either over-engineer some parameters or under-serve others.
The Measurement Chain Most Vendors Skip Past
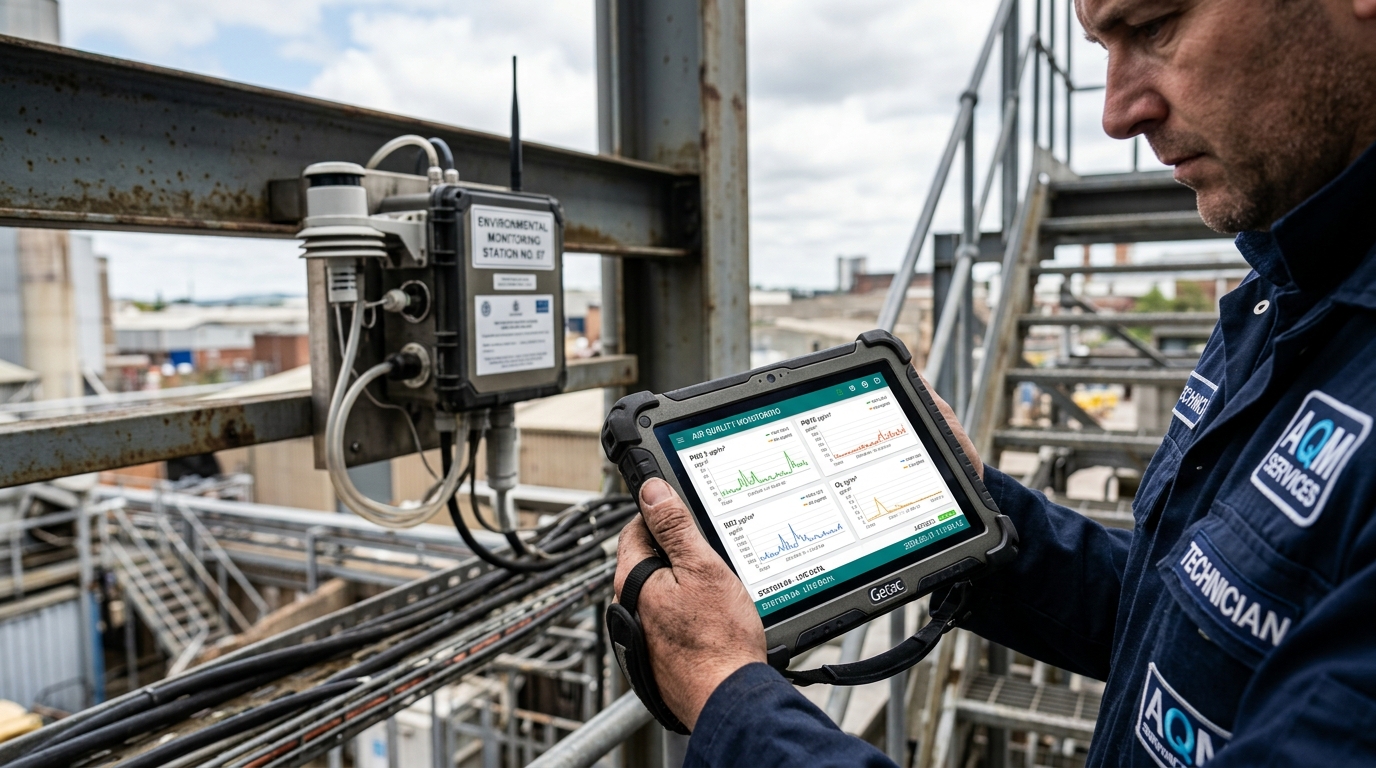
Every real-time environmental data platform depends on a chain: sensor reads a physical value, edge device timestamps and packages it, network transmits it, cloud or on-prem server stores it, software validates and displays it, a person investigates, and the response gets documented. Each link introduces latency, noise, or failure risk.
Most platform demos start at the cloud layer. The sensor and everything before it get a single slide. In my experience deploying IoT hardware across industrial and aviation environments, the physical layer is where 80% of implementation friction lives.
Sensors and calibration
EPA’s air sensor guidance recommends periodically collocating sensors alongside reference instruments, checking how accuracy changes with conditions and time, documenting calibration procedures, and reviewing for drift. This is not optional maintenance. It is the difference between a defensible reading and a number on a screen.
EPA also makes a distinction many vendors gloss over: lower-cost air sensors covered by its testing protocols generally do not meet the stringent requirements of regulatory air-quality instruments. Those protocols target supplemental, non-regulatory use. If your permit requires a specific reference method, a cheaper sensor network does not automatically satisfy it, no matter how good the dashboard looks.
Connectivity at harsh or remote sites
This is the gap I see most often. Mining operations, offshore platforms, large chemical complexes, remote pipeline corridors: these sites frequently have unreliable cellular coverage, restricted Wi-Fi, and no appetite for running fiber to every monitoring point. The software vendor assumes connectivity exists. The site knows it does not.
Edge computing (processing and storing data locally, then syncing when connectivity returns) is not a luxury feature. For many industrial sites, it is the only architecture that produces a complete dataset. Without it, you get gaps in the record exactly when you need it most, during upsets, storms, or equipment failures that also disrupt the network.
Interoperability
Most industrial sites accumulate sensors from multiple manufacturers over years of expansions, retrofits, and acquisitions. A gas analyzer from one vendor, a weather station from another, water quality probes from a third. The OPC Unified Architecture standard, released in 2008, provides machine-to-enterprise interoperability with encrypted communication and audit logs. It helps. But “supports OPC UA” on a datasheet does not mean plug-and-play integration on a Tuesday afternoon.
The practical question for any platform: can it ingest data from the specific hardware already installed at your site, preserve the original timestamps and units, and flag when a feed goes silent? If the answer requires replacing all your sensors with the platform vendor’s preferred brand, you are buying vendor lock-in, not a solution.
False Positives Will Cost You More Than Missed Readings
Intuition says the biggest risk is missing an event. A leak, an exceedance, a threshold breach that nobody sees. That is a real risk. But in practice, many industrial deployments suffer more from the opposite problem: too many alerts that mean nothing.
A peer-reviewed controlled-release study tested 11 continuous methane monitoring solutions. False-positive rates ranged from 0% to 79.1% across the tested solutions. Think about that range. One system cried wolf four out of five times. The operational cost is not just the wasted investigation. It is the erosion of trust. After enough false alarms, the operations team starts ignoring alerts. And then the real event gets buried in noise.
A separate blinded European evaluation published in 2026 tested eight commercial methane technologies. Reported false-positive rates were lower (0% to 11%), but estimated-versus-actual emission-rate slopes ranged from 0.09 to 1.13. In other words, some systems severely underestimated actual emissions. Detection is not quantification. An alert that says “something is happening” without a reliable estimate of how much is happening gives you a starting point, not an answer.
The lesson for procurement: demand controlled-release test results specific to your expected release sizes, wind conditions, and equipment layout. If a vendor cannot provide them, run a site pilot before committing. A 30-day trial with known baseline conditions will reveal more than any product demo.
What Three Real Deployments Reveal
Case studies from vendors are marketing. I know that, you know that. But they still contain useful signal if you read them for the mechanism (what changed operationally) rather than the headline.
TotalEnergies: data led to an operational decision, not just a report
TotalEnergies connected equipment data to headquarters through an industrial historian (AVEVA PI System), contextualized measurements through an asset framework, and optimized one site’s power-delivery configuration. The reported result: 15% annual CO2 reduction at that site.
The key word is “optimized.” The platform did not reduce emissions. A human used the platform’s data to change how power was delivered, and that change reduced emissions. The platform’s value was making the operating alternatives visible and measurable. If your team does not have the authority or the process to act on what the data shows, the prettiest dashboard in the world will just document your inaction.
Steel producer: frequent water readings shortened response time
An unnamed multinational steel company installed continuous water-quality monitoring on cooling towers and reported a 13% reduction in water-treatment costs plus more than 20 hours per month saved on manual testing. The mechanism: detecting chemistry changes earlier allowed treatment adjustments before the problem escalated.
The unnamed company and supplier-reported figures mean you cannot take the 13% at face value. But the logic holds. If your current process depends on someone walking to a sampling point, collecting a grab sample, sending it to a lab, and waiting for results, then the gap between “chemistry changed” and “we adjusted treatment” could be days. Continuous instrumentation shrinks that gap to minutes. Whether that translates to 5% or 15% savings depends entirely on your site’s water chemistry, treatment costs, and current response workflow.
Chevron Richmond: monitoring hardware does not equal monitoring compliance
This one matters because it is not a success story. The Bay Area Air Quality Management District disapproved the fenceline monitoring plans of all five Bay Area refineries in October 2023 for failing to meet regulatory requirements. Chevron Richmond became the first to resolve the disapproval in a June 2025 agreement. The terms: install four hydrogen-sulfide point monitors (including one additional monitor), improve operation and maintenance provisions, provide downloadable real-time and historical public data, submit quarterly quality-control reports, and pay a $100,000 penalty.
The refineries had monitoring equipment. What they lacked were adequate monitoring plans: proper sensor placement, maintenance protocols, data quality procedures, and public accessibility. Technology deployed without governance failed regulatory scrutiny.
If you are evaluating platforms, this is the most important case study here. Not because of the penalty amount, but because it proves that the gap between “we have sensors” and “our monitoring program is defensible” is where regulatory risk actually lives.
Stack, Fenceline, Community: Three Monitors, Three Different Answers
A common procurement mistake is treating “environmental monitoring” as a single problem with a single solution. The Bay Area air district explicitly lists community monitoring, refinery fenceline monitoring, and on-site ground-level monitoring as separate programs around Chevron Richmond. Each measures different things, at different locations, for different audiences.
Stack CEMS measure what leaves a specific exhaust stream. Fenceline devices measure conditions at the facility boundary. Community monitors measure what neighbors breathe. One reading cannot substitute for another. A platform that conflates them into a single “environmental score” is hiding important distinctions.
The regulatory landscape is diverging, not converging
If you operate internationally, you face a split. The EU’s revised Industrial Emissions Directive entered into force in August 2024, covering approximately 75,000 installations and livestock farms. It introduced stricter emissions-limit setting, electronic permitting, and new reporting requirements (first reports expected in 2028).
In the United States, the direction is more complex. EPA proposed in September 2025 to remove greenhouse-gas reporting obligations for 46 source categories and suspend reporting for most remaining petroleum and natural gas categories until reporting year 2034. That is a proposal, not a final rule. But it signals a different trajectory.
The implication for platform selection: do not buy a system designed around a single assumed global reporting rule. Design your system around your actual permits, your actual jurisdictions, and your operational needs. If your EU facilities need one reporting cadence and your U.S. facilities need another, the platform must handle both without forcing one into the other’s template.
Satellites add reach but not continuity
Carbon Mapper reported 2,661 published Tanager-1 methane plumes from oil and gas and 1,327 from solid waste during a period extending into September 2025. Satellite observations are powerful for wide-area screening and finding sources nobody knew about.
But they are not continuous site-level monitoring. Overpass frequency, cloud cover, and resolution limit what a satellite can do for a specific facility on a specific day. And resilience is a real question: MethaneSAT lost contact on June 20, 2025, and was likely unrecoverable. If your compliance depends on continuous data, a satellite is a complement to site instruments, not a replacement.
How to Buy a Platform Without Buying a Problem
After fifteen years of deploying tracking and monitoring hardware in industrial and aviation environments, here is the framework I use when evaluating environmental data platforms for a client site.
Start with the pollutant and the permit, not the platform. List every parameter you must monitor, the prescribed measurement method, the required interval, and the averaging period. This is your specification. Any platform that cannot map to it is disqualified before the demo.
Demand hardware transparency. What sensors does the platform require or support? What is the calibration schedule? What happens when a sensor drifts or fails? Who maintains the physical hardware? A platform that only sells software and leaves hardware to “your team” is transferring the hardest part of the problem back to you.
Test connectivity under real conditions. Run a pilot at the most challenging monitoring point on your site (the one with the worst cellular signal, the most vibration, the harshest weather). If the system maintains data integrity there, it will work everywhere else. If it does not, you know before you have signed a multi-year contract.
Validate alert performance. Ask for false-positive and false-negative rates from controlled tests. If the vendor does not have them, build a 30-day evaluation period into the contract where you compare platform alerts against known conditions.
Separate the layers you are buying. Historians, EHS management suites, emissions calculators, and sensor networks solve different problems. An industrial historian like AVEVA PI System collects and contextualizes operating time series. An enterprise environmental suite like Cority consolidates cross-site compliance workflows. An emissions calculator like Sphera handles audit-ready accounting. You may need one product from several categories, not one product that claims to do everything.
Document the response workflow. An alert without a named responder, a defined investigation procedure, and a place to log the outcome is just noise. The Chevron Richmond case proved this. Build the human workflow before you configure the technology.
Where Environmental Monitoring Meets Asset Tracking
Here is something the pure-software environmental platforms miss: in many industrial operations, the environmental sensors themselves are mobile or distributed assets. Temperature loggers travel with shipments. Air quality monitors get repositioned across a facility. Water quality probes move between outfalls during seasonal changes. In aviation MRO and ground support, environmental readings must follow the equipment, not just the fixed location—a principle that applies equally to how real-time tracking supports aircraft production where assets and monitoring devices move through complex assembly workflows.
This is where the overlap between environmental monitoring and asset tracking becomes operationally significant. If you cannot locate the sensor, you cannot trust the reading. A temperature exceedance logged at “Sensor 14” is useless if nobody knows where Sensor 14 was deployed last Tuesday.
At Datanet, we approach environmental monitoring from the hardware and integration layer up. Our environmental tracking devices are built for industrial conditions: temperature, humidity, soil, and water monitoring in environments where consumer-grade hardware fails. We pair them with asset tracking solutions so that every environmental reading carries location context, chain of custody, and a maintenance history.
The result is not just a dashboard. It is a defensible record of what was measured, where, by which instrument, last calibrated when, and who reviewed the result. That is the gap between monitoring and compliance.
If your current environmental monitoring setup gives you data without context, or if you are evaluating platforms and want to understand how the hardware layer should work before committing to software, talk to our team. We do not sell dashboards. We build the measurement infrastructure that makes dashboards trustworthy.
Frequently Asked Questions
What makes an environmental data platform genuinely “real-time”?
There is no universal definition. Power-plant CEMS measure stack emissions continuously. Refinery benzene fenceline monitoring uses 14-day passive samples evaluated annually. Water permits may require continuous flow but only quarterly sampling for certain pollutants. Ask for sampling interval, transmission latency, quality-control delay, and regulatory averaging period separately. A platform refreshing a dashboard every second does not make a 14-day sample “real-time.”
Can lower-cost air sensors replace compliance-grade instruments?
Generally no. EPA states that the air sensors covered by its performance testing protocols do not meet the stringent requirements for regulatory air-quality instruments. They are suited for supplemental or informational use. Always check your specific permit and required measurement method before assuming a sensor network satisfies compliance obligations.
How do I evaluate alert reliability before purchasing?
Request controlled-release test data showing detection rates, false-positive rates, and quantification accuracy under conditions similar to your site. Peer-reviewed methane monitoring evaluations found false-positive rates ranging from 0% to 79.1% across tested solutions. If a vendor cannot provide comparable evidence, negotiate a 30-day site pilot with documented baseline conditions into your contract.
What are the hidden costs of deploying environmental monitoring IoT?
Hardware maintenance and calibration are the biggest surprises. Sensor drift requires periodic collocation with reference instruments. Connectivity infrastructure (cellular boosters, edge gateways, backup power) adds cost at remote sites. Data ingestion fees from cloud platforms can scale unpredictably with sensor count and reporting frequency. Budget for physical upkeep, not just software licenses.
Does satellite monitoring replace on-site sensors?
No. Satellites like Carbon Mapper’s Tanager-1 excel at wide-area screening and discovering unknown emission sources. But overpass frequency, cloud cover, and resolution limitations mean they cannot provide continuous site-level records. The loss of MethaneSAT in June 2025 illustrates the resilience concern. Treat satellite data as a complementary discovery layer, not a substitute for site instruments required by your permit.
How should multi-site operators handle diverging regulations across jurisdictions?
The EU’s revised Industrial Emissions Directive (effective August 2024) is tightening requirements for approximately 75,000 installations, while a 2025 U.S. EPA proposal would remove greenhouse-gas reporting for 46 source categories. Design your platform around each facility’s actual permit obligations, not a single assumed global standard. The system must accommodate different measurement intervals, reporting formats, and compliance thresholds simultaneously.







 +1 508 292 2210
