

IATA estimated aviation supply-chain disruption at more than $11 billion for 2025. Of that, $1.4 billion was excess spares inventory and AOG desk spend alone. And a 2024 MRO survey found that 62% of inventory planners reported low confidence in their own reorder-point calculations.
That second number is the one I keep coming back to. Not because the tools don’t exist. They do. But because most organizations stack software on top of inventory they can’t physically see. They forecast demand with AI. They automate procurement with SAP. Then a mechanic in Tulsa spends 45 minutes searching for a part the system swears is on shelf B-17.
Aviation inventory optimization isn’t a software category. It’s a discipline that starts with physical visibility and ends with financial performance. This piece covers what that discipline actually requires: the cost structure that makes it urgent, the technical stack that makes it work, four case studies that prove ROI, and the layer most organizations still skip.
What Aviation Inventory Optimization Actually Means
Aviation inventory optimization is the practice of stocking, pooling, forecasting, and replenishing aircraft spare parts to maximize fleet availability while minimizing capital tied up in rotables, consumables, and expendables. It spans classification (ABC analysis), demand forecasting (from statistical models to AI/ML), procurement automation, physical tracking (RFID, IoT), regulatory traceability (FAA Form 8130-3, EASA Form 1), and parts redistribution through pools and used serviceable material (USM) channels.
If that sounds like a lot of layers, it is. And that’s exactly why it’s hard.
Generic inventory management cares about stock levels and reorder points. Aviation inventory optimization operates under constraints unique to this industry:
- Certification pressure. Every part installed on a commercial aircraft must carry airworthiness documentation. An uncertified part isn’t just noncompliant. It’s a safety hazard and potentially a criminal matter.
- Intermittent demand. MRO parts consumption is “lumpy”: long stretches of zero demand punctuated by sudden, urgent need. Classical forecasting models built for retail or manufacturing choke on this pattern.
- AOG urgency. When an aircraft can’t fly, the meter runs at $10,000 to $150,000 per hour depending on aircraft type and route. There is no “we’ll get to it Monday.”
- Regulatory traceability. The FAA’s Suspected Unapproved Parts program, refreshed in January 2025, and EASA’s parallel register mean every part must have a verifiable chain of custody.
The core tension is simple to state and difficult to manage: too much inventory ties up capital that could fund fleet growth or route expansion. Too little inventory risks AOG events that bleed cash by the hour. Optimization lives in the middle, and the middle moves constantly—directly impacting aviation asset utilization rates across the fleet.
The Cost of Getting It Wrong
The global civil aviation MRO market reached $103.9 billion in 2024, with Oliver Wyman projecting growth to approximately $124 billion by 2034. The inventory function is the largest single controllable spend inside MRO. Organizations typically invest 15% to 25% of their annual maintenance budget just holding parts in stock. Carrying costs run 20% to 30% of inventory value per year.
The supply side makes it worse. Only about 7,000 aircraft were delivered between 2019 and 2024, far below pre-pandemic projections. The commercial aircraft backlog pushed past 17,000 units. Airlines are keeping older airframes flying longer, which drives higher parts demand at the exact moment the OEM supply base is bottlenecked.
Three cost categories define the urgency.
AOG: The Per-Hour Penalty
Boeing estimates a single AOG event costs airlines $10,000 to $150,000 per hour. Aggregated globally, AOG downtime costs the airline industry roughly $50 billion per year. Every hour a part can’t be located, the meter is running.
Capital Lock-Up: The Silent Drain
IATA pegs excess spare-parts inventory holding and AOG desk spend at $1.4 billion for 2025 alone. This isn’t parts that were needed. This is capital that sat on shelves, sometimes for years, while someone else’s fleet went AOG for the same component.
Counterfeit Parts: The Hidden Tax
The FAA estimates that roughly 2% of the 26 million parts installed on aircraft each year are counterfeit or unapproved. That’s approximately 520,000 parts. Operation Wingspan led to more than $5 million in seizures and around 120 criminal convictions. Two fatal accidents have been traced to counterfeit components. This isn’t an edge case. It’s a systemic risk that forces every serious inventory operation to invest in traceability, adding cost layers that generic optimization models don’t account for.
Six Layers of a Stack That Works
Aviation inventory optimization is not one tool or one algorithm. It’s a stack where each layer builds on the one beneath it. Skip one, and the layers above it underperform. Here’s the complete architecture.
Layer 1: Classification
ABC analysis is the starting point. The top 20% of SKUs by value or flight-critical risk (“A” items) drive roughly 80% of your financial exposure. Multi-criteria classification adds lead time and consumption pattern as scoring dimensions. This is the foundation. If you don’t know which parts matter most, nothing else you do will be efficient.
Layer 2: Demand Forecasting
Standard (s,S) min-max reorder policies work for high-volume consumables. They break down for rotables and slow-moving repair items where demand is intermittent. The Syntetos-Boylan Approximation (SBA) has been shown to lift service levels from 95% to 99% on the same budget for lumpy-demand SKUs. Branching Poisson Process and artificial neural network models handle tail-risk rotables where a single missed forecast creates an AOG event.
AI/ML demand forecasting is the most visible trend right now, and for good reason. But here’s the thing nobody puts in the brochure: AI forecasting on bad inventory data produces confident wrong answers, faster. The model is only as good as the physical inputs feeding it. Which is why Layer 4 matters more than most people think.
Layer 3: Procurement Automation
Source-to-pay platforms compress the time between “we need a part” and “we have a PO.” Embraer’s recent SAP Ariba deployment (detailed in the case studies below) collapsed 21-day sourcing cycles to hours. For any operator managing thousands of supplier contracts, procurement automation is the difference between reactive buying and strategic buying. And fewer reactive purchases means less safety stock required to cover sourcing lag.
Layer 4: Physical Visibility
This is the layer most organizations skip. And it’s the one that determines whether the others deliver their advertised ROI.
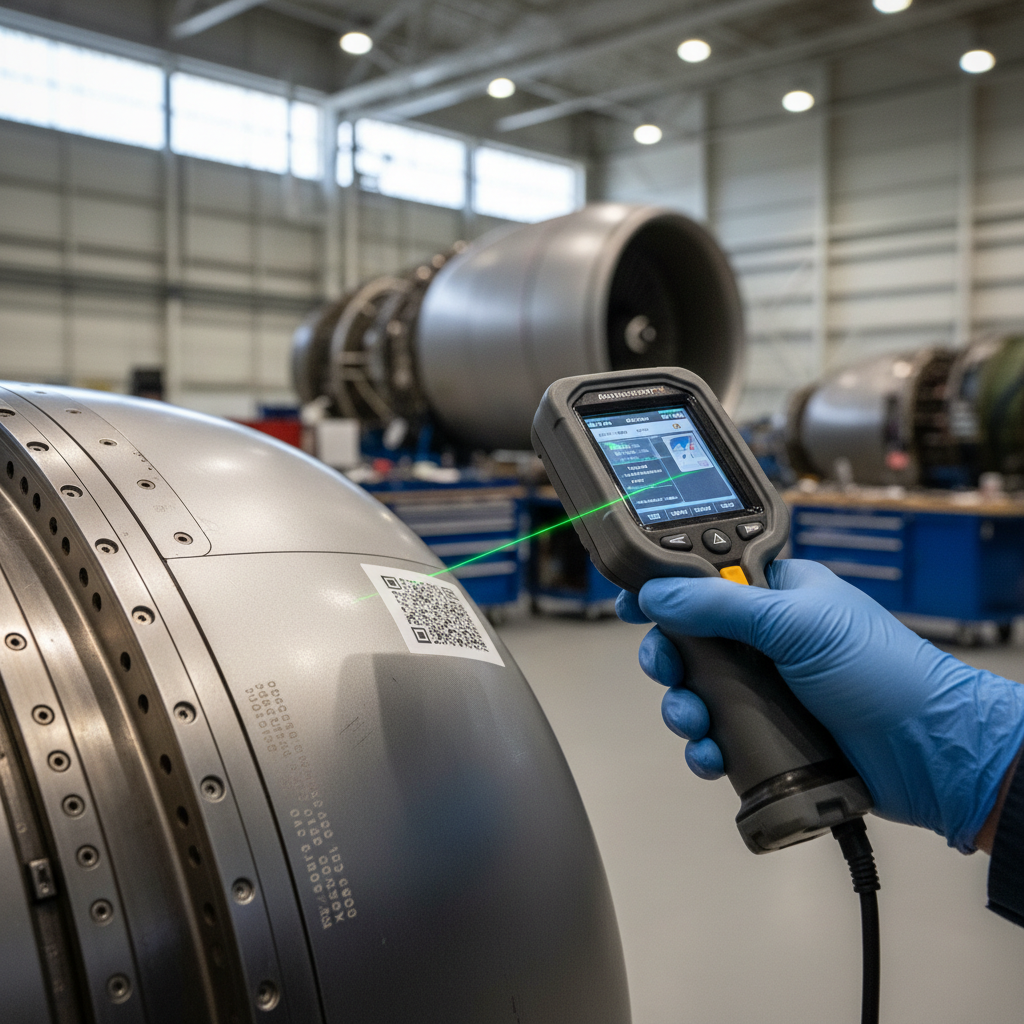
RFID tagging against ATA Spec 2000 and AS5678 standards gives you real-time location and status of parts on the warehouse floor. IoT-enabled trackers go further: they report position, movement, and environmental conditions over cellular or satellite networks without requiring manual scans. When a rotable moves from shelf to bench to aircraft to MRO shop and back, the system knows.
The distinction matters. Shipment tracking tells you a part arrived at your facility. Asset tracking follows that part through its entire lifecycle: receipt, storage, dispatch, installation, removal, repair, return to pool, eventual retirement. For rotables and pooled components (items that cycle repeatedly through the system), asset tracking is the only way to maintain true visibility. Without it, your ERP shows theoretical stock. With it, you have actual stock. The gap between those two numbers is where AOG events live.
Layer 5: Traceability and Compliance
Every commercial part needs a Form 8130-3 (FAA) or EASA Form 1 at intake. Blockchain-based provenance ledgers, like Honeywell’s GoDirect Trade platform and Satair’s Google Cloud implementation, create tamper-evident audit trails for used serviceable material. Given 520,000 suspect parts entering the system annually, this layer is quickly moving from nice-to-have to regulatory expectation.
Layer 6: Pool and Redistribution
Not every part needs to sit in your warehouse. Rotable pooling agreements let operators share inventory across airlines and hubs. USM redistribution turns surplus stock into revenue. Lufthansa Technik’s 2025 expansion into direct USM sales signals that pool and marketplace economics are now core optimization levers, not side projects. Meanwhile, dedicated AOG logistics networks (Sterling/Kuehne+Nagel’s new expedited-delivery partnership with SATS at Singapore-Changi is the latest example) make pool-based replenishment feasible across geographies. “Time to first kit” during an AOG event is now a contractable service level, not an ad-hoc scramble.
Four Case Studies That Prove ROI
Theory is useful. Audited numbers are better.
Embraer: Procurement Automation at Scale
Embraer deployed SAP Ariba across its source-to-pay chain and reported an approximately 80% reduction in supply-chain operations time. The headline: 42,000 hours saved annually on procurement. Of those, 21,000 came from automated contract creation and 19,000+ from improved sourcing. About 5% of full-time roles were redirected from transactional tasks to strategic work.
The lesson isn’t “buy SAP.” It’s that for an OEM or large MRO, inventory optimization is fundamentally a procurement-and-contract problem. Inventory sits on the shelf because the sourcing cycle took 21 days. Compress that cycle, and you need less safety stock to cover the gap.
Satair: Removing Service Friction
Satair, Airbus’s aftermarket distribution arm, deployed a Google Cloud-based assistant with Atos and saw a 58% increase in yearly revenue and 51% more orders. The mechanism wasn’t more inventory. It was faster order intake. Case-handling automation removed the bottleneck that kept well-stocked shelves from reaching customers who needed parts.
Satair didn’t have a supply problem. It had a visibility and friction problem on the demand side. Optimization doesn’t always mean fewer parts. Sometimes it means parts reaching the right hands faster.
Delta Air Lines: RFID Across 700+ Aircraft
Delta deployed an RFID inventory platform across more than 700 aircraft, covering roughly 140,000 life vests and over 40,000 oxygen generators. With AS5678-certified passive tags and 15-foot read ranges, the airline reduced a cycle inventory to a 45-second walk down the aisle. ROI was measured in months.
Delta’s program director stated the goal plainly: improvement “not by a few percentage points, but by orders of magnitude.” Physical visibility, at scale, delivers that kind of step change.
Sichuan Airlines: RFID + SAP Integration
Sichuan Airlines integrated Xerafy Metal Skin RFID labels with SAP ERP across 100+ aircraft and 60,000 MRO parts spread over six hubs. Daily inventory counts dropped from two employees working eight hours to one person working two to three hours. Full fixed counts went from five to six people over 80 days to just two weeks.
Think about what that means operationally. The staff that used to count parts is now available for actual maintenance work. And the data feeding the ERP went from “what someone typed last Tuesday” to “what the tag confirmed this morning.”
| Case | Operator | Primary Lever | Headline Result |
|---|---|---|---|
| Procurement Automation | Embraer | SAP Ariba source-to-pay | 42,000 hours/year saved; 80% ops-time reduction |
| Service Friction Removal | Satair (Airbus) | Google Cloud + Atos AI assistant | +58% revenue; +51% orders |
| Physical Visibility | Delta Air Lines | AS5678 passive RFID tags | 700+ aircraft; cycle count in 45 seconds; ROI in months |
| Physical Visibility + ERP | Sichuan Airlines | Xerafy RFID + SAP | Daily counts: 8h to 2-3h; Full counts: 80 days to 2 weeks |
The Layer Most Organizations Skip
I’ve spent 15+ years deploying IoT solutions for industrial operators. Here’s the pattern I see over and over in aviation.
An airline or MRO invests six figures in demand-forecasting software. They implement ABC classification on 30,000 SKUs. They negotiate pool agreements and consignment terms with suppliers. All good moves.
Then you walk into their hangar warehouse and ask: “Where, exactly, is part number 1234-5678 right now?”
Silence. Then: “Let me check the system.” Followed by: “The system says shelf C-12.” Followed by a 20-minute walk that ends with the part not being there.
That gap between system-of-record and physical reality is where most inventory optimization ROI goes to die. It’s the reason 62% of planners don’t trust their reorder points. The reorder points were calculated correctly. The data underneath was wrong.
Predictive maintenance platforms have pushed dispatch reliability from 97.5% to 99.2% and reduced unscheduled events by 35% to 40%. That’s real. But predictive maintenance that flags a likely APU failure in 200 flight hours means nothing if the replacement rotable can’t be located in your own warehouse within minutes.
Physical asset tracking closes this gap. RFID handles the warehouse floor. Cellular and satellite IoT trackers handle rotables in transit, in pool circulation, or sitting at an MRO shop halfway around the world. When those signals feed your ERP or MRO platform in real time, three things happen:
- Reorder points become trustworthy (because they’re based on actual consumption, not estimated consumption).
- AOG response time drops from hours to minutes (because you know where the part is, not where it should be).
- Pool economics improve (because pooled rotables are visible across the entire cycle, not just at check-in and check-out).
This isn’t theoretical. Delta proved it across 700+ aircraft. Sichuan Airlines proved it across six hubs. The technology is mature, certified, and cost-effective at fleet scale. The question isn’t whether it works. It’s why more operators haven’t made it the first step instead of the last.
Where to Start Without a Three-Year Roadmap
Full digital transformation makes excellent board-deck material. In practice, most MROs and operators need early wins before the larger budget gets approved.
Phase 1 (Weeks 1-4): Classify and prioritize. Run ABC analysis on current inventory, weighted by AOG risk and flight-critical impact, not just unit cost. Identify the top 10% of SKUs that drive 80% of your downtime exposure. This costs nothing but time and attention.
Phase 2 (Months 2-3): Tag your high-value rotables. Attach RFID or IoT tracking devices to A-class rotables and pooled components. Start with one hub. Get clean location and movement data flowing into your ERP. For airfreight-sensitive assets, DO-160 certified trackers are available that won’t trigger compliance issues.
Phase 3 (Months 3-6): Connect physical data to your planning tools. Once your ERP knows where parts actually are, your reorder points and safety-stock calculations improve immediately. No AI required at this stage. Just accurate inputs.
Phase 4 (Months 6-12): Layer in advanced forecasting and automation. With clean data flowing, AI/ML demand forecasting tools deliver what they advertise. Procurement automation can trigger POs based on actual consumption, not estimated patterns.
The sequence matters. Visibility before software. Data quality before algorithms. Quick wins before enterprise rollout.
If your rotables go invisible after they leave the shelf, that’s the gap asset tracking closes. We work with airlines and MROs to deploy tracking solutions that feed live data into existing platforms, no rip-and-replace required. Talk to our team or reach us at info@datanetiot.com.

Frequently Asked Questions
What is aviation inventory optimization?
It is the discipline of stocking, pooling, forecasting, and replenishing spare parts for aircraft to maximize fleet availability while minimizing tied-up capital. It spans ABC classification, demand forecasting (statistical and AI/ML), procurement automation, RFID and IoT tracking, regulatory traceability (FAA Form 8130-3, EASA Form 1), and pool-based redistribution of used serviceable material.
How much does an AOG event cost?
Boeing estimates AOG events cost airlines $10,000 to $150,000 per hour, depending on aircraft type and route. Globally, AOG downtime is estimated at roughly $50 billion per year. Inventory optimization targets this cost by reducing the time to locate, verify, and deliver the needed part.
What role does AI play in aviation inventory management?
AI improves demand forecasting for intermittent-consumption parts where traditional models underperform. Published results show service-level improvements from 95% to 99% on the same budget. Predictive-maintenance integration has reduced unscheduled events by 35% to 40%. The caveat: AI models require accurate physical inventory data to produce reliable outputs.
How does RFID improve aviation parts inventory?
RFID tags certified to ATA Spec 2000 and AS5678 enable automated, accurate inventory counts in seconds instead of hours. Delta Air Lines reduced cycle inventory to a 45-second walkthrough. Sichuan Airlines cut daily count time from eight hours to two to three hours. Both reported ROI within months of deployment.
Why is parts traceability critical in aviation?
The FAA estimates approximately 520,000 counterfeit or unapproved parts are installed on aircraft annually, about 2% of 26 million total. Traceability through serialized RFID, blockchain ledgers, and certification documentation protects operators from safety risk, regulatory enforcement, and criminal liability. Two fatal crashes have been linked to counterfeit components.
What is the difference between shipment tracking and asset tracking for aviation parts?
Shipment tracking ends at delivery. Asset tracking follows the part through its full lifecycle: receipt, storage, dispatch, installation, removal, repair, return to pool, and disposal. For rotables and pooled components that cycle repeatedly through the system, asset tracking provides continuous visibility that shipment tracking cannot.








 +1 508 292 2210

One Response