

I’ve walked into operations centers where the asset tracking dashboard looks impressive. Green dots on a live map. Clean status tables. Real-time feeds. And yet the team can’t answer the only question that matters: what should we do differently tomorrow because of what this data tells us today?
That disconnect is where asset tracking data analytics either earns its keep or becomes expensive wallpaper. The asset tracking market is estimated at $28.97 billion in 2026, with most spending going to hardware and connectivity. The analytics layer (the part that converts location pings into operational decisions) is where most deployments stall.
Meanwhile, the cost of not acting keeps climbing. CargoNet reported nearly $725 million in estimated supply-chain theft losses for 2025, up 60% from the prior year, with average theft values near $274,000 per incident. Visibility alone didn’t prevent that. Actionable analytics might have.
If you’ve deployed trackers (or you’re about to) and the data needs to do more than populate a map, this is for you.
Tracking vs. Analytics: The Distinction That Costs You Money
Tracking answers “where is it?” Analytics answers “so what?”
A GPS ping tells you a container is at coordinates 51.2, 4.4. Analytics tells you that container has been dwelling at that depot for 11 days, it should be in a return loop, and three other containers from the same pool are stuck there too. One is a data point. The other is a decision.
GS1’s EPCIS standard captures the “what, when, where, why, and how” of asset events, not just coordinates. Version 2.0 added sensor data, JSON-LD support, and REST APIs for capture and query across organizations. The interoperability framework exists. The gap is usually in connecting events to workflows that trigger action.
This is also where the shipment tracking vs. asset tracking distinction matters most. Shipment tracking ends at delivery: the package arrived, job done. Asset tracking follows the asset through its entire lifecycle: deployment, use, return, dwell, maintenance, redeployment. When you add analytics to that full cycle, you start seeing utilization patterns, pool imbalances, and maintenance windows that shipment-level visibility simply can’t reveal.
The practical architecture has five layers: asset identity and master record; observation hardware (tags, readers, sensors); connectivity and data ingestion; a historical event store with an analytical engine; and an action layer that routes insights to the person who can act on them. Skip any layer and the chain breaks. A comprehensive asset tracking platform integrates these layers to deliver actionable intelligence.
Your Tracking Data Is Probably Dirtier Than You Think
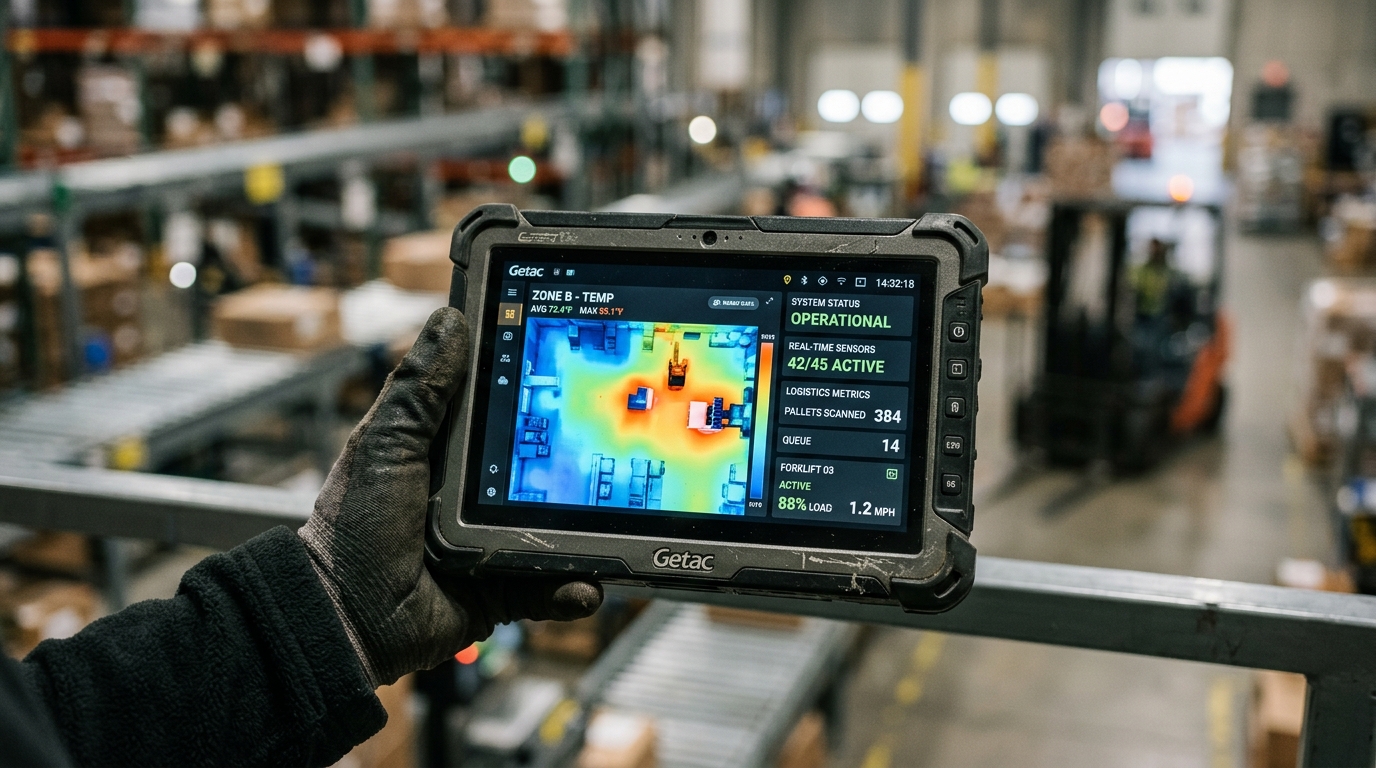
Deploying 500 tags is the easy part. Trusting the data they produce is harder than any vendor slide deck suggests.
Princess Alexandra Hospital’s RTLS trial is a case in point. Their first proof of concept delivered roughly 6-meter accuracy against a 1-meter target and displayed locations as a list instead of the required map. The tracking hardware worked. The data wasn’t useful. A refined deployment with proper access-point density and configuration brought accuracy to acceptable levels, but that gap between “deployed” and “usable” cost time and credibility.
That pattern repeats everywhere. Sensor noise, duplicate reads, stale positions showing as current, and tag-asset mismatches after replacements all quietly undermine analytics quality. A systematic review of 42 RTLS studies in healthcare identified unreliable transmission, environmental interference, and excessive irrelevant data as recurring barriers. The review’s conclusion: reliably locating an object does not make inferring its operational activity straightforward.
The governance basics aren’t glamorous, but they’re non-negotiable:
- Every tag needs a verified link to a business asset identity. Replace a tag, update the record. Otherwise you create phantom assets.
- Timestamps must carry freshness indicators. A 48-hour-old position should never silently display as “current location” on a dashboard.
- Track observation coverage as a KPI: what percentage of your assets had a sufficiently recent observation? If it’s 70%, your dashboard is overstating visibility by 30%.
- Set alert-usefulness thresholds. A hundred geofence alerts per day with three actionable ones trains your team to ignore all of them.
Clean data isn’t a prerequisite for perfection. It’s a prerequisite for making any analytics output trustworthy enough to act on.
Five Decisions Analytics Should Actually Drive
If your analytics platform can’t change at least one operational decision this week, it’s a reporting tool, not a decision tool. Here are the five areas where the return shows up.
First: utilization. Not “is it powered on?” but “is it generating value right now?” Most operations discover that a significant share of their tracked assets sit idle at any given time. That’s capital earning nothing. Analytics surfaces the pattern so you can reallocate, retire, or resize the pool before the CFO does it for you.
Second: dwell time diagnostics. At GE Aviation’s MRO facility, the daily bottleneck was locating 2,000+ work orders. Roughly 12 people spent three hours each on the task every day. After deploying an RTLS, that collapsed to 15-20 minutes per person. More importantly, the system revealed which work orders were stuck, for how long, and where queues were forming. The facility reported 15% more capacity from the same footprint. Same building. Same staff. Better decisions.
Third: exception response. When average theft values approach $274,000 per incident, detecting an anomaly in minutes instead of hours can be the difference between recovery and a write-off. Geofence analytics tied to an accountable response procedure (not just a push notification) is what closes that gap. One generator rental business reported $300,000 in additional annual revenue after deploying geofence-based rental compliance and remote diagnostics on over $500,000 in tracked assets.
Fourth: maintenance timing. Calendar-based maintenance ignores actual usage patterns. Condition-based and predictive approaches, driven by engine hours, cycle counts, and operating conditions, shift maintenance from a fixed schedule to a signal. IBM Maximo connects asset health monitoring with predictive and reliability-centered strategies to make this practical. But it requires usage data, not just location data.
Fifth: pool sizing for reusable assets. If you operate a container pool, ULD fleet, or ground support equipment set, analytics should tell you the minimum stock needed to meet your target service level. Dwell time, cycle time, and return-rate data feed that calculation directly. Too many assets in the pool is wasted capital. Too few means service failures. You can’t optimize what you can’t measure across the full cycle.
The common thread: every one of these decisions requires data that extends beyond the delivery point. Shipment tracking stops at arrival. Asset tracking follows the full lifecycle, and that’s where the analytics layer delivers measurable returns.
Matching Sensor Technology to the Decision
The first question shouldn’t be “which sensor has the best accuracy spec?” It should be “what decision am I making, and what observation does it require?”
A portal-level RFID read at a warehouse door answers “did this asset leave the building?” with near-perfect reliability and zero battery maintenance. Installing UWB anchors across the same warehouse to answer the same question would cost far more without improving the decision.
For aviation and airfreight, hardware must survive DO-160 environmental testing: vibration, altitude, temperature extremes. That’s a hard filter that eliminates most consumer-grade trackers before you even evaluate their analytics capabilities.
| Technology | Best-fit decision | Key tradeoff |
|---|---|---|
| Passive RAIN RFID | High-volume identity capture at portals, inventory reconciliation | No batteries, but coverage depends on reader placement |
| BLE (signal strength) | Room or zone-level proximity, basic finding | Body blocking and reflections limit accuracy |
| UWB RTLS | Precise indoor positioning, work-in-process flow analysis | Requires synchronized anchor infrastructure |
| GNSS + cellular | Outdoor fleet, containers, distributed assets across regions | Limited indoors; power and reporting interval tradeoffs |
| Battery-free ambient BLE | Pallet or item-level observations at massive scale | Infrastructure still required; separate deployed from planned |
Bluetooth Channel Sounding, announced by Bluetooth SIG in late 2024, introduces secure fine ranging with centimeter-level distance capabilities using phase-based ranging and round-trip time. It’s a meaningful step beyond signal-strength guessing. But distance measured between two devices is not a fully resolved building-wide coordinate. Evaluate the complete positioning architecture, not a component-level spec sheet.
For operations spanning outdoor transit and airfreight, devices like the Thingfox T2 (DO-160 approved for airfreight) or the Oyster3 for general asset tracking deliver the durability, battery life, and connectivity that analytics across the full asset cycle demands.
Building an ROI Case That Survives Scrutiny
The strongest deployments I’ve seen start with a measurable baseline, not a technology selection. They quantify the bottleneck first, then pick the simplest architecture that removes it.
Three published cases illustrate three different ROI mechanisms:
| Case | Mechanism | Reported outcome |
|---|---|---|
| USPTO (RAIN RFID) | Automated inventory reconciliation across 115,000+ IT assets | $1.1M saved, 80% less custodian labor, 99.9% loss reduction |
| GE Aviation MRO (UWB RTLS) | Production-control visibility for 2,000+ daily work orders | 3-month ROI, 15% capacity gain, 12x productivity increase |
| Generator rental business (GPS/cellular) | Geofence-based rental compliance and remote diagnostics | $300K additional revenue, 250+ technician hours saved annually |
Each case solves a different bottleneck. USPTO needed identity reconciliation, not centimeter-level positioning. GE needed to stop burning 36 person-hours daily on a manual search. The rental business needed billing accuracy and recovery speed. Borrow the mechanism from a case that matches your constraint, not the headline number.
A practical ROI framework:
- Annual net benefit = labor savings + avoided losses + incremental margin + avoided downtime, minus recurring costs (subscriptions, connectivity, battery replacement, maintenance)
- Simple payback = total initial investment (hardware, installation, integration, configuration, training) divided by annual net benefit
- Keep capacity improvements and revenue gains as separate benefit categories. Double-counting is how ROI cases collapse under finance review.
Start with the constraint that hurts most. Quantify it in operational dollars. Then select the architecture.
Three Risks Lurking in Your Analytics Stack
A well-designed deployment still carries dependencies that can silently become liabilities.
Service-layer retirement is the first. AWS shut down IoT Analytics in December 2025 and scheduled IoT Events for removal in May 2026. Core services like IoT Core and Amazon Location remain active, but any architecture built on retired components needs migration. This isn’t unique to AWS. Cloud services have lifecycles, and your event history needs to be portable. Standardized formats like EPCIS and exportable data stores are insurance, not overhead.
Integration cadence mismatch is the second. Some fleet telematics platforms synchronize equipment readings (odometer, engine hours) with maintenance systems like IBM Maximo on a daily batch cadence. That’s fine for preventive-maintenance scheduling. It’s not real-time exception response. When a vendor says “integrated,” ask: how often does the data flow, in which direction, and which business action depends on that timing?
Surveillance creep is the third. Asset tracking hardware can also track people, and the legal and ethical boundaries are not interchangeable. The FTC’s 2024 settlement with InMarket prohibited the sale of precise location data over unlawful consumer data collection practices. That case concerned advertising, not enterprise operations. But the principle applies: asset-linked employee location data needs purpose limitation, role-based access, bounded retention, and audit logs. Mid Cheshire Hospitals deliberately deferred people tracking during their equipment-tracking trial because the governance complexity was a separate problem entirely. Smart move.
What’s Shifting in 2026
Two converging trends are reshaping the economics of asset tracking analytics.
Cheaper, denser observation is the first. Battery-free ambient IoT removes the tag-maintenance constraint that limits large-scale deployments. Walmart’s ambient-IoT rollout reached 500 deployed locations by late 2025, with expansion planned to 4,600+ stores and a goal of tracking 90 million pallets by the end of this year. Those larger numbers are targets, not confirmed outcomes. But the direction is clear: when battery replacement drops out of the equation, observation density can scale dramatically.
Smarter contextualization is the second. AI and machine learning are moving from marketing copy into functional platform layers: predictive maintenance in IBM Maximo, production-flow analysis in Siemens Location Intelligence, streaming geospatial analytics in Esri ArcGIS Velocity. The common mechanism is connecting movement or condition data with the process state that makes it actionable.
But more signals also increase analytical difficulty. A million pings per hour from battery-free tags don’t help if asset identities are unreliable, activity inference is ambiguous, or nobody owns the response. The healthcare review’s finding still holds: heterogeneous evidence and environmental interference prevented meaningful meta-analysis across decades of RTLS research. Scale without governance is noise, not intelligence.
The practical opportunity right now: better sensing plus better integration. The hype to resist: autonomous action, universal precision, and guaranteed returns that lack workflow-specific evidence.

Frequently Asked Questions
What is asset tracking data analytics?
It’s the layer that transforms raw location, identity, and condition observations from tracked assets into operational decisions. Tracking tells you where something is. Analytics reveals patterns like utilization, dwell, and exceptions, then tells you what to do about them. A dot on a map is tracking. Identifying that the asset is idle and costing you $400 per day is analytics.
How is asset tracking different from shipment tracking?
Shipment tracking ends at delivery. Asset tracking follows the asset through its full lifecycle: use, return, dwell, maintenance, redeployment. Analytics applied to that full cycle reveals pool imbalances, idle capital, and maintenance windows that shipment-level visibility never captures.
Which tracking technology is best for analytics?
No universal answer exists. Passive RFID handles high-volume identity capture without batteries. UWB provides precise indoor positioning. GNSS plus cellular covers distributed outdoor assets. Match the technology to the decision you need to make. Higher precision does not automatically produce higher value.
How should I calculate ROI for asset tracking analytics?
Annual net benefit equals labor savings, avoided losses, incremental revenue, and avoided downtime, minus recurring costs. Divide initial investment by annual net benefit for simple payback. Keep capacity and revenue improvements as separate categories to avoid double-counting. Benchmark against your own bottleneck, not a vendor’s headline case study.
Can existing Wi-Fi support asset tracking?
Sometimes. Mid Cheshire Hospitals tracked 400 infusion pumps on their existing Wi-Fi 6 network. Princess Alexandra Hospital needed additional access-point density and specific configuration to meet accuracy targets. Test with your actual asset population, building layout, and required update rate before scaling.
How do I prevent vendor lock-in with tracking analytics?
Maintain exportable event histories in standardized formats like GS1 EPCIS. Contract for data migration support. AWS retired IoT Analytics in late 2025, demonstrating that even major cloud services have lifecycles. Portable data and interoperable event structures protect against platform dependency.
If your tracking data stops at delivery, or your dashboard shows locations without driving a single operational change, that’s the gap where value leaks out. We design and deploy asset tracking systems for aviation, MRO, logistics, and industrial operations where the analytics layer has to earn its place. Talk to our team or reach us at info@datanetiot.com.






 +1 508 292 2210

One Response