

Most asset tracking implementations don’t fail because someone picked the wrong RFID tag. They fail because nobody defined what “tracking” was supposed to accomplish before purchasing hardware.
I’ve spent 15+ years deploying IoT tracking systems across aviation, maritime, and industrial supply chains. The pattern is consistent: 50 to 70% of RFID and RTLS rollouts underperform expectations. The root cause is almost never technical. It’s operational. Somebody treated a business transformation like an IT project, skipped the scoping work, and ended up with a warehouse full of tags nobody uses.
This asset tracking implementation guide walks through the 7-phase framework I use with every client, breaks down real costs (including the ones that never appear in vendor proposals), and explains where the gap between “we tagged everything” and “we actually have visibility” tends to open up.
Before We Start: Asset Tracking vs. Shipment Tracking
One distinction shapes everything that follows. Shipment tracking ends when the package reaches its destination. Asset tracking follows the asset through its entire lifecycle: deployment, use, maintenance, return, reuse, retirement.
If you’re tracking a container from port A to port B, that’s shipment tracking. If you’re tracking that same container through 12 cycles a year across three continents, monitoring dwell time at each node, flagging when it sits idle for 30+ days, and calculating cycle efficiency, that’s asset tracking. The implementation requirements are fundamentally different.
Most of the generic guides you’ll find online conflate the two. That matters because the technology stack, the data model, the integration points, and the ROI calculation all change depending on which problem you’re solving. Everything below assumes you need lifecycle visibility, not just delivery confirmation.
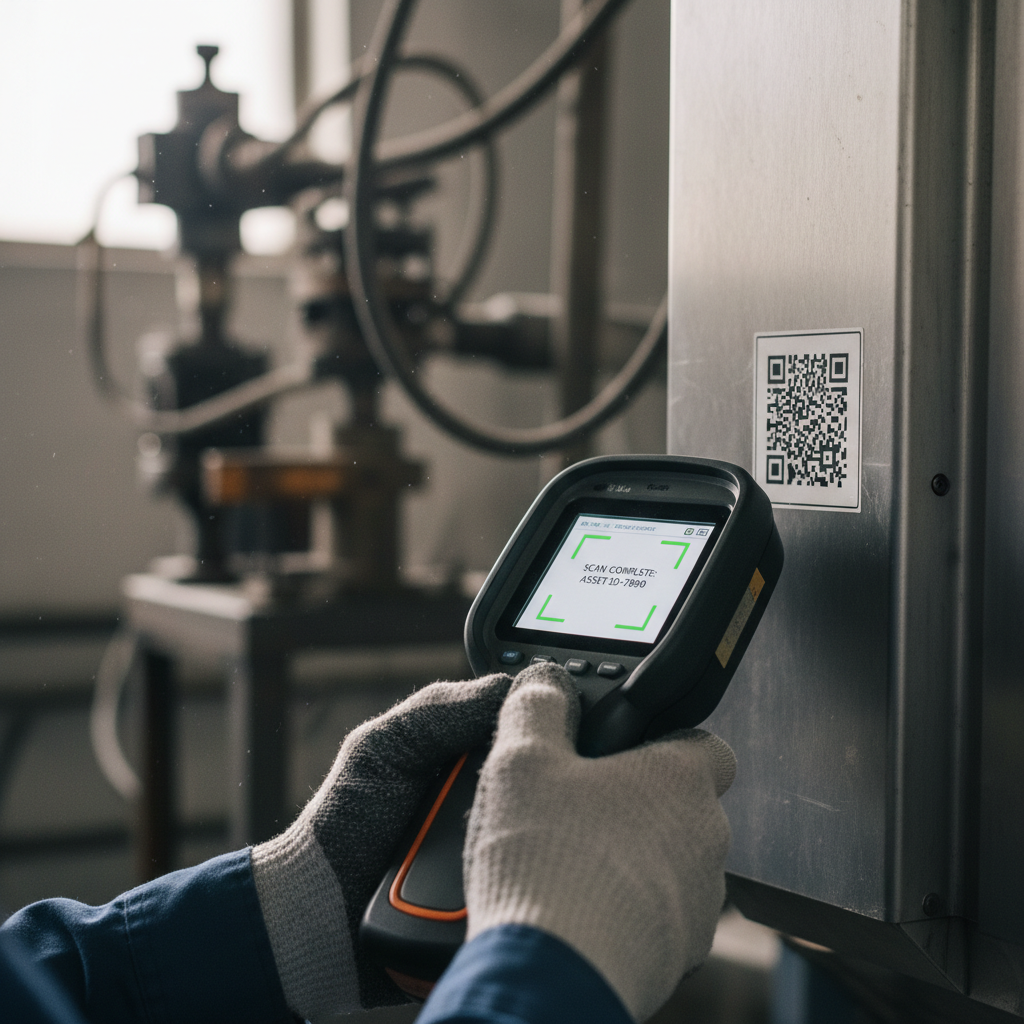
Phase 1: Define the Problem Before You Shop for Hardware
The single most expensive mistake in asset tracking? Buying technology first. I’ve walked into organizations that purchased 5,000 BLE beacons before defining which assets they were tracking, why, or what system would ingest the data.
Phase 1 is scoping. Specifically:
- Which asset classes? Ground support equipment at an airport is different from ULD containers, which is different from MRO tooling. Each class has different movement patterns, environmental exposure, and regulatory requirements.
- What decision does the data need to support? “Where is it?” is not enough. Do you need to reduce cycle time? Prove compliance for an audit? Lower rental spend by proving you already own enough units? The KPI shapes the architecture.
- What geography and environment? Indoor facility, outdoor yard, global transit, subzero cargo hold, saltwater exposure. This determines which signal technology is even viable.
- What systems need to receive the data? Your ERP, CMMS, EAM, WMS, or airline operations platform. Identifying these integrations now prevents a six-figure surprise at Phase 5.
Typical success targets I see work well as starting KPIs: reduce equipment loss by 50%, cut audit preparation from weeks to days, improve asset utilization by 15 to 25%. If your targets aren’t at least that specific, you’re not done scoping.
Phase 2: Select the Technology Stack (Signal + Platform + Integration)
With the problem defined, now you can match technology to requirements. Not the other way around.
A modern asset tracking system has four layers: identification hardware (tags, sensors), connectivity (how the signal moves), software (location engine, dashboards, workflows), and integration (APIs into your existing systems). Each signal technology occupies a different accuracy, range, and cost envelope:
| Technology | Accuracy | Range | Tag Battery Life | Tag Cost (Approx.) | Best Fit |
|---|---|---|---|---|---|
| Passive RFID (RAIN) | Portal/zone | 1 to 10 m | No battery | $0.10 to $1 | Bulk inventory counts, supply chain portals |
| Active RFID | Zone-level | 30 to 100 m | 3 to 5 years | $20 to $60 | Yard management, container pools |
| BLE (Bluetooth Low Energy) | 3 to 5 m | Facility-wide | 1 to 3 years | $5 to $20 | Healthcare, indoor RTLS, retail |
| UWB (Ultra-Wideband) | 10 to 30 cm | Facility-wide | 3 to 5 years | $15 to $50 | High-value tooling, precision indoor |
| GPS/GNSS + Cellular IoT | 3 to 10 m (outdoor) | Global | 1 to 10 years | $25 to $100 | Trailers, containers, equipment in transit |
| LoRaWAN | Zone-level | Kilometers | 5 to 10 years | $15 to $40 | Large industrial sites, agricultural assets |
| Computer Vision | Centimeter (controlled) | Line of sight | Powered | Camera cost | Warehouses, yard gate automation |
The reality in the field is almost always hybrid. A client tracking ULD containers across an airline network might use GPS/cellular for in-transit visibility, RFID portals at cargo hubs for automated check-in/check-out, and BLE for within-facility location. One technology rarely covers the full lifecycle.
For aviation and airfreight, hardware certification is a non-negotiable filter. Your tracker needs to meet DO-160 environmental testing standards to operate in cargo holds. That immediately narrows the field. The Thingfox T2, for instance, is one of the few purpose-built airfreight-approved devices on the market.
Phase 3: Configure the Platform and Location Hierarchy
Before a single tag gets attached, the software platform needs to reflect your operational reality. This means building a location hierarchy: region, site, zone, sub-zone (or gate, bay, rack, depending on context). It also means defining asset categories, ownership rules, role-based access, and alerting thresholds.
Two practical items that get skipped here and cause problems later:
Geofences with operational meaning. A geofence that says “asset entered Building 7” is data. A geofence that says “this container has been dwelling at the interline transfer zone for more than 48 hours, which exceeds the SLA by 24 hours” is intelligence. Build the rules that trigger action, not just the boundaries.
Naming conventions and unique identifiers. This sounds trivial until you’re reconciling three legacy databases where the same forklift has three different IDs. Establish one canonical ID schema before data migration. It will save you weeks of cleanup.
Phase 4: Tag Your Assets (This is Where Plans Meet Reality)
Physical tagging is the most labor-intensive phase, and consistently the one with the most surprises.
Tag selection involves more than matching technology to asset class. You need to consider surface material (metal kills passive RFID range unless you use metal-mount tags), environmental exposure (UV, moisture, temperature swings, chemical contact), and physical durability (will this tag survive being tossed into a truck bed 500 times?).
For outdoor and mobile assets in logistics, aviation ground support, or port operations, rugged GPS/cellular trackers like the Oyster3 or Oyster Edge offer battery lives measured in years with very low maintenance overhead. The point is to match the device to the operational environment, not the spec sheet.
The labor component of tagging is the hidden cost. Tagging 10,000 assets across five facilities requires planning crews, scheduling access to equipment during maintenance windows, photographing installations for verification, and quality-checking every attachment. Budget 5 to 15 minutes per asset for clean-and-tag operations, longer if the asset requires surface preparation or bracket fabrication. For a 10,000-asset deployment, that’s 800+ labor hours before you account for travel and coordination.
Phase 5: Data Migration and Governance
Every organization I’ve worked with has asset data scattered across spreadsheets, legacy CMMS entries, ERP records, and someone’s personal notebook. Phase 5 is about consolidating that data into a single source of truth.
Steps that matter:
- Export all existing asset registers. Deduplicate. Standardize fields (serial number formats, location codes, category taxonomies).
- Reconcile physical reality with digital records. You will find assets in the database that no longer exist and existing assets with no database entry. This is normal. Plan for it.
- Define a data governance playbook: who enters new assets, who retires them, what triggers an update, what fields are mandatory. Without this, your clean dataset degrades within six months.
The integration layer is where the platform earns its keep. Your tracking data needs to flow into whatever systems drive decisions: ERP for financial depreciation, CMMS for maintenance scheduling, WMS for warehouse operations, or custom dashboards for operations teams. API-first platforms make this manageable. Closed ecosystems make it expensive.
Phase 6: Training (The Phase Everyone Underfunds)
A tracking system only works if people use it. And people only use it if they understand why it matters to their specific role and how to interact with it without adding friction to their day.
What I’ve seen work:
- Role-based training, not one-size-fits-all. A warehouse operator needs a 15-minute walkthrough on scanning procedures. A maintenance planner needs an hour on work order integration. A finance manager needs a session on depreciation reporting. Different audiences, different content.
- One-page quick-reference cards at every workstation where scanning or check-in/check-out happens.
- Power-user champions in each facility. These are the people who answer questions on the floor when the training team has left. Identify and invest in them.
Here’s the uncomfortable truth most vendors avoid: if your frontline workers feel like the tracking system exists to surveil them rather than to help them find equipment faster and eliminate paperwork, adoption will crater. Frame the system around what it does for the person using it, not what it reports about them.
Phase 7: Go-Live, Audit, and Continuous Improvement
Go-live is not the finish line. It’s the starting line.
Within the first 2 to 4 weeks, run a physical audit against the digital record. This baseline audit reveals tagging gaps (assets missed during Phase 4), data errors (wrong locations, wrong categories), and process failures (people bypassing the system). Fix them now, while institutional memory of the rollout is fresh.
Then establish the cadence: quarterly cycle counts for high-value or high-movement assets, annual full inventory for everything else. Integrate these counts with your ERP reconciliation cycle. The goal is that the digital record never drifts more than 2 to 3% from physical reality.
Practical implementation data from UNIO24 shows organizations that follow a structured audit cadence reduce asset discrepancies from roughly 15% to under 2%. That’s the difference between a tracking system that people trust and one that becomes another abandoned tool.
The Costs Nobody Puts in the Brochure
Vendor proposals typically cover hardware, software licenses, and maybe a day of onsite setup. Here’s what they leave out:
Tagging labor. As mentioned above, at scale this is a significant line item. For a 10,000-asset deployment, expect $30,000 to $80,000 in labor costs depending on geographic spread and access complexity.
Tag replacement and maintenance. Tags get damaged, lost, or degrade. In harsh environments (maritime, outdoor construction, airside operations), expect a 5 to 15% annual replacement rate. Budget for it from day one.
Integration development. Connecting the tracking platform to your ERP/CMMS/WMS is rarely plug-and-play. Even with API-first platforms, mapping data fields, configuring sync frequency, handling exceptions, and testing requires development effort. For enterprise environments, this often runs $20,000 to $100,000+.
Cellular data plans. GPS/cellular trackers report over LTE-M or NB-IoT. Each device carries a monthly data cost, typically $1 to $5 per device. At 5,000 devices, that’s $60,000 to $300,000 per year in connectivity alone. Ask about this before you sign.
Change management. Training materials, champion programs, workflow redesign, executive sponsorship time. It’s real work, and it has real cost. It’s also the single biggest determinant of whether your system gets used or ignored.
Small-business barcode-only implementations might run $10 to $50 per asset per month, while enterprise RTLS deployments can reach $25 to $75 per square foot for infrastructure plus ongoing SaaS fees of $50,000 to $500,000+ annually. The variance is enormous, which is exactly why scoping (Phase 1) matters so much.
Why Implementations Fail: The Three Patterns I See Repeat
1. Technology before use case. “We want RFID” is not a requirements document. I’ve watched organizations invest six figures in passive RFID infrastructure only to realize their actual problem was tracking assets in transit between facilities, where RFID readers don’t exist. Start from the decision the data needs to support. Work backward to the technology.
2. No integration, no adoption. If the tracking data lives in its own silo, disconnected from the ERP where purchasing decisions happen or the CMMS where maintenance gets scheduled, operators will default to whatever system they already trust. The tracking platform becomes a ghost town within 90 days.
3. Ignoring the human layer. The best technology in the world doesn’t help if the person on the ground doesn’t scan the asset at check-out. Change management isn’t a soft skill exercise. It’s the difference between 95% compliance and 40% compliance, which is the difference between reliable data and noise.
A note on scope: I strongly recommend starting with a single site and a single asset class for the pilot. Prove value, document ROI, then expand. Multi-site, multi-asset-class rollouts attempted in a single phase have the highest failure rate in my experience, and the industry data supports this.
Mobile Assets Need a Different Playbook
Most implementation guides focus on fixed assets inside a building: servers, medical equipment, office furniture. The reality for logistics, aviation, and maritime operations is that the highest-value tracking problems involve assets that move.
Containers cycling through a global pool. Ground support equipment moving between airport zones. Returnable transport items (pallets, crates, ULDs) that need to come back but often don’t. MRO tooling that follows the aircraft, not the facility.
For mobile assets, the requirements shift:
- Global connectivity. The tracker needs to report from anywhere, which typically means GPS/GNSS plus multi-network cellular (LTE-M, NB-IoT, or satellite fallback). Wi-Fi and BLE infrastructure won’t help at a port in Rotterdam if your system was designed around your warehouse in Dallas.
- Battery autonomy measured in years. You can’t pull a container off rotation to change a tracker battery every three months. Devices like the battery-optimized GPS trackers in our asset tracking range are designed to report on motion-triggered schedules, conserving power during idle periods and reporting frequently during transit.
- Cycle analytics, not just position. Knowing a container is in Singapore is shipment tracking. Knowing that container has averaged 18-day cycles this quarter (down from 26 days last year) and is currently on day 22 with no movement, that’s asset tracking. The platform needs to calculate dwell time, cycle counts, utilization rates, and exception flags automatically.
This is the domain where I spend most of my time. If your container pool, GSE fleet, or returnable asset base feels invisible after delivery, that’s the gap asset tracking closes.
Three Outcomes to Measure Within 90 Days
The ROI conversation can get abstract fast. I prefer to anchor it in three metrics you can pull 90 days after go-live:
- Ghost asset rate. What percentage of assets in your database couldn’t be physically located during the baseline audit (Phase 7)? If you started at 10 to 15% and you’re now under 3%, the system is paying for itself in avoided re-purchases alone.
- Search time reduction. How long does it take an operator to find a specific piece of equipment? Houston Methodist Hospital documented a 20-minute-per-shift reduction in nurse search time after deploying RTLS, with a 15% reduction in capital spend on redundant equipment within six months. Your numbers will vary, but the measurement methodology is the same.
- Cycle time or utilization lift. For mobile assets: has the average cycle shortened? For fixed assets: has utilization (hours in productive use vs. hours idle) improved? Documented case studies across healthcare and logistics show 30 to 60% reductions in lost-asset write-offs and 15 to 25% improvements in utilization. If your 90-day delta is trending in that direction, the implementation is working.
Everything else (reduced audit labor, lower insurance costs, compliance readiness) compounds over time. But these three metrics tell you within the first quarter whether the system is delivering operational value or just generating data.
Where to Start
If you’ve read this far, you’re likely past the “should we track our assets?” question and into the “how do we do this without wasting six months and a significant budget?” question. That’s the right question.
The framework above works whether you’re tracking 500 pieces of ground support equipment at a single airport or 20,000 returnable containers across a global network. The phases don’t change. The technology mix and complexity do.
We build these systems. From hardware selection and platform configuration through integration, training, and post-launch support. If you want to talk through scoping for your specific operation, reach out to our team or email info@datanetiot.com. No pitch decks. Just a conversation about what your asset visibility problem actually looks like and what it would take to solve it.
Frequently Asked Questions
What is the difference between asset tracking and inventory management?
Inventory management counts quantities of fungible items (e.g., 500 units of Part X in Warehouse B). Asset tracking monitors individual, identifiable assets through their lifecycle: location, condition, utilization, maintenance history, and custody. Most organizations need both, connected through their ERP or CMMS.
How long does a typical asset tracking implementation take?
A single-site pilot covering one asset class can go live in 4 to 8 weeks. Multi-site enterprise rollouts typically take 6 to 18 months, phased by location or asset category. The biggest time variable is data cleanup and integration development, not hardware installation.
Which tracking technology should I choose: RFID, BLE, GPS, or UWB?
It depends on the asset and environment. Passive RFID works for high-volume portal-based counts. BLE handles low-cost indoor location at room or zone level. UWB delivers sub-meter indoor precision. GPS/cellular covers outdoor and in-transit assets globally. Most real deployments combine two or more technologies across different stages of the asset lifecycle.
What ROI can I realistically expect from asset tracking?
Documented outcomes include 30 to 60% reductions in lost-asset write-offs, 15 to 25% improvements in asset utilization, and audit labor cut by 50 to 70%. Payback periods of 6 to 18 months are common in healthcare and logistics. The actual ROI depends on your current loss rates, asset values, and how effectively the data integrates into operational decisions.
What are the biggest risks of an asset tracking implementation?
Three stand out: deploying technology before defining the use case, underinvesting in ERP/CMMS integration (so data stays siloed), and neglecting change management (so frontline workers don’t adopt the system). A structured pilot with clear KPIs and executive sponsorship mitigates all three.
Do I need different approaches for fixed vs. mobile assets?
Yes. Fixed assets (servers, medical devices, factory equipment) can rely on facility-based infrastructure like BLE beacons, UWB anchors, or RFID portals. Mobile assets (containers, trailers, GSE, returnable transport items) require GPS/cellular trackers with multi-year battery life and global connectivity. The data model also differs: fixed assets emphasize utilization and maintenance; mobile assets emphasize cycle time, dwell, and return rates.








 +1 508 292 2210
