

Most operations teams I sit down with can tell me where their assets are. They’ve got GPS pings, RFID scans, maybe a spreadsheet someone updates on Fridays. They can point at a screen and say “the trailer is in Memphis.” (See also: tracking shipping containers globally.)
But is that trailer loaded or empty? Has it been idle for nine days? Is it one of thirty trailers you leased because you thought you needed more capacity, when the real problem was existing trailers spending 40% of their cycle time parked in a yard, invisible to the people making purchasing decisions?
That’s the question asset utilization tracking answers. Not “where is it?” but “is it earning its keep?”
And the gap is wider than most people assume. World-class facilities target 85%+ utilization, but the average manufacturer runs closer to 60%. Scores below 45% are more common than scores above 85%. That 25-point spread is capital already deployed, depreciating, occupying space, generating maintenance costs, producing nothing.
Tracking, Management, Utilization: Three Different Problems
These terms get swapped around in vendor pitches and procurement docs. They shouldn’t be. Each one answers a fundamentally different operational question.
Asset tracking asks “where is it right now?” GPS, RFID, BLE. You know the trailer is in Memphis.
Asset management asks “what condition is it in, and where is it in its lifecycle?” Maintenance history, depreciation schedules, warranty status, compliance records. You know the trailer needs brake service at 3,000 miles and its lease expires in October.
Asset utilization tracking asks “how much productive value are we extracting from it?” Hours in use vs. hours idle. Loaded miles vs. empty miles. Cycles per month vs. theoretical capacity. You know the trailer ran loaded 58% of the time last quarter, sat at a customer yard for 22 days, and could have handled two additional round trips if turnaround was faster.
Sonitor illustrates this neatly in a healthcare context: tracking is zonal (which room is the infusion pump in?), management is room-level (is it calibrated and ready?), utilization is sub-room (is a patient actually connected to it, or is it parked in a corner?). The accuracy requirement increases at each level. So does the value of the answer.
Here’s the trap: most organizations buy asset tracking and assume utilization data will follow. It doesn’t. Location pings tell you where the asset sleeps. Utilization data tells you whether it should be sleeping at all.

How to Calculate Asset Utilization
Three formulas dominate. They serve different decisions, and picking the wrong one is the most common reporting mistake I see in the field.
Time-based: Asset Utilization = (Total Hours – Downtime) / Total Hours × 100. A machine available 8,760 hours per year with 2,000 hours of downtime runs at roughly 77%. This is the default for fleet managers, MRO shops, and anyone tracking equipment where “running vs. idle” is the core question.
Output-based: Asset Utilization = (Actual Output / Potential Output) × 100. A production line putting out 650 units against a theoretical capacity of 1,000 sits at 65%. Best for manufacturing floors where throughput matters more than clock time. Two machines can both run eight hours. If one produces half the output, time-based utilization hides the problem.
Financial: Total Revenue / Total Assets. The CFO’s version. It measures capital efficiency at the balance-sheet level and is nearly useless on the shop floor. If your operations team is reporting utilization with this formula, they’re measuring the wrong thing.
Match the formula to the decision it supports. Time-based for scheduling and fleet dispatch. Output-based for production planning. Financial for capex justification to the board. Mixing them in the same dashboard is how people argue past each other in quarterly reviews.
The Technology Stack That Makes Utilization Visible
Knowing where an asset sits won’t tell you how productively it’s being used. For that, you need its operational state: running, idle, loaded, empty, in-service, awaiting maintenance. The right technology stack depends on environment, accuracy requirements, and budget.
| Technology | Best For | Range | Battery Life | Utilization Signal |
|---|---|---|---|---|
| GPS / Cellular | Outdoor mobile assets (vehicles, trailers, GSE) | Global | 2-5+ years | Motion state, dwell time, trip counts |
| BLE RTLS | Indoor precision (warehouses, hangars, hospitals) | 30-70m | ~1 year | Zone occupancy, in-use vs. idle |
| Passive RFID | Bulk inventory checkpoints | 1-12m | No battery | Checkpoint-based counts |
| LPWAN (LoRa / NB-IoT) | Remote sites, containers, maritime | 10+ km | 3-10 years | Position intervals, movement events |
| Computer Vision | Tag-free environments, hazardous zones | Camera FOV | N/A (wired) | Occupancy, count, operational state |
| UWB RTLS | High-precision indoor manufacturing | 50-200m | ~1 year | Centimeter-level position, tool proximity |
For outdoor fleets and logistics, GPS over cellular is the workhorse. Battery-powered trackers like the Oyster3 or Oyster Edge report position and motion state for years without external power. That gives you both location and a base utilization signal: is this asset moving or stationary, and for how long? For indoor precision tracking, Bluetooth asset tracking provides the zone-level accuracy needed to distinguish between in-use and idle states within warehouses and hangars.
In aviation, the bar goes higher. ULD containers and airfreight equipment require DO-160 certified hardware. The Thingfox T2 is one of the few trackers approved for airfreight containers, providing utilization data across a container’s full cycle rather than just during a single flight segment. That distinction matters more than people realize: a container tracked only in transit disappears the moment it’s offloaded. It sits at a station for days. Nobody knows if it’s empty, awaiting inspection, or buried behind six other units. Multiply that blindness across a pool of thousands of ULDs and you get capital waste disguised as a container shortage. For a deeper look at how airlines tackle this specific problem, see our guide on aviation asset utilization.
On the cost side, passive RFID tags dropped from 50-75 cents in the early 2000s to roughly 3-8 cents by the late 2010s, removing the per-unit price objection. But RFID only records events at scan points. Between those points, you’re blind. For continuous utilization measurement, you need a sensor that communicates on its own.
Computer vision reached 99% accuracy in 2025, using overhead cameras and edge ML inference to identify assets without attached tags. It’s gaining ground in environments where tag maintenance is impractical: construction sites, hazardous zones, high-turnover rental fleets.
Most real deployments combine at least two technologies. GPS for outdoor transit, BLE for indoor dwell. RFID for bulk scans at gates, cellular for in-transit visibility. The mistake is picking one technology and forcing every use case into it.
Where the ROI Shows Up First
Utilization tracking pays for itself differently depending on the vertical. These are the use cases where the numbers are hardest to argue with.
Fleet and Transportation
An IDC study of commercial fleet telematics deployments found an average 815% ROI and $2.02 million in annual benefits per organization, with 14% less idle time, 9% lower maintenance costs, and 10% longer vehicle lifespan. The mechanism: fusing utilization data (mileage, idle hours, drive time) with fuel and maintenance records exposes underused vehicles generating cost while creating no value.
Fleet is the vertical where utilization ROI is most quantifiable because fuel, insurance, and depreciation are discrete cost lines. One practical question before buying telematics: is your primary KPI per-vehicle utilization or per-driver productivity? The dashboards look different, and choosing wrong means the data gets ignored.
Manufacturing
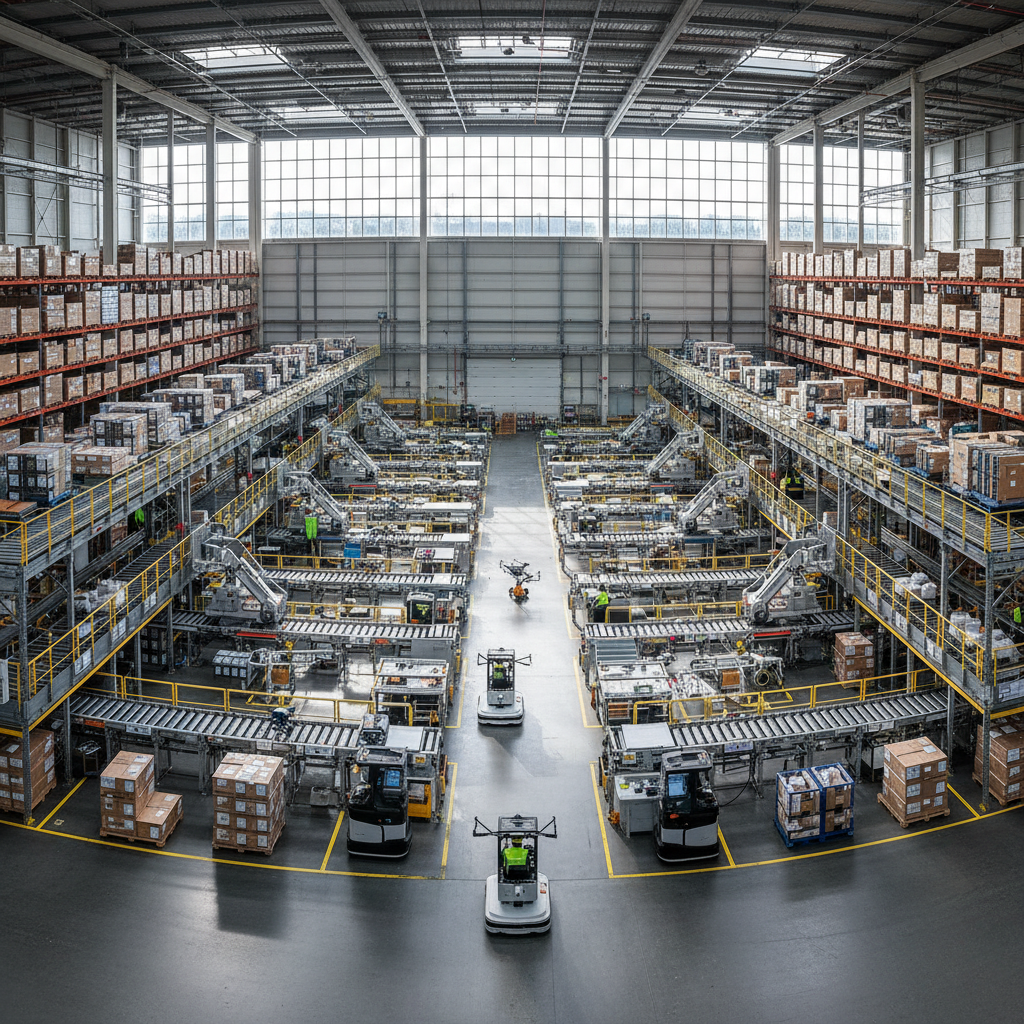
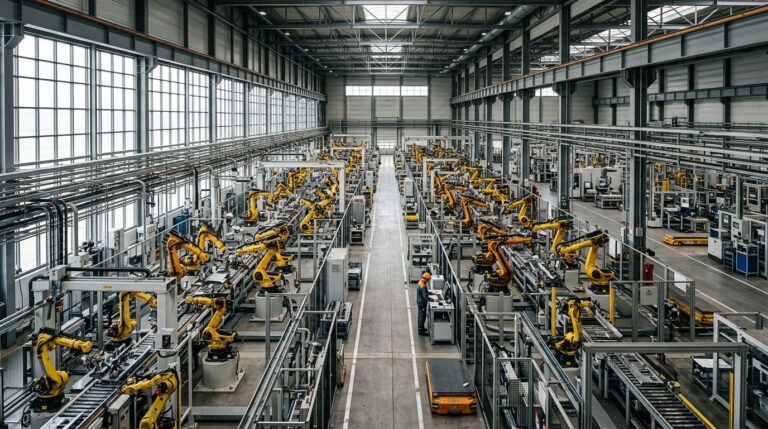
The OEE gap is the cleanest proof point. Most plants sit at 60%. World-class is 85%. That 25-point headroom shows up as excess equipment, unplanned downtime, speed losses, and quality waste.
A plastics manufacturer with roughly 300 employees deployed UWB RTLS with asset tags to track shared tools across multiple buildings. Outcome: tool search time eliminated, bottlenecks surfaced through zone analytics, accident risk from worn-out tools reduced by feeding utilization data into the production schedule. The payback came from the simplest possible source. People stopped wandering the floor looking for things.
Healthcare
Houston Methodist deployed a single RTLS platform across four sites to track patient tablets, monitor vaccine refrigerator temperatures, and manage equipment flow. One infrastructure layer, multiple utilization use cases, deployed in under two weeks. The result was consolidation of several legacy systems into one. Industry-wide, RTLS deployments report 30–50% reduction in asset loss and 15–20% lower maintenance costs across labor, loss prevention, and compliance when utilization tracking replaces manual processes.
Aviation and Ground Support
This is the space I work in most. Airlines and MRO providers track ULD containers, ground support equipment, spare parts kits, and tooling across dozens of stations worldwide. The problem specific to aviation: an asset is visible during a flight leg or maintenance event, then drops off the radar the moment it’s offloaded or returned. Dwell time at outstations goes unmeasured. Cycle count per month is a guess.
When someone at headquarters senses a shortage, the default move is to order more containers or equipment. Because the utilization data to challenge that assumption doesn’t exist. The tag is transmitting. The dot is on the map. But nobody has translated “present at Station X for 14 days” into “idle, costing us $Y per day in tied-up capital.” That’s not a tracking problem. It’s a utilization problem.
Five Failure Modes That Kill Utilization Projects
The technology is mature. The deployments are what fail. A majority of enterprise asset management software projects miss their original budget, timeline, or benefit targets. The patterns are predictable, which means they’re preventable.
1. Strategic mismatch
The platform doesn’t fit your asset types. This happens when procurement picks software based on a vendor demo with clean data instead of a site survey with real constraints. An EAM built for IT hardware won’t handle the nuances of tracking ULD containers across 40 airports, or tooling that moves between an MRO hangar, an aircraft, and three outstations.
2. Implementation drift
The system requires workflows that don’t match reality. Most common version: the software expects assets to be scanned in and out at defined points. In practice, the scan adds 30 seconds nobody has. People skip it. Utilization data develops gaps. Gaps breed mistrust. Mistrust leads to abandonment.
3. Adoption collapse
Frontline users reject the process. Not because they’re difficult. Because the system delivers value to the manager reading the dashboard, not to the technician holding the scanner. If the person doing the work gains nothing from tagging the asset, the asset doesn’t get tagged. Solve this by designing value into the frontline experience first.
4. Radio and infrastructure blind spots
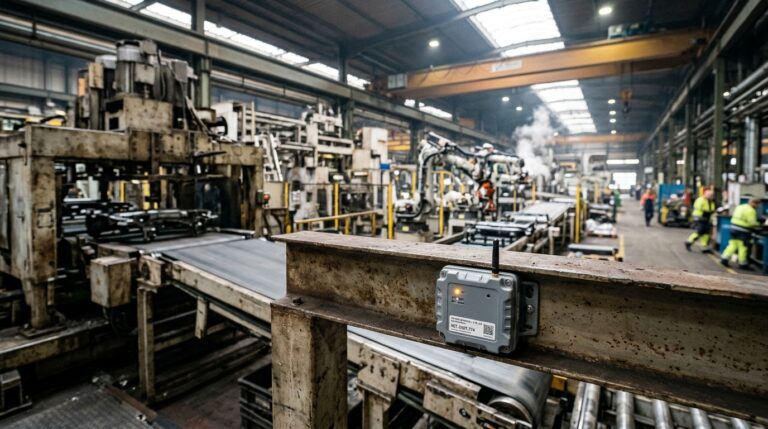
The top RTLS challenges include IT infrastructure gaps at anchor locations, radio interference from metal structures, and ERP integration friction. All solvable with proper site surveys, hybrid BLE/UWB deployment, and standards-based data interfaces (MQTT, REST API). All rarely budgeted in the first round of planning.
5. Cost structure shock for mid-size operators
Research from McGill University confirms that RTLS adoption among SMEs is limited primarily by upfront installation and software licensing, not per-tag hardware price. Tags are cheap. Infrastructure and integration are not. This is where a phased rollout, starting with the highest-value asset class, beats a big-bang deployment every time.
What’s Shifting in 2026
Three forces are reshaping asset utilization tracking right now. None are theoretical.
OEMs are buying AI rather than building it
Earlier this year, Bosch announced its planned acquisition of Uptake, an AI-driven predictive maintenance platform whose Asset Strategy Library covers roughly 800 equipment types and 58,000+ failure modes. Caterpillar had held a minority stake for years. The signal is clear: industrial OEMs cannot build AI-driven utilization analytics fast enough, so they acquire pure-play vendors.
For buyers, this means horizontal “AI for everything” platforms are the likeliest acquisition targets and the likeliest to face roadmap disruption. Favor platforms with deep vertical specialization or established OEM partnerships.
Digital twins are replacing KPI spreadsheets
The digital twin market is projected to reach $149.81 billion by 2030, growing at 47.9% annually from $21.14 billion in 2025. Early adopters report up to 50% reduction in product development time, 20% fewer unexpected stoppages, and 7% lower carbon emissions. The utilization view of 2028 won’t be a table of percentages. It’ll be a continuously updated spatial model of your operation, with idle assets glowing red.
ESG budgets are paying for utilization projects
Machinery production accounts for roughly 8% of global greenhouse gas emissions and 30% of global metal production. The carbon footprint of machinery doubled between 1995 and 2019. Every productive hour added to an existing asset defers the manufacturing of a new one, along with its embedded carbon cost. Under emerging Scope 3 reporting requirements, underutilized assets are no longer just an efficiency problem. They’re a measurable emissions liability.
I’ve seen utilization tracking proposals that would have died in a maintenance budget get approved when reframed as Scope 3 reduction initiatives. Same sensors, same data, different line item, different sponsor.
Frequently Asked Questions
What is asset utilization tracking?
It measures how productively physical assets are used, quantifying the split between active operation and idle time. Unlike asset tracking (where is it?) or asset management (what condition is it in?), utilization tracking answers a harder question: are we extracting full value from what we already own?
What’s a good asset utilization rate?
World-class facilities target 85% or higher, but most manufacturers run closer to 60%. The 85% benchmark originates from Seiichi Nakajima’s Total Productive Maintenance framework in Japanese automotive plants. The better goal is consistent, measurable improvement from whatever your current baseline is.
Which formula should I use to calculate it?
Time-based (Total Hours minus Downtime, divided by Total Hours) for individual equipment and vehicles. Output-based (Actual Output divided by Potential Output) for production lines where throughput matters more than clock hours. Financial (Revenue divided by Total Assets) only for board-level capital efficiency reporting.
What technology does asset utilization tracking require?
GPS/cellular for outdoor mobile assets. BLE or UWB RTLS for indoor precision. Passive RFID for bulk checkpoint scans. LPWAN for remote, long-range deployments like maritime asset tracking and shipping containers. Computer vision for tag-free environments. Nearly every serious deployment combines at least two of these.
What ROI can I realistically expect?
It varies by vertical. Fleet telematics shows 800%+ ROI through reduced idle time, fuel savings, and extended vehicle life. RTLS deployments report 30-50% reduction in asset loss. Broad implementations document 40-60% total savings across labor, maintenance, and compliance. The fastest payback always comes from starting with the highest-value asset category.
Why do utilization tracking projects fail?
Three patterns: the platform doesn’t match your specific asset types (strategic mismatch), the system doesn’t reflect how people actually work (implementation drift), or frontline users reject a process that adds effort without giving them anything back (adoption collapse). For mid-size operators, upfront infrastructure cost is the biggest single barrier.
If your containers, equipment, or tooling vanish from view the moment they leave your facility, that’s not a tracking gap. It’s a utilization gap. We help aviation, logistics, and industrial operations close it with the right hardware and integration for the environment. Reach out to our team or browse our tracking device catalog to see what fits.






 +1 508 292 2210

6 Responses