

Every asset tracking vendor has a calculator. You plug in your asset count, guess at a loss rate, and the screen tells you you’ll save $200,000 a year. Clean. Convincing. And almost useless when your CFO asks the follow-up: “Where, specifically, does that money come from?”
Asset tracking ROI is real. The data supports it across industries, asset types, and company sizes. But the range is enormous. Some deployments pay back in three months. Others never break even. The difference rarely comes down to the technology. It comes down to whether you’re tracking the right assets, with the right hardware, through the right portion of their lifecycle.
I’ve spent over 15 years deploying IoT tracking for airlines, freight forwarders, port operators, and industrial supply chains. Here’s what the payback numbers actually look like once you move past the marketing calculators.
The benchmark numbers worth knowing
Let’s start with documented data, not projections.
Industry fleet telematics data shows that 47% of GPS tracking users hit positive ROI within 12 months. A third got there in six months. Average fuel savings nearly doubled from 8% to 16% between 2021 and 2025 as telematics platforms improved route optimization and idle-time detection.
On the maintenance side, aggregated ROI data from MapTrack shows preventive maintenance programs enabled by asset tracking deliver 545% ROI over an asset’s lifecycle. That sounds inflated until you price out what reactive maintenance actually costs: emergency parts, overtime labor, production stoppages, and cascading schedule failures.
Construction fleet tracking typically pays back in three to six months. Hospitals using real-time location systems save an average of $4,000 per bed per year on misplaced equipment. RFID-based inventory systems cut physical audit time by 75 to 95%.
Those are real numbers. But they come with a caveat most vendor pages won’t mention: they describe successful deployments. The ones where someone picked the right technology for the right problem, budgeted for implementation properly, and stuck with it past the first quarter.
The global asset tracking market reached $26 billion in 2025 and is projected to nearly triple by 2034. That growth is driven by organizations that ran the numbers, deployed, and measured the results. Not by hype.
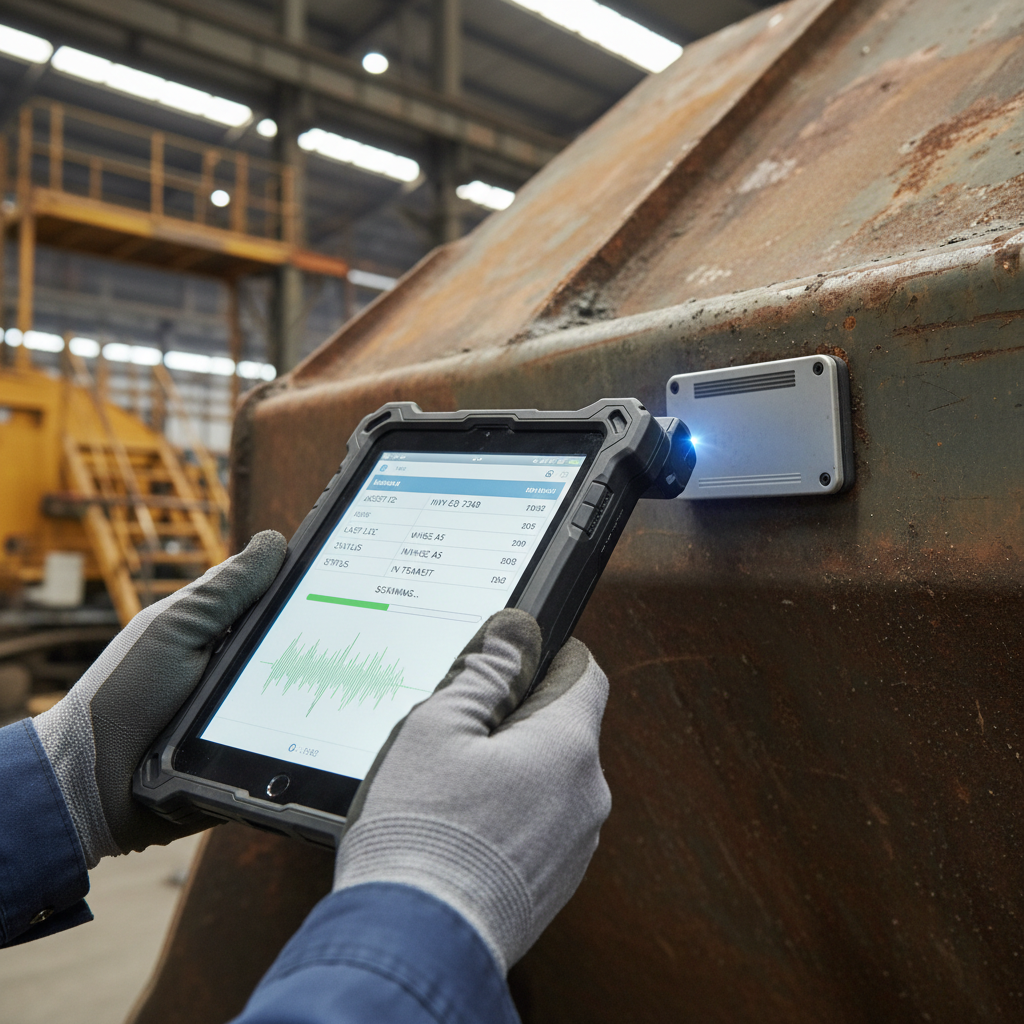
Where asset tracking ROI comes from
Strip away the vendor jargon and asset tracking ROI falls into five concrete buckets. Every successful deployment I’ve seen hits at least two. The best ones hit four or five.
1. Loss and theft prevention
The most intuitive bucket. Tracked equipment has a 69% recovery rate compared to 21% for untracked assets. In construction, mid-size contractors spend over $400,000 a year replacing lost or stolen tools. With tracking, that 5 to 10% annual shrinkage drops below 1%.
For fleet operators the numbers get dramatic. One documented case: a small transportation company recovered more than $500,000 in stolen trucks after deploying telematics. That single line item justified the entire system.
2. Ghost asset elimination
Ghost assets are items that exist in your books but not in the physical world. You’re paying property tax, insurance premiums, and maintenance contracts on equipment that was scrapped, lost, or transferred years ago.
The typical gap between books and reality runs 12 to 25%. On a $1 million asset base, that’s roughly $32,250 per year in wasted tax and insurance payments alone. Asset tracking closes the gap because every item either pings or it doesn’t. No ambiguity.
3. Labor and audit efficiency
Manual asset audits consume time at a rate that compounds fast. A warehouse with 5,000 items can take 20 working days to count by hand. RFID cuts that to hours. At roughly $300/day per worker (U.S. Bureau of Labor baseline), the savings stack up in one audit cycle.
Then there’s the daily search problem. Employees spend 6 to 8 hours per week looking for equipment, tools, or parts. That’s not a productivity leak. It’s a flood.
4. Maintenance cost shift
Reactive maintenance (wait for it to break, then scramble) costs three to ten times more than preventive approaches. Sensor-equipped assets report vibration anomalies, temperature spikes, and usage patterns that trigger work orders before failure hits. The documented outcome: 30 to 50% reduction in unplanned downtime, 35 to 80% extension of equipment life.
For context, unplanned downtime costs the world’s 500 largest industrial companies an estimated $1.4 trillion per year. Even small percentage improvements against that baseline deliver massive returns.
5. Utilization and cycle time improvement
This is the bucket most people underestimate. When you know where every asset is and how often it’s used, you stop buying duplicates. You stop leasing extra containers “just in case.” You shorten cycle times because you see dwell time, idle time, and bottlenecks in real time. Effective asset utilization tracking transforms this visibility into concrete operational improvements.
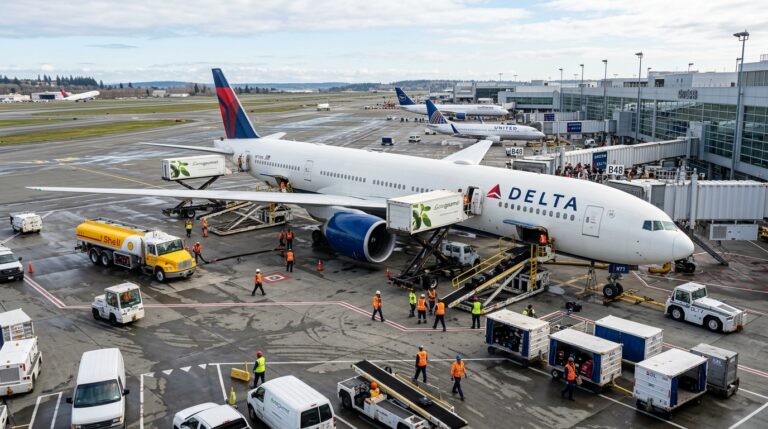
In reusable container pools, tracking typically improves turns per asset by 10 to 20% per year. That means fewer containers to move the same volume, which is exactly the payoff of tracking shipping containers globally. In aviation ground support, it means fewer idle pushback tugs and fewer emergency rental fees.
The fork most buyers miss: shipment tracking vs. asset tracking
This is where the ROI conversation goes sideways for a lot of organizations.
Shipment tracking follows a package from origin to destination. The job ends at delivery. You get a timestamp, a proof of delivery, maybe a temperature log. Useful for compliance and customer visibility. Limited for ROI.
Asset tracking follows the asset itself through its entire lifecycle. Delivery is one event among many. What happens after? Does the container come back? How long does it dwell at the destination? Is the ULD sitting idle at a station for three weeks? Did the GSE unit move to a different airport without anyone updating the system?
Most ROI calculators model shipment tracking economics. They assume value ends at delivery. For reusable assets (containers, ULDs, pallets, ground support equipment, MRO tooling, returnable transport items), the real ROI compounds in the return cycle, the dwell reduction, and the utilization data that lets you right-size your pool.
I’ve watched companies invest six figures in tracking solutions that gave them perfect origin-to-destination visibility, then go blind the moment the asset reached the other side. The container pool kept growing because nobody could prove the containers were coming back on time. They were buying new ones to cover a cycle-time problem that better data would have solved.
If your container pool feels invisible after delivery, that’s exactly the gap maritime asset tracking closes.
Technology choice determines payback
Picking the wrong tracking technology for your use case is the fastest route to negative ROI. Here’s a realistic cost and capability breakdown:
| Technology | Cost per tag/device | Battery life | Accuracy | Best for |
|---|---|---|---|---|
| Passive RFID (UHF) | $0.05 to $5 | No battery | Room/portal level | Inventory counts, warehouse portals |
| BLE (Bluetooth LE) | $5 to $30 | 1 to 5 years | 2 to 10 m | Indoor facilities, tool cribs |
| GPS + Cellular | $50 to $200 | 2 weeks (live) to 3+ years (scheduled) | 5 to 15 m outdoors | Vehicles, containers, heavy equipment |
| UWB (Ultra-Wideband) | $20 to $50 | Months to years | 10 to 30 cm | High-precision indoor (manufacturing, mining) |
| Cellular IoT (NB-IoT/LTE-M) | $15 to $40 (module) | 5 to 10 years | ~30 m | Remote assets, long-duration deployments |
Source: aggregated from AirPinpoint’s technology comparison and industry hardware benchmarks.
The pattern I see repeatedly: companies buy GPS trackers for indoor assets (GPS doesn’t work indoors), or they deploy BLE tags for cross-country container tracking (BLE needs gateways within 100 meters). The technology works fine. It just doesn’t match the operational reality.
For aviation freight, certification matters as much as capability. A tracker going into an aircraft cargo hold needs DO-160 environmental qualification. Consumer GPS units don’t qualify. That’s why purpose-built devices like the Thingfox T2 exist: DO-160 approved, designed for the temperature and pressure extremes of a cargo hold.
For ground-based assets that move between sites (trailers, generators, ground support equipment), cellular GPS trackers like the Oyster3 or Oyster Edge hit the sweet spot of cost, battery longevity, and outdoor accuracy, which is why LTE-M asset tracking now dominates the market. And for ocean containers and port equipment, dedicated maritime tracking devices handle the connectivity and durability requirements that standard hardware can’t.
The ROI formula only works when the hardware fits the job.
The costs ROI calculators leave out
Most ROI projections model the savings side well. The cost side? Rarely complete. Here’s what tends to get left out.
Tagging labor. Someone has to physically attach a tracker or tag to every asset. For a facility with 10,000 items, that’s weeks of work. Some tags need mounting brackets, adhesive testing, or wiring to the asset’s power supply. Budget for it or the project stalls at deployment.
Connectivity gaps. Cellular trackers need cell coverage. Remote yards, underground facilities, and ocean shipping routes don’t always have it. This is exactly where offshore asset tracking gets hard, and low-power options like LPWAN asset tracking or satellite IoT fill those gaps at higher per-message cost. If you don’t map connectivity before you buy hardware, you end up with dead zones that erode trust in the system.
Integration with existing systems. A tracker that can’t feed data into your ERP, CMMS, or TMS produces alerts nobody acts on. Integration is where tracking becomes operational intelligence. The cost varies from a few API calls to a six-month IT project, depending on your existing stack.
Change management. People bypass tracking systems. Drivers disable GPS units. Warehouse staff skip scan points. If the system adds friction without visible benefit to the person using it, compliance drops and your data degrades. Training, workflow redesign, and making tracking data useful to frontline workers (not just management) are all line items that belong in the budget.
None of these are deal-breakers. They’re all manageable, especially with a turn-key implementation partner. But if your ROI model ignores them, the actual payback will be longer than the spreadsheet promised.
Building the business case that finance approves
The basic formula is straightforward:
ROI = (Annual Savings from Tracking − Annual Cost of Tracking) ÷ Annual Cost of Tracking × 100
The challenge is populating those inputs honestly.
Annual savings should include: reduction in asset loss and theft (use your historical replacement spend as baseline), ghost asset tax and insurance recovery, labor hours saved on audits and searches, maintenance cost reduction from the reactive-to-preventive shift, insurance premium discounts (typically 10 to 25% for tracked fleets), and utilization gains that defer capital purchases.
Annual cost should include: hardware (amortized over expected device life), software/platform subscription, cellular or satellite data fees, tagging and installation labor (Year 1 heavy, then maintenance), system integration, and ongoing support.
Three outcomes I anchor every business case around:
- Audit time drops 75%+ in the first year, freeing headcount for higher-value work.
- Replacement and rental spend drops 30 to 50% as loss rates fall and utilization improves.
- Maintenance costs shift from emergency to scheduled, cutting total maintenance spend 20 to 40%.
If you can document your current numbers in those three areas (even rough estimates), the business case builds itself. The hardest part isn’t the math. It’s getting honest baseline data from operations.
If you’re working on that case now and want to pressure-test the numbers against what we’ve seen in aviation, logistics, and industrial asset deployments, reach out to our team. We’ll tell you where the ROI is realistic and where it isn’t: info@datanetiot.com
Frequently asked questions
What is a realistic payback period for asset tracking?
Most fleet and high-value mobile asset deployments pay back in 6 to 12 months. Facility-wide RFID rollouts typically take 12 to 24 months. Construction equipment tracking often pays back in 3 to 6 months due to high loss rates in that sector.
How much does asset tracking cost per asset?
Passive RFID tags cost pennies at scale. BLE beacons run $5 to $30. Cellular GPS trackers range from $50 to $200 for hardware, plus $5 to $50 per month for software and data. The right answer depends on asset value, location requirements, and update frequency.
Does company size affect asset tracking ROI?
Yes, but not how you’d expect. Larger companies have more assets, so absolute savings are bigger. Smaller companies often have worse baseline visibility, which means the percentage improvement is sharper. A 50-truck fleet with no tracking will see faster ROI gains than a 5,000-truck fleet with partial visibility already in place.
What is the biggest mistake in calculating asset tracking ROI?
Ignoring implementation costs. Hardware and subscriptions are easy to model. The labor to tag assets, integrate with existing systems, and train staff is harder to estimate and just as real. Underestimating these inflates the projected ROI and erodes credibility when results come in lower.
Can asset tracking reduce insurance premiums?
Yes. Insurers typically offer 10 to 25% premium discounts for GPS-equipped fleets and high-value mobile assets. The discount usually requires proof of active tracking and, in some cases, configured geofence alerts. Check with your carrier for specifics.
What is the difference between shipment tracking ROI and asset tracking ROI?
Shipment tracking measures value through delivery: on-time performance, damage reduction, compliance. Asset tracking measures value across the full lifecycle, including return trips, dwell time, utilization rates, and maintenance cycles. For reusable assets like containers and ground equipment, the post-delivery phase is where the majority of ROI lives.







 +1 508 292 2210

11 Responses