

In early 2025, FDA issued a warning letter to BioStem Life Sciences for skipping per-batch particle and surface sampling in a critical aseptic area. Same quarter, Aspen Pharmacare got flagged for an inadequate monitoring system on an aseptic filling line, compounded by weak computer controls over the very records that were supposed to prove compliance.
Two companies. Two letters. One pattern: the monitoring program existed on paper but collapsed in practice.
Environmental monitoring in the pharmaceutical industry is the systematic observation of air, surfaces, personnel, and physical conditions wherever product quality is at risk. It spans particle counts, viable organisms, temperature, humidity, differential pressure, and utilities like water and compressed gases. The point is not to collect data. It is to produce evidence that a controlled environment stayed controlled while product was exposed.
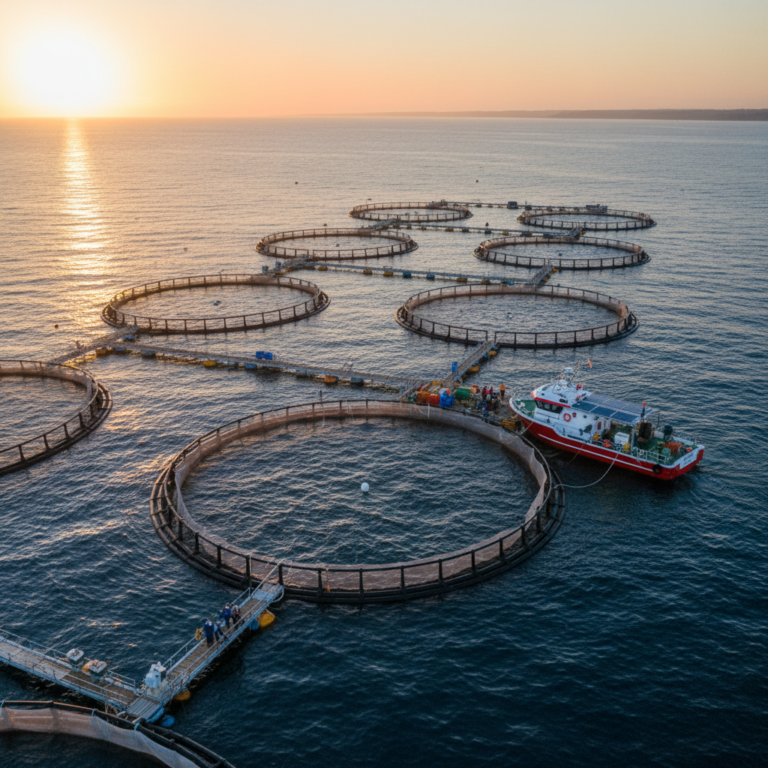
While this article focuses on pharmaceutical applications, similar monitoring principles apply across regulated industries—see our coverage of aquaculture environmental monitoring for a related sector perspective.
The pharmaceutical and biotech EM market is projected to nearly double from $1.2 billion in 2025 to over $2.3 billion by 2035, driven by tighter regulation and the shift toward continuous monitoring. If you manage a cleanroom, run QC micro, or report to quality leadership, what follows is the operational map: what the program actually measures, where it breaks, and what continuous monitoring changes.
The Six Layers of a Pharmaceutical EM Program
EM is not one test. It is six interlocking measurement layers, each with a different blind spot. Treating any single layer as “the program” is how facilities pass qualification and fail inspection.
| Layer | What it measures | Typical tools | Blind spot |
|---|---|---|---|
| Nonviable particles | Airborne particle concentration by size | Optical particle counters (remote or portable) | Cannot identify organisms or prove sterility |
| Viable air | Recoverable microorganisms in sampled air | Impaction samplers, centrifugal samplers, settle plates | Recovery depends on method, volume, medium, and incubation |
| Surfaces and equipment | Contamination on work surfaces, walls, equipment | Contact plates (RODAC), swabs | Local and time-limited: one moment, one point |
| Personnel | Gloves, gowns, arm coverings, operator behavior | Glove prints, gown contact plates | Misleading if sampled only post-sanitization |
| Physical environment | Temperature, humidity, differential pressure, airflow | Transmitters, differential-pressure sensors, HVAC controls | Stable readings do not rule out microbial contamination |
| Utilities | Water, compressed gases, vacuum, steam | Microbial, particulate, chemical, and endotoxin tests | Sampling-point design must reflect actual use points, not convenience |
Two distinctions matter operationally.
First: classification versus routine monitoring. ISO 14644-1:2015 defines air-cleanliness classes by airborne particle concentration under controlled, often at-rest conditions. That is qualification. Routine monitoring happens during production, with personnel moving, doors cycling, and interventions occurring. A room that qualifies at rest can drift the moment a line operator reaches into the critical zone.
Second: nonviable particles give speed (real-time counts), while viable sampling gives biological evidence (organisms actually recovered). You need both. A particle counter reading zero does not mean sterile air. A culture plate with no growth does not mean particles were absent. These layers cross-check each other.
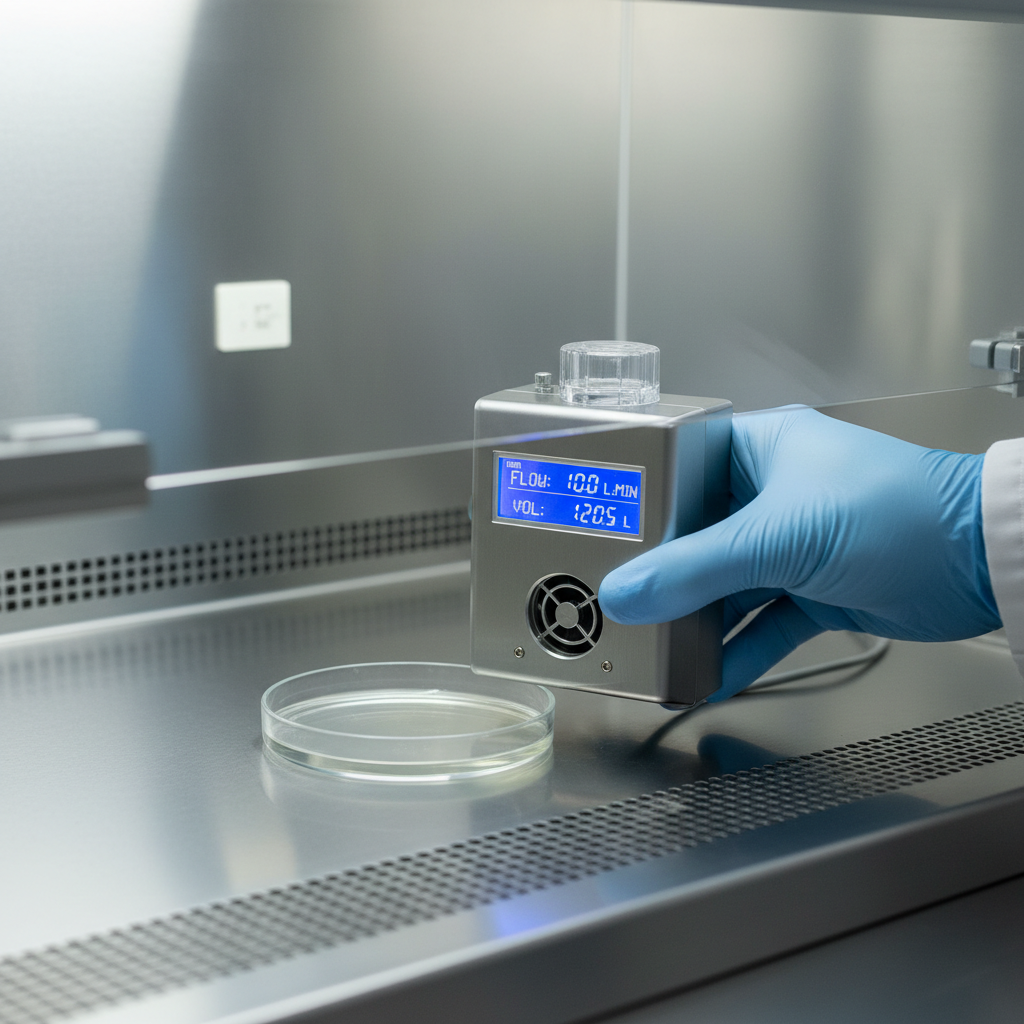
Physical-condition monitoring (temperature, humidity, pressure differentials) forms the continuous backbone. These parameters do not detect organisms directly, but they verify that HEPA filtration, airflow patterns, and room pressurization are performing as designed. Standard cleanroom conditions typically target around 22°C ±2°C and 50% ±5% relative humidity, though specific requirements vary by product and process. When a differential-pressure sensor drifts, you get warning before particle counts or culture results ever reflect it.
Utilities are the layer most programs underestimate. Water systems, compressed gases, and vacuum lines can carry contamination directly to product-contact surfaces. Compressed-gas monitoring follows ISO 8573 concepts alongside GMP expectations, and sampling points must mirror actual use points rather than just convenient taps in the pipe run.
FDA and EU Annex 1: Two Frameworks, One Facility
If your facility ships to both the US and EU, you operate under two systems that share vocabulary but diverge on philosophy, limits, and expectations.
FDA’s aseptic-processing guidance provides recommended environmental-quality action levels and expects dynamic monitoring during production shifts. It has been active since 2004 and remains the US baseline.
EU GMP Annex 1, operational since August 2023, introduced a structural shift: the Contamination Control Strategy (CCS). Instead of treating EM as a standalone quality test, Annex 1 requires manufacturers to evaluate facility design, procedures, technology, personnel, and monitoring as one connected system. The EM program becomes evidence that the CCS works, not a substitute for it.
The limits themselves also differ:
| Grade / ISO at rest | Particles ≥0.5µm/m³ (at rest / in operation) | Annex 1 viable air limit | FDA viable air action level |
|---|---|---|---|
| Grade A / ISO 5 | 3,520 / 3,520 | No growth expected | 1 CFU/m³ |
| Grade B / ISO 5 at rest | 3,520 / 352,000 | 10 CFU/m³ | 7 CFU/m³ |
| Grade C / ISO 7 at rest | 352,000 / 3,520,000 | 100 CFU/m³ | 10 CFU/m³ |
| Grade D / ISO 8 at rest | 3,520,000 / not predetermined | 200 CFU/m³ | 100 CFU/m³ |
Notice Grade A under Annex 1: “no growth expected.” That is tighter than FDA’s 1 CFU/m³. And Annex 1 specifies both at-rest and in-operation particle limits, while FDA focuses primarily on dynamic conditions during activity.
The practical consequence: copying one regulatory table into a global SOP fails. A US-only facility can follow FDA action levels. A facility supplying EU markets must meet the CCS expectations, continuous Grade A monitoring mandates, and stricter viable limits. Multinational manufacturers need a common scientific rationale with site-specific regulatory mapping.
Annex 1 also pushes further on continuous monitoring. For Grade A during critical processing, it mandates continuous particle monitoring (≥0.5µm and ≥5.0µm) with a minimum sample flow of 28 liters per minute, plus continuous viable-air monitoring. This is where IoT-based sensor infrastructure becomes operationally necessary. You cannot meet continuous, multi-parameter requirements with periodic manual rounds.
Where Programs Break: Lessons from Recent Warning Letters
The best data on EM failure modes comes not from textbooks but from FDA warning letters, where inspectors document exactly what was missing.
BioStem Life Sciences (January 2025) had four connected gaps: no routine per-batch nonviable-particle monitoring in the critical area, no surface sampling during production, insufficient overall monitoring frequency, and no microbiological sampling of operator arm coverings. Cleaning and disinfection for the ISO 5 and ISO 7 rooms had not been validated. This is not one missed sample. It is a structurally incomplete program where wrong frequency, wrong coverage, and unvalidated cleaning compound into a single systemic failure. Without validated cleaning, a surface sample is meaningless. Without arm-covering monitoring, the personnel layer has a hole. Without per-batch particle data, you cannot tie environmental conditions to a specific lot.
Aspen Pharmacare (February 2025) was cited for inadequate environmental monitoring on an aseptic filling line. The company proposed a quality risk assessment for nonviable-particle monitoring, but FDA found the response lacked sufficient follow-through. The same letter flagged inadequate controls over computerized systems governing records. This is the data-integrity dimension most EM discussions skip. Your sensors can be excellent. Your sampling plan can be textbook. But if the system that stores, timestamps, and protects the data is not controlled and auditable, an inspector who cannot trust the record cannot trust the result.
For historical context, the 2012 NECC compounding crisis documented by the CDC remains the starkest reminder of what happens when facility controls, cleaning, and oversight break down together. A multistate fungal outbreak was linked to contaminated methylprednisolone acetate. EM is not administrative overhead. It exists because contamination in pharmaceutical environments causes measurable harm to patients.
The common thread: programs that treat EM as a checklist of disconnected tests instead of an integrated control system. Particle monitoring validates air handling. Surface and personnel sampling validate contamination controls during human interaction. Physical-parameter monitoring validates facility infrastructure. Data-system controls validate the integrity of everything above. When one link is missing, the chain fails.
Designing a Program That Survives Inspection
Start with the contamination pathway, not the equipment catalog. A comprehensive environmental monitoring plan begins by mapping the facility and answering five questions for every critical location:
- What hazard could reach the product here (particles, organisms, temperature excursion, pressure loss)?
- What engineered control prevents it (HEPA filtration, isolator, pressure cascade, temperature control)?
- What monitoring method verifies the control is working?
- What frequency catches a deviation before it affects a batch?
- What is the documented response when a limit is exceeded?
This is the CCS approach that Annex 1 requires. It is also the approach that would have prevented every gap FDA found at BioStem and Aspen.
Alert and action limits deserve particular attention. An alert level signals drift and triggers review. An action limit triggers formal investigation, corrective action, and product-impact assessment. FDA is explicit: do not average results, because averaging masks localized problems. A single action-level excursion warrants evaluation even without an adverse trend.
Annex 1 adds another requirement: trend procedures must identify increasing excursions, consecutive alerts, and recurring action-limit events that may share a common cause. Your data system needs pattern recognition across time, location, operator, and shift. Not just single-point alarms.
Organism identification matters more than most programs acknowledge. Identifying recovered organisms to species level lets you correlate environmental isolates with product-sterility failures, detect migration from lower-classified areas, and distinguish resident flora from transient contamination. If your EM data lives in spreadsheets disconnected from your CAPA system, the signal is trapped. The connections between data points carry more information than individual readings.
Continuous Monitoring and the IoT Shift
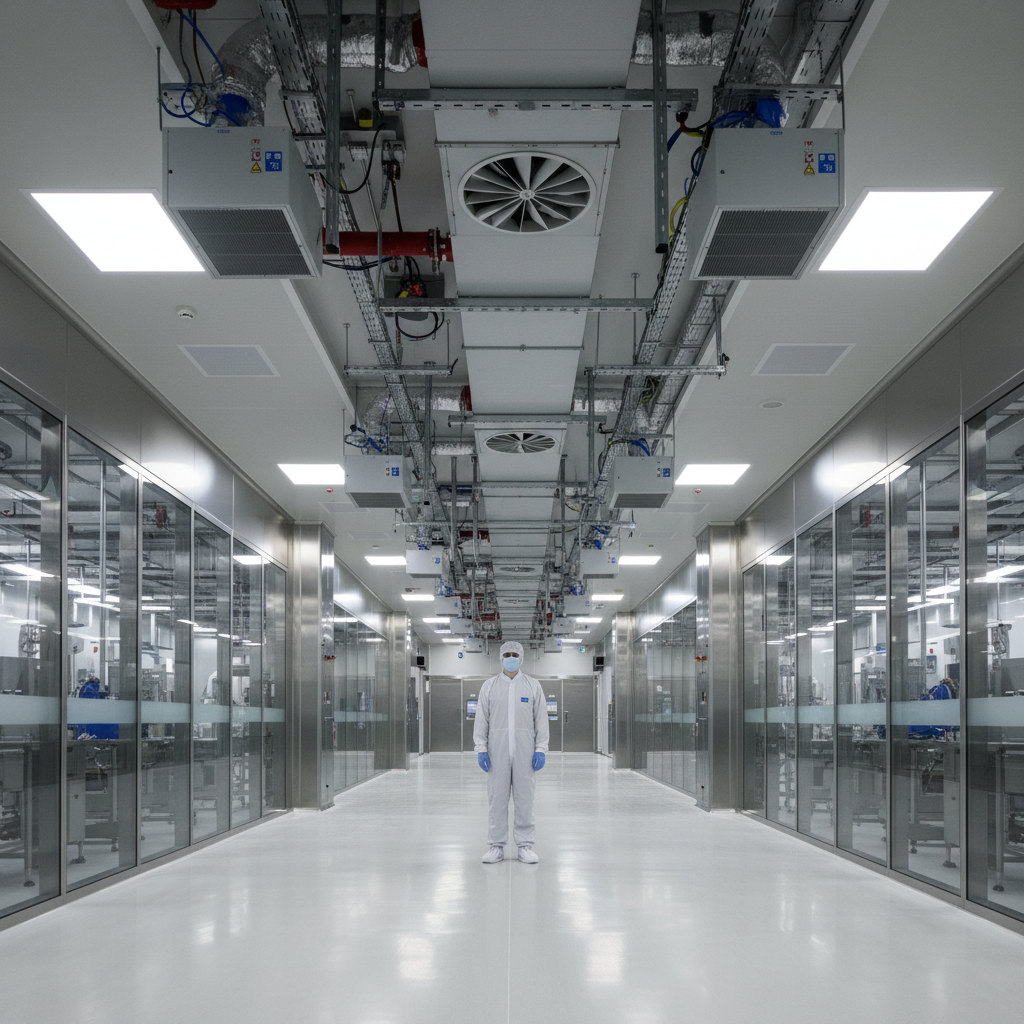
Annex 1’s expectation of continuous particle and viable-air monitoring during Grade A critical processing is not aspirational language. It is operational requirement. Meeting it demands infrastructure: a sensor network that captures, transmits, and stores environmental data continuously, with validated timestamps, alarm thresholds, and audit trails.
Physical parameters (temperature, humidity, differential pressure) are the most natural candidates for continuous IoT-based monitoring. They change in real time. They predict downstream problems: a pressure drop precedes particle ingress. And they generate data at frequencies that manual rounds simply cannot match.
A pharmaceutical-grade continuous monitoring network needs:
- Calibrated, validated sensors at each critical measurement point
- Connectivity with redundancy, because data gaps during a production batch are not acceptable
- Automated alarms routed to qualified personnel, not just logged in a database nobody reviews
- Tamper-evident, audit-trailed storage satisfying 21 CFR Part 11 and Annex 11 requirements
- Integration with the quality management system for deviation and CAPA workflows
I have spent 15 years building IoT monitoring architectures across supply chain and industrial environments. The pattern repeats everywhere: the sensor technology exists, but the gap is almost always integration. Getting data from the sensor to a decision-maker in a format that is auditable and actionable. In pharma, that integration gap has regulatory teeth. A reading without a validated, protected audit trail is a liability, not an asset.
On the viable-monitoring side, automated platforms are gaining traction. In 2025, a Daiichi Sankyo-hosted event brought together more than 80 QC leaders to discuss implementation of automated microbial detection for EM, water, bioburden, and sterility testing. The appeal is clear: shorter time-to-result, less manual plate reading, better traceability. But Annex 1 is specific: rapid and automated methods may only be adopted after validation demonstrates equivalency or superiority to established culture methods. You validate first. Adopt second.
A necessary caution: more sensors and faster results can create a dangerous illusion of control. Annex 1 states explicitly that monitoring or testing alone does not assure sterility. A continuous particle counter can trend perfectly while an operator’s gown is contaminated. A rapid micro system can report zero growth while a compressed-gas line carries organisms to a filling nozzle. Technology verifies that designed controls are working. It does not replace facility design, barrier systems, aseptic technique, cleaning validation, or personnel training.
The strongest architecture is not the one with the most sensors. It is the one that turns reliable, representative data into faster contamination decisions.
Frequently Asked Questions
What is environmental monitoring in the pharmaceutical industry?
It is the planned observation of air quality, surface contamination, personnel hygiene, physical conditions (temperature, humidity, pressure), and utilities in pharmaceutical manufacturing environments. The goal is to verify that contamination controls remain effective during production, supporting product quality and patient safety.
What parameters does a pharmaceutical EM program track?
A complete program tracks nonviable airborne particles, viable microorganisms (from air, surfaces, and personnel), temperature, relative humidity, differential pressure, airflow velocity, and utility quality (water, compressed gases). Specific parameters and frequency depend on room classification and a documented risk assessment aligned with the facility’s contamination control strategy.
How often should environmental monitoring be performed?
There is no universal frequency. FDA guidance recommends nonviable-particle and active-air sampling during each production shift in critical areas. EU Annex 1 requires continuous particle and viable-air monitoring during Grade A critical processing. Lower-classified areas follow a risk-based schedule established through the CCS.
What is the difference between alert levels and action limits?
An alert level is an early-warning threshold that triggers review and increased attention. An action limit requires formal investigation, corrective action, and product-impact assessment. FDA warns against averaging results because it can hide localized problems. Each excursion should be evaluated individually.
Does passing all EM tests prove a batch is sterile?
No. EU Annex 1 states explicitly that monitoring or testing alone does not assure sterility. EM provides evidence that a designed control system performed as expected. Sterility assurance depends on facility design, sterilization validation, aseptic process simulation, personnel qualification, and cleaning validation working together.
Can IoT sensors replace manual environmental monitoring entirely?
IoT sensors can continuously monitor physical parameters like temperature, humidity, pressure, and particle counts, reducing dependence on manual rounds. However, viable microbiological sampling still requires physical sample collection. The strongest programs combine continuous IoT monitoring for physical parameters with representative microbiological sampling at risk-based intervals.
If your environmental monitoring program generates data but not decisions, the architecture needs work. Whether you are building continuous physical-parameter monitoring for a cleanroom, scaling sensor networks across facilities, or connecting environmental data to your quality system, the path starts with understanding the gaps. Explore our environmental tracking solutions to see what continuous IoT monitoring looks like in practice, or reach out directly at info@datanetiot.com.






 +1 508 292 2210

3 Responses