

In 2022, farmed aquatic animals reached 94.4 million tonnes, surpassing capture fisheries for the first time. That number keeps climbing. So does the volume of living biomass whose survival hinges on water conditions that can shift from viable to lethal in hours.
Aquaculture environmental monitoring in 2026 goes well beyond a sensor in the water and a reading on a screen. It connects real-time chemistry to feeding decisions, regulatory proof, welfare signals, and ecosystem accountability. If you manage a farm, oversee compliance for one, or engineer the production systems that keep animals alive, this is what the monitoring stack looks like when it actually works.
What Aquaculture Environmental Monitoring Actually Covers
Most conversations about monitoring start and stop at water quality probes. That is one layer of three.
The first layer is farm-level water quality: the chemistry and physics inside your ponds, cages, raceways, or RAS tanks. Temperature, pH, dissolved oxygen, salinity, ammonia, turbidity, CO2. These parameters determine whether your animals grow, stress, or die today.
The second is the receiving environment: the water, sediment, and biological communities surrounding your operation. NOAA’s monitoring framework for marine aquaculture explicitly measures water quality, sediment conditions, biodiversity, and broader ecosystem effects. This is the layer regulators and environmental groups scrutinize, because it reveals whether your farm is changing the world around it.
The third is operational intelligence: feeding behavior, biomass estimates, mortality patterns, escape events, and welfare indicators. This is where cameras, acoustics, and AI enter. It is also where monitoring stops being a compliance cost and starts generating production advantage.
Ignore any one layer and you will be blindsided. A farm can show perfect in-cage oxygen while degrading the seabed beneath the pens. A farm can pass every discharge permit while losing stock to undetected ammonia spikes during crowding events.
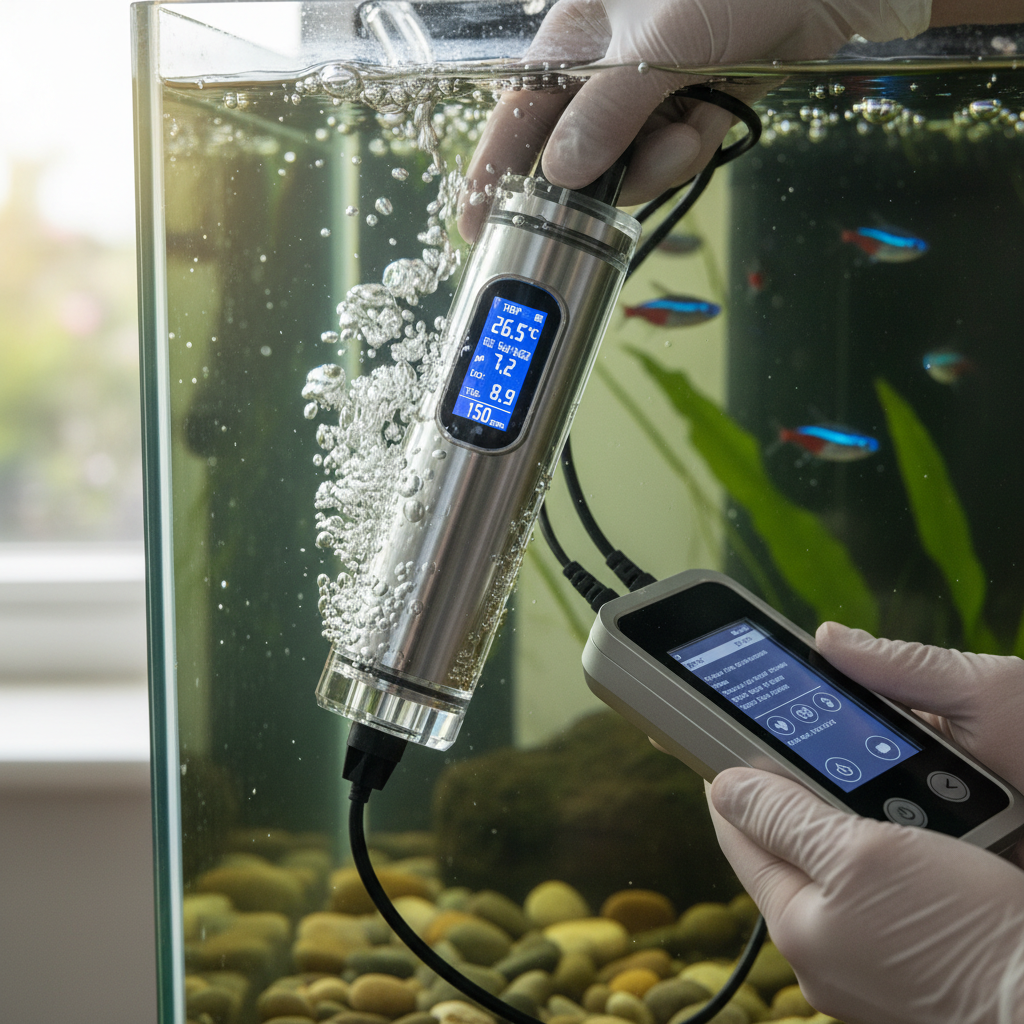
The Five Parameters You Measure First
A 2025 systematic review of 217 papers found that pH appeared in 98.2% of reviewed IoT monitoring cases, temperature in 92.9%, and dissolved oxygen in 62.5%. Those frequencies are not arbitrary. They reflect the parameters that kill fish fastest when they drift.
Here is the starting stack, in order of implementation priority:
- Temperature comes first. Every species has a thermal window; outside it, feed conversion drops, immune response weakens, and disease pressure climbs. Temperature also governs dissolved oxygen solubility, because warmer water holds less O2.
- Dissolved oxygen (DO) is the single fastest killer in aquaculture. Below 4 mg/L, most finfish are stressed. Below 2 mg/L, many are dying. Aeration response must be tied to real-time DO readings, not operator intuition.
- pH determines ammonia toxicity (un-ionized ammonia rises with pH), affects gill function, and signals biological processes in biofloc and RAS systems.
- Ammonia and total ammonia nitrogen (TAN) are the primary metabolic waste from fish. RAS operations depend on continuous TAN monitoring because prolonged exposure causes intoxication and mortality.
- Salinity or conductivity matters in any operation where mixing, dilution, or tidal exchange affects animal physiology.
After these five, expand to turbidity, nitrate, nitrite, CO2, oxidation-reduction potential, chlorophyll, and local weather. But do not add parameters before the core five are calibrated, alarmed, and connected to response protocols. More data points with poor calibration is worse than fewer data points done right.
From Sensor to Decision: How the System Works
The monitoring chain looks simple on paper. A sensor reads a value. A controller processes it. A communication layer transmits it. A database stores it. A dashboard displays it. An alert fires when a threshold is breached. Someone, or something automated, acts.
Every link in that chain can fail. And the failures compound.
A documented IoT system for Asian seabass farming fed temperature, pH, dissolved oxygen, salinity, and ammonia readings through an Arduino Uno and ESP8266 Wi-Fi module to cloud platforms. After three months of calibration against a YSI Professional Plus reference instrument, the system reported 76% to 97% accuracy with 0.27% to 4% relative error. Useful numbers. But notice: without that calibration step, the readings would have been noise dressed as data.
For distributed outdoor operations, connectivity is the next constraint. A LoRaWAN network of 10 solar-powered buoys covering an 8 km estuary transmitted temperature and salinity data to a gateway with mobile alerts for farmers. The tradeoff: one buoy lost roughly 20% of packets, with similar data gaps in poor conditions. That is not a LoRaWAN failure. It is the reality of RF propagation over water.
Cellular connectivity (LTE-M, NB-IoT) offers higher reliability where coverage exists. The choice between LoRaWAN and cellular is not philosophical. It depends on site geography, power availability, latency requirements, and what you need to prove to a regulator. In many of the deployments our team configures for remote environmental monitoring, cellular wins for critical-path monitoring because the cost of a data gap during an oxygen event is orders of magnitude higher than the cost of a cellular plan.
Why Sensors Fail in Water
This is the part no one in the top search results talks about. It is also the single biggest reason monitoring programs disappoint operators who expected set-and-forget reliability.
Biofouling is the primary enemy. Algae, barnacles, and biofilm coat sensor membranes within weeks. An uncleaned dissolved oxygen sensor does not read zero. It reads a plausible but wrong value. That is more dangerous than a dead sensor, because nobody investigates a plausible reading.
Calibration drift compounds the problem. Electrochemical sensors for pH, ammonia, and DO drift over time. A pH sensor reading 7.2 when the real value is 7.8 masks an ammonia toxicity risk, since un-ionized ammonia fraction is pH-dependent. Your dashboard says “safe.” Your fish disagree.
Corrosion attacks connectors, housings, and cable junctions, even with IP68-rated enclosures. Connectivity interruptions create silent data gaps: a sensor producing perfect readings that never reach your gateway is functionally dead. And power loss in remote, solar-dependent systems can coincide with the cloudy, stormy conditions that also stress your stock the most.
The countermeasures are not glamorous:
- Schedule physical cleaning and inspection on a fixed cycle, not “when we get around to it.”
- Maintain a reference instrument (YSI, Hach, or equivalent) and cross-check field sensors monthly.
- Buffer data locally on the device so connectivity drops do not equal data loss.
- Run redundant DO sensors on any tank or pen where oxygen depletion kills stock within hours.
- Document every calibration event, because a regulatory audit asks for records, not screenshots.
If your monitoring vendor cannot answer “what happens when the sensor fouls?” with a specific maintenance protocol, you do not have a monitoring system. You have an expensive weather vane.
What Regulators Actually Want
Compliance monitoring and production monitoring serve different purposes but share hardware. The difference is what counts as evidence.
In the US, the EPA identifies total suspended solids, biological wastes, biochemical oxygen demand, nutrients, ammonia, drugs, and antifouling chemicals as aquaculture pollutants of concern. Concentrated Aquatic Animal Production facilities producing 100,000 pounds or more must implement federal effluent guidelines and obtain NPDES permits with numeric or narrative discharge limitations.
Internationally, the picture is uneven. Less than half of Mediterranean and Black Sea countries have effective aquaculture monitoring systems, per FAO’s GFCM assessment. Norway mandates benthic condition monitoring under NS 9410. British Columbia committed to phasing out open-net salmon farming by 2029, shifting the regulatory floor for an entire production method.
The common thread across every framework: regulators want evidence, not data. A dashboard screenshot is not evidence. Evidence means a documented sampling design, calibrated instruments, quality controls, data retention policies, clear response thresholds, and records of what you did when a threshold was breached. For a broader reference on structuring defensible programs, see the WHO guidelines for environmental monitoring.
The Cooke Aquaculture situation illustrates what happens when those records are contested. In late 2024, the Conservation Law Foundation announced intent to sue Cooke under the Clean Water Act over alleged discharges at 13 Maine sites, followed by a federal complaint in early 2025. These are allegations, not adjudicated findings. But the monitoring lesson is straightforward: inaccessible or incomplete discharge and incident records create legal and reputational exposure that no communications strategy can repair.
Beyond the Cage: Satellites, eDNA, and Spatial Coverage
Farm-level sensors answer one question: “What are conditions in my pen right now?” They do not answer “Is my farm changing the surrounding ecosystem?” or “Where should I put my next site?”
NOAA demonstrated satellite-based spatial monitoring in a 2025 case study. Scientists analyzed Landsat-8 and Sentinel-2 data for Maine’s Damariscotta River estuary, measuring temperature, plankton abundance, and water clarity to map seasonal habitat suitability for Eastern oysters. Historical imagery reaching back to 2016 gave farmers variability context. The approach may extend to mussels, scallops, seaweed, and finfish.
Satellites solve a spatial problem that probes cannot: repeated, broad-area coverage for siting decisions, seasonal trends, and harmful algal bloom alerts. They do not measure cage-level ammonia, confirm a DO crash in a specific pen, or provide the sub-hourly resolution that emergency response demands. They complement local sensors, much like vertical farming sensors complement broader controlled-environment monitoring, or how a hydroponic monitoring system tracks conditions in soilless growing. They do not replace them. See also the article: Vertical Farm Monitoring System: What Pays Off.
Environmental DNA (eDNA) is the newest layer. It detects species presence, pathogens, and biodiversity from water samples without netting, diving, or direct observation. The science is real and advancing. But it still requires validated assays, disciplined sampling, and laboratory processing. Think of eDNA in 2026 as an investigation tool, not a continuous monitoring feed.
Australia’s Storm Bay program showed what independent spatial assessment looks like at scale. FRDC, IMAS, and CSIRO examined sediments and the water column across active salmon farming sites and out to 1.5 km from pens. The program found healthy, biodiverse habitats with no evidence of adverse effects from aquaculture inputs, while also recommending how future measurement should be structured. That kind of independent, spatially designed assessment builds a credibility that farm-only telemetry cannot.
AI in Aquaculture: Useful, Not Magic
The precision aquaculture market is estimated at $0.85 billion in 2025 and projected to reach $1.43 billion by 2030. A large share of that growth is AI-driven: computer vision for biomass and parasite counting, hydroacoustics for feeding control, time-series models for mortality prediction.
Where AI delivers measurable value today: feeding optimization (detecting pellet waste and adjusting delivery to cut the largest variable cost in finfish operations), biomass estimation (camera-based sizing without physical sampling), and early warning (flagging risk patterns in water quality and mortality data before human operators notice).
Where AI falls short of its own marketing: fully autonomous closed-loop production, disease diagnosis from video alone, and compensating for drifting sensor data. Two RAS cases ground this point. Atlantic Sapphire’s 2023 report attributed elevated mortality periods to suboptimal water-quality conditions in a heavily automated facility. A 2025 report described the loss of 170,000 salmon at Proximar after a major RAS incident. Both operations were instrumented and algorithmically managed. The sensors and models did not prevent the losses.
Buy AI tools for specific, validated outcomes: less feed waste, faster lice counts, earlier mortality alerts. Do not buy dashboards that visualize bad data more attractively.
Three Outcomes That Make Monitoring Pay
Aquaculture environmental monitoring is not a compliance tax. Implemented properly, it produces three measurable returns:
- Reduced mortality. Real-time DO and ammonia alerts with automated aeration response prevent the catastrophic loss events that erase entire production cycles. One overnight oxygen crash in a pen of 50,000 fish is not a data point. For many operators, it is a business-ending event.
- Lower feed waste. Feed typically represents 40% to 60% of variable cost in finfish. Monitoring water conditions and animal behavior to optimize feeding timing and quantity can improve feed conversion ratios meaningfully. Even a 5% FCR improvement at scale pays for the monitoring hardware many times over.
- Compliance confidence. The cost of a monitoring program is trivial next to a permit revocation, a Clean Water Act lawsuit, or a public crisis. Defensible, auditable environmental data is the cheapest insurance in aquaculture.
The decision is not whether to monitor. It is whether your system produces data you can act on, defend, and trust.
At Datanet, we deploy environmental monitoring hardware built for exactly the conditions this article describes: saltwater, UV, remote connectivity, and years of continuous operation. If your current setup gives you numbers without confidence, or dashboards without defensible decisions, that is the conversation we should have.
Frequently Asked Questions
What should an aquaculture farm monitor first?
Temperature, dissolved oxygen, pH, ammonia (TAN), and salinity or conductivity. These five parameters address the most immediate threats to animal survival and appear most consistently across both research literature and regulatory frameworks. Expand to turbidity, nitrate, CO2, and receiving-environment indicators as the program matures.
Are low-cost IoT sensors reliable enough for aquaculture?
They can be, with discipline. Documented systems have achieved 76% to 97% accuracy after calibration against reference instruments. Regular cleaning, monthly cross-checks with a reference probe, and local data buffering are non-negotiable. Low-cost sensors are not maintenance-free lab replacements, but they deliver valuable continuous data when properly managed.
Can satellite monitoring replace in-water sensors?
No. Satellites provide regional coverage for siting, seasonal trends, and algal bloom alerts. They cannot measure cage-level dissolved oxygen, ammonia, or pH at the resolution and frequency that operational and emergency decisions require. Satellites and local sensors are complementary, not interchangeable.
What is the difference between water quality monitoring and environmental impact monitoring?
Water quality monitoring measures conditions inside your operation: oxygen, pH, ammonia, temperature. Environmental impact monitoring assesses whether your farm is changing the surrounding ecosystem: sediment, biodiversity, wild populations, and receiving-water quality. Most regulatory frameworks now require evidence of both.
How often should aquaculture sensors be calibrated?
Monthly at minimum, using a reference-grade instrument. High-fouling environments (warm saltwater, nutrient-rich water) often require biweekly or weekly cleaning and calibration checks. Drift is the most common source of plausible but wrong readings, and it is invisible without a reference comparison.
Does AI eliminate the need for manual oversight in aquaculture?
No. AI accelerates pattern recognition and can automate specific tasks like feeding adjustment. But its output quality depends entirely on its input data quality. Fouled sensors, uncalibrated probes, and connectivity gaps produce confident, wrong predictions. Human maintenance, judgment, and veterinary expertise remain essential to any monitoring program.







 +1 508 292 2210

8 Responses