Aquaculture produced 130.9 million tonnes in 2022, with farmed aquatic animals crossing the 50% mark of all aquatic-animal production for the first time. First-sale value: $313 billion. The global aquaculture monitoring system market behind that production? Roughly $1.64 billion in 2025. That’s 0.5% of the production value it’s supposed to protect.
The mismatch tells you something. Most farms don’t lack sensors. They lack systems. A dissolved-oxygen probe at the wrong depth, connected to a dashboard nobody checks at 3 AM, is not a monitoring system. It’s an expensive data logger.
I’ve spent 15 years deploying IoT solutions in environments where missed signals cost money: aviation, freight, maritime, industrial supply chain. The pattern repeats. The gap between collecting data and changing an outcome is where most implementations stall. Aquaculture is no different. The farm that prevents a mass-mortality event overnight isn’t the one running more sensors. It’s the one with the tightest loop between detection, decision, and response.
What an Aquaculture Monitoring System Actually Is
A monitoring system that works has five distinct layers. Remove one, and you have an instrumentation project, not an operational program.
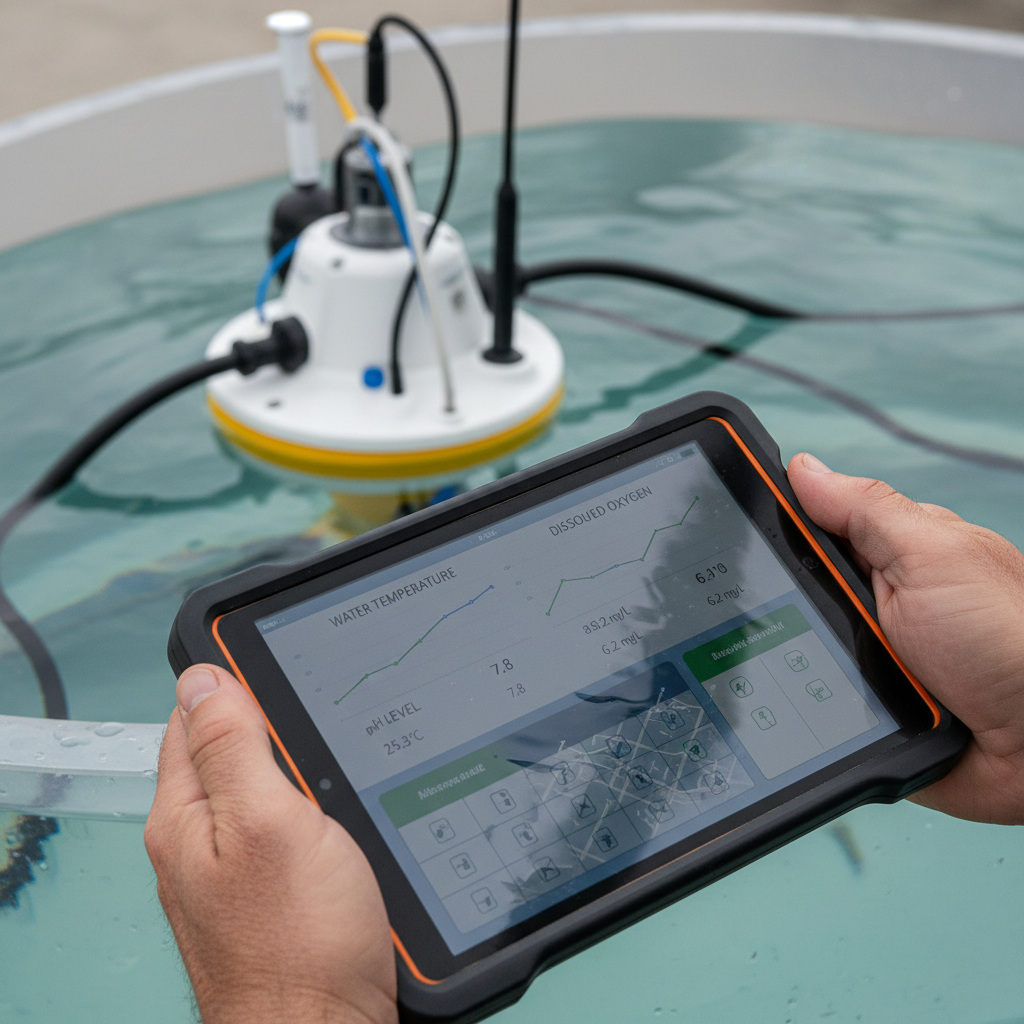
- Sensing: water-quality probes (dissolved oxygen, temperature, pH, salinity, conductivity, turbidity, ammonia, CO2, H2S), weather stations, current meters, tide gauges, water-level sensors.
- Animal observation: underwater cameras, stereo vision for biomass, sonar for behavior and distribution, acoustic tags, molecular methods (eDNA) for pathogen detection.
- Connectivity: LoRaWAN, cellular (4G/LTE-M/NB-IoT), Wi-Fi, satellite. Gateways, edge processing, power systems (solar, battery, grid).
- Analytics: dashboards, trend detection, anomaly alerts, AI-based biomass estimation, feeding optimization, welfare scoring.
- Response: alert routing, automated actuators (aerators, feeders, pumps, oxygenation), escalation protocols, documented playbooks.
Remove layer five and you have a very expensive weather station. Data gets captured, stored, visualized, maybe even analyzed. But nobody acts. Or worse: the alert fires, and the operator on shift doesn’t know what it means.
The ITU’s 2025 smart-aquaculture supplement organizes the emerging field around IoT monitoring, water-quality optimization, growth management, autonomous feeding, and smart energy management. It also makes a point the market hasn’t fully absorbed: standard protocols are needed to make devices and systems interoperable. Most farms accumulate hardware from different vendors over years. Without interoperability, each addition creates another silo.
What to Measure: Water, Animals, and Infrastructure
Start with what kills fish fastest
A 2025 systematic review of IoT sensors in aquaculture found that pH appeared in 98.2% of reviewed deployments, temperature in 92.9%, dissolved oxygen in 62.5%, and total dissolved solids in 30%. That ranking reflects research interest, not necessarily operational urgency. On a commercial farm, dissolved oxygen crashes kill faster than pH drift. Temperature shifts drive feeding rates and disease vulnerability. Salinity affects osmoregulation in ways pH alone won’t flag.
The practical starting set for any finfish or shrimp operation: dissolved oxygen, temperature, pH, and salinity or conductivity. Everything else is conditional on species, system type, and the failure modes that have historically cost you money.
Event-specific sensing in RAS
In recirculating aquaculture systems, hydrogen sulfide is a silent killer. H2S is toxic at microgram-per-liter levels, can cause mass mortality, and spikes can appear and resolve within minutes. Fixed-time sampling at selected tanks routinely misses these events.
The SeaRAS AquaSense study placed four wireless monitoring units at RAS hotspots, measuring H2S at sub-microgram-per-liter levels alongside CO2, O2, pH, salinity, temperature, total gas pressure, and turbidity. Units were positioned before and after the fish tank, around the drum filter and biofilter, and at the degasser exhaust. The point wasn’t adding more sensors. It was measuring the right hazard at the place and speed it occurs.
If your operation is a pond or sea cage, H2S may not be the primary threat. Ammonia spikes after feeding, temperature stratification, or current-driven oxygen depletion might be. The principle holds: identify the failure mode, then instrument it where it happens.
Cameras, sonar, and tags answer different questions
Water sensors measure the environment. Cameras and sonar measure the animals. Comparing them is a category error.
Computer vision can estimate biomass, track behavior, detect feed waste, and assess welfare. Sonar and hydroacoustics work where optical cameras struggle: in dark or turbid water, mapping fish position and distribution across a cage. A 68-day commercial trial with European sea bass in Greece used acoustic tags on individual fish and found positive correlations between growth and both temperature and dissolved oxygen, with depth and activity responding to environmental changes.
But there’s a maturity gap. Aquabyte’s autumn 2025 trial with Mowi Ireland and BIM reported promising data for biomass, growth, welfare, and lice workflows, yet the published material didn’t include accuracy figures, and manual handling was still required. That’s not failure. It’s where the technology actually is: decision support, not replacement of fish-health professionals.
The right approach is sensor fusion. Use each modality to compensate for what the other misses. Water probes give you continuous chemistry. Cameras give you behavior and biomass. Sonar gives you spatial distribution. Together, they create a picture no single instrument can.
Parameter matrix by farm type
| Parameter | Primary use | Farm types | Alert speed needed |
|---|---|---|---|
| Dissolved oxygen | Survival threshold, feeding decisions | All | Minutes |
| Temperature | Metabolic rate, disease risk, feed rate | All | Hours (trends) / Minutes (RAS) |
| pH | Ammonia toxicity threshold, CO2 relationship | All, especially RAS | Hours |
| Salinity / conductivity | Osmoregulation, species tolerance | Marine, brackish, RAS | Hours |
| H2S | Lethal spike detection in biofilters | RAS | Seconds to minutes |
| Ammonia (TAN / NH3) | Feed waste, biofilter performance | RAS, intensive ponds | Minutes to hours |
| Turbidity | Water clarity, sediment, algae blooms | Ponds, cages, hatcheries | Hours |
| Current / tide | Oxygen supply, cage stress, waste dispersal | Sea cages | Hours |
| Camera / sonar | Biomass, behavior, feeding, welfare, lice | Cages, large tanks | Real-time (feeding) / Daily (biomass) |
Architecture: Connectivity, Power, and the Parts Nobody Glamorizes
The part of an aquaculture monitoring system that gets the most attention is the AI dashboard. The part that determines whether the system actually works is the connectivity layer and the power supply. Nobody writes white papers about LoRaWAN gateway placement on a shrimp pond in central Vietnam, but that’s where more deployments fail than in the analytics engine.
Choosing a connectivity protocol
The decision depends on three variables: distance from infrastructure, data volume, and power budget.
| Protocol | Range | Throughput | Power | Best for |
|---|---|---|---|---|
| LoRaWAN | 2 to 10+ km (line of sight) | Low (sensor telemetry) | Very low (years on battery) | Remote ponds, distributed sensors |
| Cellular (4G/LTE-M) | Carrier coverage | Medium to high | Moderate | Camera feeds, cloud dashboards |
| NB-IoT | Carrier coverage | Low to medium | Low | Dense sensor networks |
| Wi-Fi | Tens of meters | High | High | Indoor RAS, hatcheries |
| Satellite | Global | Low (expensive per byte) | Variable | Offshore cages, zero coverage |
Many farms will use a hybrid. LoRaWAN for distributed environmental sensors across ponds. Cellular for camera streams and cloud uploads. Wi-Fi for the control room. The real architecture decision isn’t one protocol versus another. It’s how they hand off data to the same analytics layer without creating information islands.
Power: the constraint nobody markets
Solar panels with battery backup are the default for outdoor aquaculture deployments. The math is straightforward but unforgiving. A temperature and DO probe on LoRaWAN can run for years on a lithium battery. A camera streaming video over 4G needs constant power. At higher latitudes, winter daylight may not sustain a camera without grid power or oversized panels.
Design the power envelope before choosing sensors. A two-probe LoRaWAN setup with solar is a completely different engineering problem than a stereo camera array on cellular with cloud upload. Both are valid. The second costs 5x to 10x more per monitoring point to deploy and maintain.
Maintenance and calibration: where systems die quietly
This is the biggest operational cost after deployment, and virtually nobody in the market talks about it openly.
Every sensor submerged in aquaculture water will drift. Biofilm, algae, sediment, and mineral deposits accumulate on probe surfaces. An optical dissolved-oxygen sensor fouled with biofilm reads low. A pH probe coated in calcium reads slow. The data still appears on the dashboard. It still looks like a number. And it’s wrong.
A generalized maintenance cadence:
- Optical DO sensors: clean weekly, calibrate monthly in warm, high-nutrient water. Less frequently in clean, cold environments.
- pH probes: clean and verify weekly. Replace reference electrolyte as specified. Expect 12 to 18 months of useful life before replacement.
- Conductivity/salinity: clean monthly, verify with standards quarterly.
- Turbidity: clean frequently (biofouling is aggressive on optical surfaces), verify monthly.
Automated wiper systems reduce fouling. Anti-fouling coatings help. Neither eliminates the need for manual inspection. Budget for sensor replacement, not just sensor purchase. A probe that reads correctly for six months and then drifts undetected for three is worse than no probe at all, because it creates false confidence in data that no longer reflects reality.
This is where I see the clearest parallel to industrial IoT: the hardware is the easy part. The operational discipline around calibration, cleaning, and replacement is what separates a reliable system from an abandoned project.
Three Cases That Show What Really Matters
Visualization before autonomy
Endress+Hauser deployed an automated, cloud-based monitoring system at a prawn farm on Bribie Island, Australia, measuring dissolved oxygen, pH, temperature, and salinity through Memosens instruments, a Liquiline transmitter, and the Netilion visualization platform.
The reported outcome wasn’t AI-driven autonomy. It was simpler: automated data collection saved operator time, increased data availability for pattern recognition, and made interpretation easier through visualization. No black-box algorithm. Just reliable, continuous data replacing manual logbooks.
That’s a useful reality check. The fastest return on a monitoring investment often comes from removing data-entry friction and making trends visible. Not from AI feeding optimization. Not from predictive disease models. From knowing what your water looked like at 3 AM without sending someone out with a handheld meter.
Measuring the hazard at the speed it occurs
The SeaRAS deployment in a RAS facility took a fundamentally different approach. Instead of broad environmental coverage, it targeted a specific lethal hazard: hydrogen sulfide at sub-microgram-per-liter levels, with continuous monitoring at four RAS hotspots.
Four wireless units at the right spots caught what scheduled sampling would have missed. The engineering lesson: a monitoring system designed around the speed and location of the most dangerous failure mode will outperform one designed around parameter breadth every time.
Heavy instrumentation doesn’t eliminate biological risk
Atlantic Sapphire operates one of the world’s largest land-based salmon farms. Their 2024 integrated report disclosed a 6.4% mortality rate, following biological challenges linked to high temperatures carried over from 2023. Water quality and temperatures stabilized from Q4 2023, with improved biological performance through 2024.
Monitoring didn’t fail. But monitoring alone didn’t prevent losses either. A highly instrumented farm can still lose fish if the thermal engineering, biomass capacity, or emergency protocols behind the data aren’t sound. Monitoring gives you visibility. It doesn’t give you resilience unless paired with the systems and discipline that act on what the data reveals.
Choosing a System: Start With Your Most Expensive Failure
The vendor landscape is fragmented. Water-instrument companies, camera analytics startups, feeding platforms, ROV providers, and gear-tracking firms all use the word “monitoring.” They compete for different budgets and solve different problems.
Before comparing products, answer four questions:
- What has cost you the most in the last three years? Mortality events, feed waste, labor on manual sampling, regulatory penalties, escapes, disease outbreaks?
- What is the failure mode behind that cost? Oxygen crash, temperature spike, undetected pathogen, biofilter failure, structural damage?
- How fast must you detect and respond? Seconds (H2S), minutes (DO crash), hours (temperature trend), days (biomass change)?
- Who will own the response? An on-site operator, a remote control room, an automated actuator, or a combination?
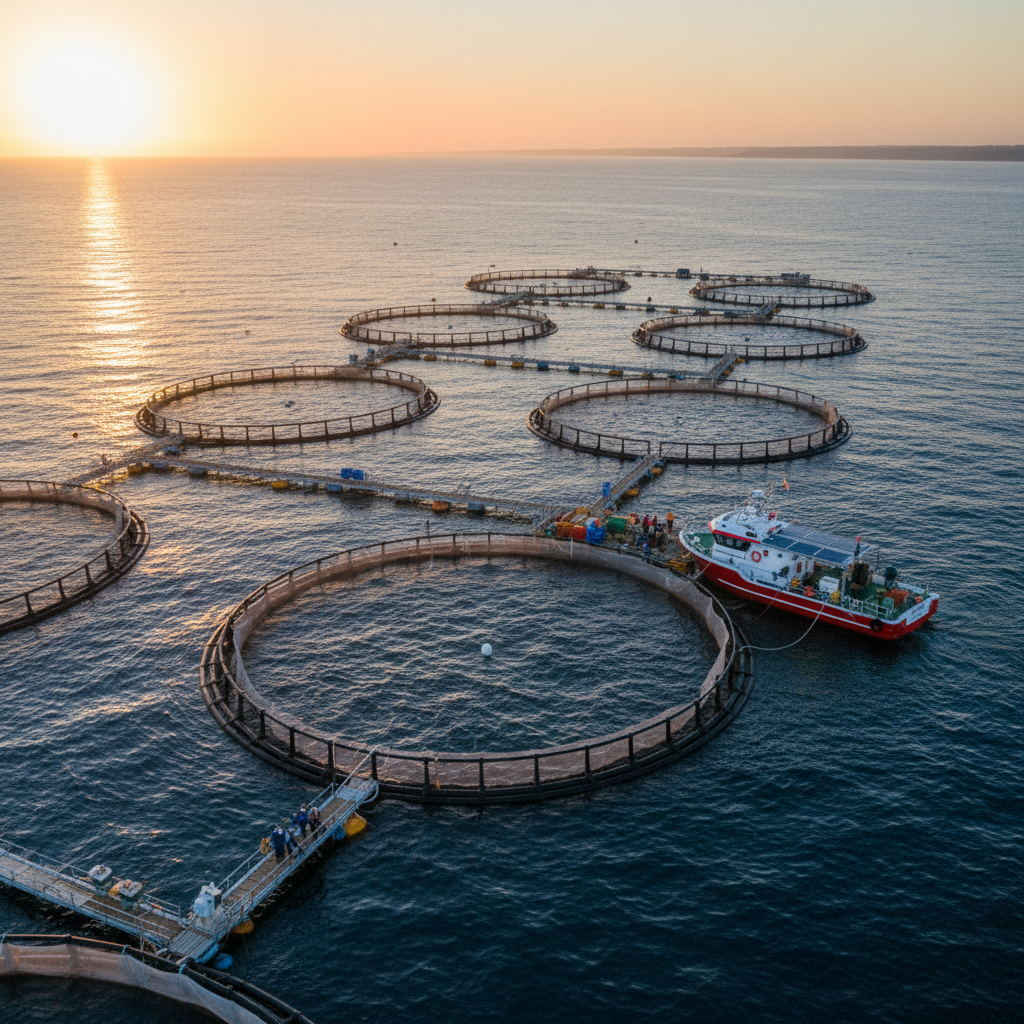
Those answers define the minimum viable system. A small shrimp pond might need two DO/temperature probes, a LoRaWAN gateway, a cloud dashboard with SMS alerts, and a documented response protocol. A multi-cage salmon operation might need distributed environmental sensors, underwater cameras, hydroacoustic feeders, AI biomass estimation, and 24/7 remote operations.
| Tier | Architecture | Typical scope | Best for |
|---|---|---|---|
| Manual + spot checks | Handheld meters, logbooks, periodic lab samples | Low-density ponds, hatcheries, research | Low stocking density, experienced staff |
| Sensor + analytics hybrid | Continuous probes, cloud dashboard, alerts, human response | Commercial ponds, tanks, RAS, cages | 24/7 water visibility, faster response |
| Closed-loop with AI | Sensors + cameras + sonar + AI + automated feeding/aeration | Large commercial, multi-site | Scale operations with validation capacity |
The staged path is usually right. Start with the tier that addresses your most expensive failure. Prove the data quality. Validate the response workflow. Then expand.
What to demand from a vendor
Ask the vendor to replay real site data, not a demo with clean synthetic numbers. Ask them to show how the system handles sensor outage, bad data, and connectivity loss. Ask for quantified false-alarm rates and missed events from actual deployments. Demand explicit calibration intervals and sensor replacement costs. Clarify data ownership, export formats, and API access. Walk through the exact alert-to-action workflow: who gets notified, through what channel, and what happens if nobody responds.
For AI-based products, add species-specific validation. A model trained on Norwegian salmon cages won’t transfer to Vietnamese shrimp ponds without retraining.
Public component pricing gives a rough floor. YSI lists an IQ SensorNet controller at $2,826 and dissolved-oxygen probes between $1,216 and $2,516. Those are individual components, not installed systems. Total cost should include probes, calibration standards, mounting, gateways, connectivity subscription, cloud platform, installation, training, maintenance labor, and sensor replacement over three to five years.
Where the Market Is Heading
Global Market Insights estimates the monitoring and automation market at $1.64 billion in 2025, growing to $4.03 billion by 2035 at a 9.4% CAGR. Hardware accounts for about 53% of revenue ($869 million), software 22% ($361 million), and services 25% ($410 million). Finfish farming represents half the market. Shrimp and crustacean farming is the fastest-growing segment at 10.5%.
Several forces will shape systems over the next two to three years.
Closed-loop feeding and control is advancing. AKVA Group and Observe Technologies launched an AI feeding assistant in August 2026 that combines pellet recognition, fish behavior analysis, and multi-source data to deliver cloud-based feeding recommendations. It represents a real transition: the system uses behavioral context to support a decision, not just a feed timer. But it remains human-in-the-loop, and independent accuracy data hasn’t been published.
Molecular biosecurity is closing the gap between visible symptoms and early detection. eDNA and eRNA methods are moving toward field-compatible pathogen detection without repeated fish handling. The operational constraint: converting a positive molecular signal into a validated action threshold is still an open problem. A PCR result is not a clinical diagnosis.
Autonomous robotics is growing. Remora Robotics raised $16.1 million in July 2025 for autonomous submarine robots that clean and inspect net pens while transmitting condition data. Contracts with Mowi and Bremnes Seashore, plus expansion to Chile, signal commercial traction.
Welfare regulation is tightening. The European Commission published a report on farmed-fish welfare gaps in April 2026, making welfare an active regulatory concern. Monitoring systems will increasingly need to produce auditable records tying water quality, behavior, handling, mortality, and infrastructure events together.
And interoperability is becoming a procurement criterion. Farms that invested in a single vendor’s ecosystem five years ago are now paying the cost of closed data. The next competitive advantage belongs to platforms that expose clean APIs and standard data formats, not the ones that add another proprietary screen.
The architecture behind a reliable aquaculture monitoring system (connectivity, sensor selection, data integration, maintenance planning) overlaps heavily with what we build every day at Datanet for maritime, industrial, and environmental IoT clients. Similar monitoring principles apply to controlled-environment agriculture—our hydroponic monitoring system uses comparable sensor fusion and connectivity strategies. If you need environmental tracking hardware built for wet, remote, demanding conditions, or if you want to think through the connectivity layer for a new deployment, reach out to our team.
Frequently Asked Questions
What is an aquaculture monitoring system?
A connected stack of sensors, cameras, communication hardware, analytics software, and response protocols that tracks water quality, animal condition, and equipment status across a farm. A complete system includes not just data collection but alert routing and documented response workflows. The ITU’s 2025 framework covers monitoring, water optimization, growth management, feeding, and energy management.
Which water parameters should I monitor first?
Dissolved oxygen, temperature, pH, and salinity or conductivity. These four cover the most common failure modes across species and farm types. Add ammonia, CO2, or H2S based on your system (H2S is critical for RAS). A 2025 IoT review found pH and temperature most commonly deployed, but dissolved oxygen is often the most operationally urgent parameter on a commercial farm.
How much does an aquaculture monitoring system cost?
Component costs start at $1,200 to $2,800 per sensor or controller based on publicly listed YSI pricing. A basic pond setup with two probes and a LoRaWAN gateway may run $5,000 to $15,000. Multi-cage systems with cameras, AI, and cloud infrastructure can reach six figures. Always budget for maintenance, calibration, connectivity, and sensor replacement over three to five years.
Can AI replace manual fish health checks?
Not in 2026. Current AI systems provide decision support: biomass estimates, feeding optimization, behavior anomaly detection, lice counting. Published trials, including Aquabyte’s work with Mowi Ireland, show promising results but still require manual handling and lack independently verified accuracy figures. Use AI to augment experienced farm staff, not replace them.
What connectivity protocol works best for remote farms?
LoRaWAN for low-bandwidth sensor data at distances up to 10 km, with battery life measured in years. Cellular for higher-bandwidth needs (cameras, video) where coverage exists. Satellite for offshore or zero-coverage sites. Most commercial deployments use a hybrid: LoRaWAN for distributed sensors, cellular for gateways and camera streams.
How often do submerged sensors need maintenance?
In warm, nutrient-rich water, expect weekly cleaning and monthly calibration for optical DO sensors. pH probes need weekly verification and replacement every 12 to 18 months. Turbidity sensors foul aggressively. Automated wipers and anti-fouling coatings help but don’t eliminate manual inspection. A drifting sensor creates false confidence, which is worse than no data at all.


 +1 508 292 2210

3 Responses