

Every minute a narrowbody sits at a gate costs an airline over $100 in direct operating expense. Multiply that by four turns per day across a fleet of 200 aircraft, 365 days a year. The number gets uncomfortable fast.
Aircraft turnaround time optimization is a nearly $2 billion market, projected to reach $3.84 billion by 2033. Airlines, airports, and ground handlers are chasing the same target: fewer minutes between block-in and block-out. But here’s what I keep seeing in the field: the conversation fixates on turnaround management software and AI dashboards while the physical ramp layer, where GSE, ULDs, wheelchairs, and tooling either show up on time or don’t, gets treated as someone else’s problem.
That disconnect between the digital plan and the physical ramp is where turnaround minutes silently burn.
What Every Minute on the Ground Actually Costs
The financial case for turnaround optimization is sharp enough to cut through any capital committee.
EUROCONTROL pegs ground at-gate delay cost at EUR 17.78 per minute. Airlines for America puts 2024 US passenger-airline block-time cost at $100.76 per minute. Industry-wide, flight disruptions eat roughly 8% of total airline revenue, around $60 billion annually.
But cost avoidance is only half the equation. Boeing research shows that shaving 10 minutes off a 40-minute turnaround increases aircraft utilization by 8% for typical point-to-point carriers. Run that aircraft four times a day, and those 10 minutes free up 40 additional revenue-earning minutes daily. One widely cited estimate puts the annual profit improvement at $500K to $1 million per aircraft. At fleet scale, that’s not an optimization project. It’s a revenue strategy.
| Benchmark | Value | Source |
|---|---|---|
| US block-time cost per minute | $100.76 | Airlines for America, 2024 |
| EUROCONTROL at-gate delay cost per minute | EUR 17.78 | EUROCONTROL Standard Inputs |
| 10-min reduction impact on utilization | +8% | Boeing via OAG |
| Airbus A320 full-service turnaround | 35 to 45 min | Airbus |
| Annual disruption cost, industry-wide | ~$60 billion | Industry estimates |
| Turnaround optimization market (2024) | $1.94 billion | Dataintelo |
And yet, the variance between airlines is staggering. OAG’s measurement of US major carriers found planned turnarounds ranging from 52 minutes (Southwest) to 68 minutes (United). Actuals ran even wider: 59 minutes (Southwest) to 77 minutes (Delta). JetBlue narrowbodies showed a 21% variance against plan. That’s not a rounding error. That’s structural inefficiency baked into the operation.
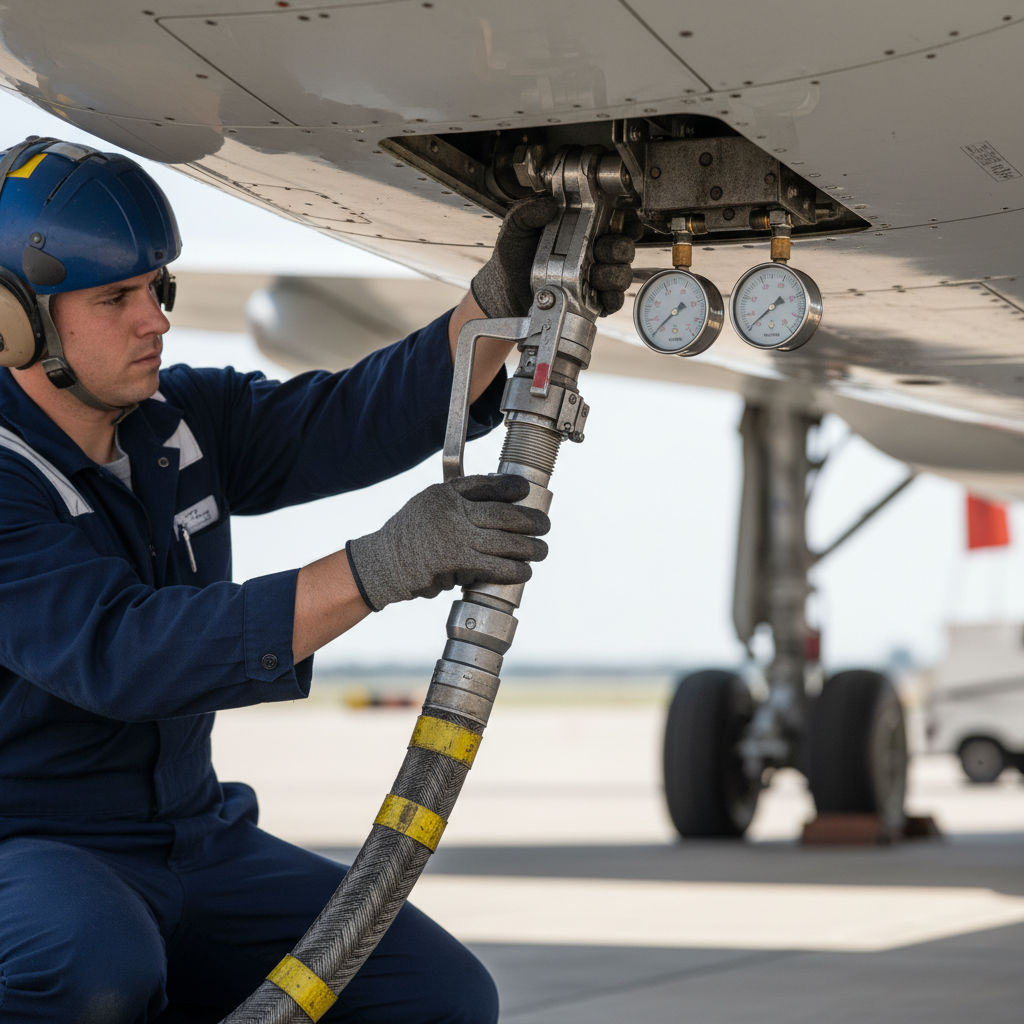
Where Turnaround Minutes Disappear
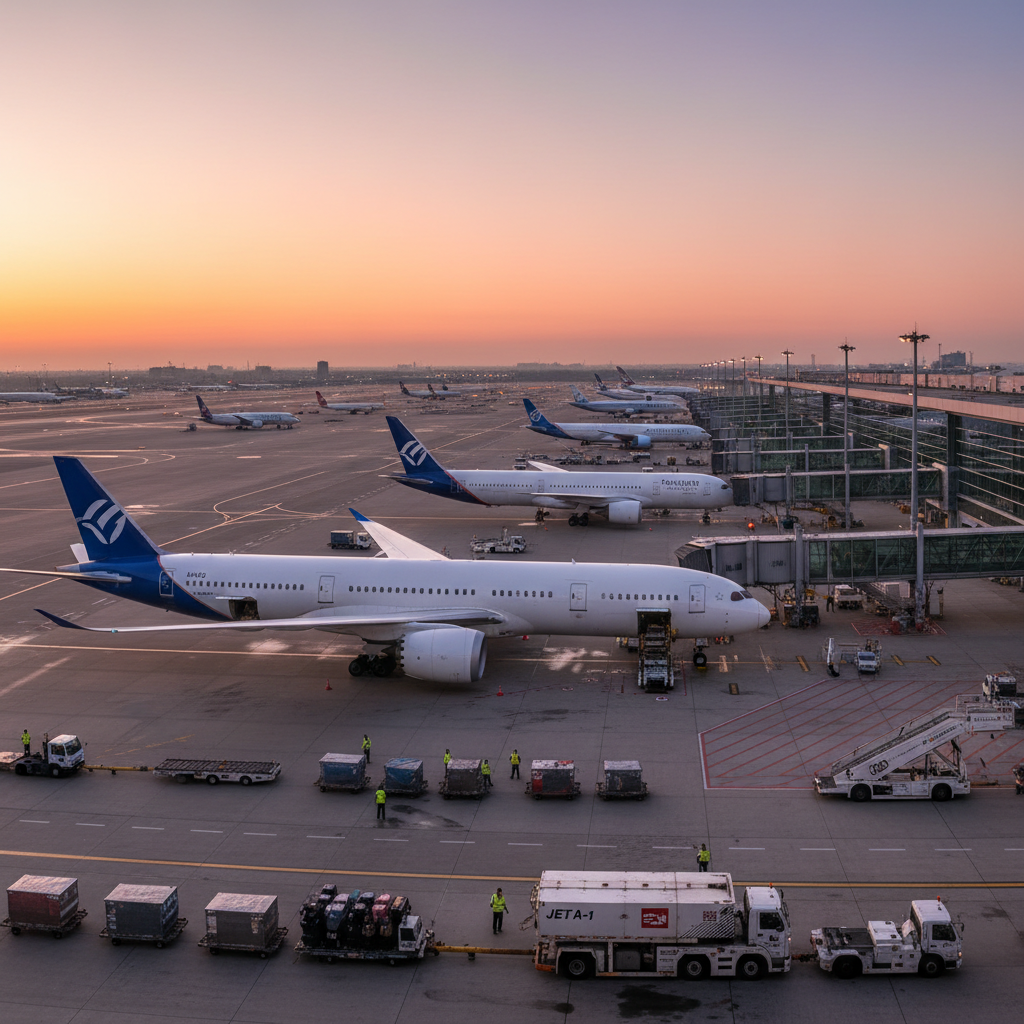
A single commercial turnaround involves deplaning, unloading cargo and baggage, refueling, cabin cleaning, catering, maintenance checks, reloading, and boarding. OAG reports that a typical turn comprises hundreds of individual tasks involving more than 75 different people and entities. All of them competing for space on the same apron, against the same clock.
The spread between good and bad is enormous. Assaia’s industry benchmark found a 41-minute gap between the best and worst turnaround performances. Top performers completed three more turnarounds per day than the bottom quartile. Three extra turns per gate, per day. That’s not a marginal difference. That’s a different business model.
Boarding and deplaning alone account for up to 40% of turnaround duration, according to research published in the Journal of Air Transport Research Society. Cabin cleaning and catering can run in parallel when the operation is choreographed well. In practice, they often wait because the crew or equipment arrived late.
One counterintuitive factor worth flagging: newer-generation narrowbodies like the A320neo and 737 MAX actually require longer turnarounds than their predecessors due to engine cool-down requirements. Better fuel efficiency in the air, more ground time needed on the ramp. Airlines upgrading their fleets sometimes discover their turnaround targets need recalibration on day one.
The Equipment Blind Spot
Most turnaround optimization discussions center on software: task sequencing, AI predictions, milestone tracking. These platforms are valuable. But they share a common assumption: every physical asset needed for the turn is already in position when the aircraft reaches the gate.
That assumption fails constantly.
A 2026 study published in MDPI’s Aerospace journal analyzed the INTACT system-of-systems architecture and found that wheelchair localization accounts for 15% of passenger-handling delays, and trolley inventory issues cause 10% of turnaround delays. These aren’t exotic failure modes. They’re missing equipment. Someone can’t find the wheelchair. The catering trolley is three gates away. The belt loader was borrowed by another team and never returned.
The labor shortage compounds this. A 2023 IATA survey found 37% of ground handling professionals anticipated staffing shortages, and 60% felt they were inadequately staffed. Fewer people means each person handles more equipment across more gates. Without real-time visibility into where assets are, ramp agents waste minutes walking, searching, improvising—delays that compound with maintenance-related ground time losses.
The turnaround management platform tells the ops center that catering should start at minute 8. But if the catering truck is sitting idle at a remote stand because nobody tracked its return, minute 8 comes and goes. The dashboard turns red. The delay propagates. And the $100-per-minute clock keeps running.
Five Levers That Actually Cut Ground Time
Before tactics, a constraint. The Flight Safety Foundation estimates roughly 243,000 ground-handling injuries per year globally, at a rate of about 9 per 1,000 departures. Cost to major airlines: at least $10 billion annually. Ground damage remains one of the most common accident types in IATA’s 2025 Safety Report.
The goal is never to compress tasks into unsafe margins. It’s to eliminate waste and wait time so tasks execute at normal speed, on time, with the right equipment already in place. Every lever below follows that principle.
1. Parallel processing
Running tasks simultaneously instead of sequentially sounds obvious, but it demands deliberate choreography. Cleaning, catering, and fueling can overlap with cargo unloading if the ramp layout and equipment positioning allow it. Industry data suggests parallel processing reduces turnaround time by 25% to 40% when executed well. Delta demonstrated a simpler version: by changing the aircraft push-back angle from 90 to 45 degrees, they saved one to two minutes per turnaround immediately. No new technology. Just geometry.
2. AI computer vision on the ramp
Assaia’s 2025 report, covering over 450,000 AI-enabled turnarounds at 15 airports, documents a 25% reduction in departure delays and one extra flight per day for every 20 gates. The platform analyzes video feeds and operational data to predict delays before they cascade. At a large hub, Assaia estimates that translates to over $70 million per year. Alaska Airlines, United, and JetBlue are already running it live. This isn’t a pilot program.
3. Ramp asset visibility through IoT
This is the layer most turnaround strategies skip entirely. IoT trackers attached to GSE, ULDs, stairs, GPUs, and catering equipment provide real-time location data throughout the full cycle, not just when an asset appears on a task sheet. The distinction matters. Shipment tracking tells you equipment was delivered to the ramp. Asset tracking tells you where it is right now, how long it’s been idle, and whether it’ll be available for the next turn.
4. Predictive buffer allocation
Not all buffers should be equal. A 2026 study in the Journal of Air Transport Research Society used XGBoost machine learning models combined with stochastic optimization to allocate buffers dynamically across the day. The finding: optimal buffers are highly heterogeneous, shaped by exposure to delay accumulation rather than by airline size. The morning turn might need 5 minutes of buffer. The fourth turn at a congested hub might need 15. Static buffers waste time in the morning and fail by afternoon.
5. Standardized ground procedures
IATA’s Ground Operations Manual (IGOM) and ISAGO audit program provide the framework. Standardization matters because turnarounds involve multiple third-party ground handlers, each with different training levels and equipment fleets. When procedures are standardized, the variance between a good turn and a bad turn narrows. And it’s the variance, more than the average, that breaks schedules.
How Asset Tracking Closes the Ramp Gap
At Datanet, we work with airlines, MROs, and ground handlers on a specific piece of this puzzle: making physical assets visible throughout their entire operational lifecycle, not just during a scheduled task.
A turnaround management platform tracks tasks. It knows “belt loader should arrive at gate B7 at 14:32.” It does not know where that belt loader actually is at 14:30. IoT asset tracking fills that gap. A cellular or GNSS-enabled tracker mounted on GSE, ULDs, or tooling reports position continuously. The data feeds into the same operational systems that manage the turnaround sequence.
In aviation environments, hardware selection matters. Standard consumer-grade trackers don’t survive ramp conditions: jet blast, temperature extremes, persistent vibration. Devices like the Thingfox T2, which carries DO-160 airfreight certification, are purpose-built for this. For ground equipment with less extreme exposure, ruggedized cellular trackers from our asset tracking range cover everything from battery-powered GPS tags to hardwired fleet units.
The outcomes we see when clients deploy ramp-wide asset tracking:
- GSE utilization rates increase because ops teams see which units are idle and where. Over-purchasing of backup equipment drops.
- Equipment cycle time (gate to maintenance to gate) becomes measurable for the first time. Reducing what you can finally see.
- Pre-positioning for the next turn starts before the current one ends, because the system shows what’s available within range.
- Dwell time at wrong locations drops, directly cutting the “where’s the belt loader?” delays that cascade through the turnaround timeline.
This is asset tracking in the full sense. Not shipment tracking, where the job ends at delivery. The device follows the asset through deployment, use, return, maintenance, and redeployment. Continuous visibility is what enables turnaround management systems to work as designed rather than running on assumptions about where things should be.
The business case is clear. The MDPI INTACT study quantified a 3-minute average turnaround reduction from intelligent technology integration, producing $1.34 million in annual benefit per aircraft, with a payback period under 18 months on a roughly $2 million investment. Scale that across a fleet, and the numbers make the conversation short.
Measuring What Matters
Planned-versus-actual variance is more diagnostic than average turnaround time. An airline averaging 55 minutes with a 3-minute variance is operationally healthier than one averaging 50 minutes with a 16-minute variance. OAG found United was the only major US carrier that consistently held variance within a six-minute gap, despite having the longest planned turnaround at 68 minutes. Consistency beats speed.
Gate delay minutes per turn reveals how much time bleeds after the scheduled departure. The top 75th-percentile short-haul airlines run an average ground delay of 8 minutes. Below that threshold, the propagation effect stays manageable. Above it, knock-on delays cascade through the rest of the day.
Equipment cycle time is the KPI most operators don’t track yet but should. How long does a GPU take from the moment it’s disconnected at one gate until it’s connected at the next? If the answer is “we don’t know,” that’s the exact gap asset tracking closes.
Injuries per 1,000 departures serves as the safety proxy. At a global average of 9 per 1,000, every turnaround optimization program should demonstrate that faster turns aren’t coming at the cost of ramp worker safety. The two should move in the same direction: faster because smarter, not faster because rushed.
If your GSE pool goes invisible between tasks, if ramp agents spend minutes locating equipment that should already be in position, that’s where the turnaround minutes are hiding. We’re at info@datanetiot.com or +1 508 292 2210 if you want to talk through what ramp-wide asset visibility looks like for your operation.
Frequently Asked Questions
What is a good aircraft turnaround time?
It depends on the operation. Airbus cites 35 to 45 minutes for a full-service A320 turnaround. Low-cost carriers like Ryanair target 25 minutes through deliberate design tradeoffs (no seatback pockets, dual airstairs, strict baggage limits). Among US majors, Southwest’s 59-minute actual is the shortest. “Good” is less about the number and more about low variance between planned and actual.
How much does each minute of turnaround time cost?
EUROCONTROL puts ground at-gate delay cost at EUR 17.78 per minute. Airlines for America reports $100.76 per minute for US passenger-airline block time. The right figure for your operation depends on aircraft type, route economics, and connection sensitivity, but the order of magnitude is consistent across the industry.
Can AI reduce turnaround delays, or is it vendor hype?
Independent data supports the claims. Assaia’s 2025 report documents a 25% departure delay reduction across 450,000 AI-enabled turnarounds at 15 airports. Academic research from MDPI (2026) independently confirms a 2.3% utilization gain and $1.34M annual benefit per aircraft. AI computer vision works best when the physical asset layer underneath it is also visible.
Why do newer aircraft need longer turnarounds?
A320neo and 737 MAX aircraft require additional engine cool-down time on the ground compared to their predecessors. Despite better fuel efficiency in flight, they demand longer turnaround windows. Airlines upgrading fleets should recalibrate turn targets rather than assuming newer airframes mean faster ramp operations.
What role does IoT play in turnaround optimization?
IoT asset tracking provides real-time location data for GSE, ULDs, stairs, GPUs, and other ramp equipment throughout their full operational cycle. This closes the visibility gap that turnaround management software alone cannot cover: knowing not just what task should happen when, but whether the equipment needed is actually available and in position.
How should we measure turnaround performance?
Planned-versus-actual variance matters more than average turnaround time. Pair it with gate delay minutes per turn, equipment cycle time (how fast assets move between assignments), and injuries per 1,000 departures as a safety check. Together, these KPIs capture efficiency, predictability, and safety in a single operational view.


 +1 508 292 2210
