

When people ask about the cost of aircraft maintenance delays, they expect a clean number. There isn’t one. A two-hour AOG on a narrowbody might run $20,000. The same event on a widebody during peak season, with cascading schedule impact, can blow past $150,000 per hour.
If you run Tech Ops, manage MRO planning, or build financial models for an airline, you already feel these numbers every time an unscheduled removal hits your morning brief. The real question isn’t whether maintenance delays are expensive. It’s where the money goes, why it’s accelerating faster than any other controllable cost, and what actually moves the needle.
What a Maintenance Delay Costs Per Minute
Start with the operating baseline. In 2024, U.S. passenger carriers spent $100.76 per block minute of aircraft time. Maintenance alone accounted for $18.30 of that, up 8.4% year-over-year. That makes it the fastest-rising controllable line item in the cost structure, outpacing labor growth (7.8%) and running counter to fuel, which dropped 11.3%.
| Cost Category | $/Block Minute (2024) | YoY Change |
|---|---|---|
| Labor | $35.23 | +7.8% |
| Fuel | $33.06 | -11.3% |
| Maintenance | $18.30 | +8.4% |
| Aircraft Ownership | $10.19 | +2.2% |
| Other | $3.98 | -0.5% |
| Total | $100.76 |
Those are scheduled, predictable costs. When a maintenance event goes unscheduled and the aircraft stops flying, the math changes fast. Boeing’s industry benchmark puts AOG cost between $10,000 and $150,000 per hour. Air Cargo Week’s detailed breakdown shows how that number escalates with duration:
| AOG Duration | Estimated Total Cost |
|---|---|
| Single day | $50,000 to $150,000 |
| 2 to 3 days | $150,000 to $600,000 |
| 3+ days | $600,000 to $2,000,000+ |
Add it all up across the U.S. network and total annual delay cost sits around $33 billion, using a $47/hour passenger time value. Maintenance is one of the largest single controllable slices of that figure, though no public source isolates a clean national maintenance-only dollar number. The DOT classifies it as “controllable,” which means the airline owns the cost. No sharing the blame with ATC or weather.
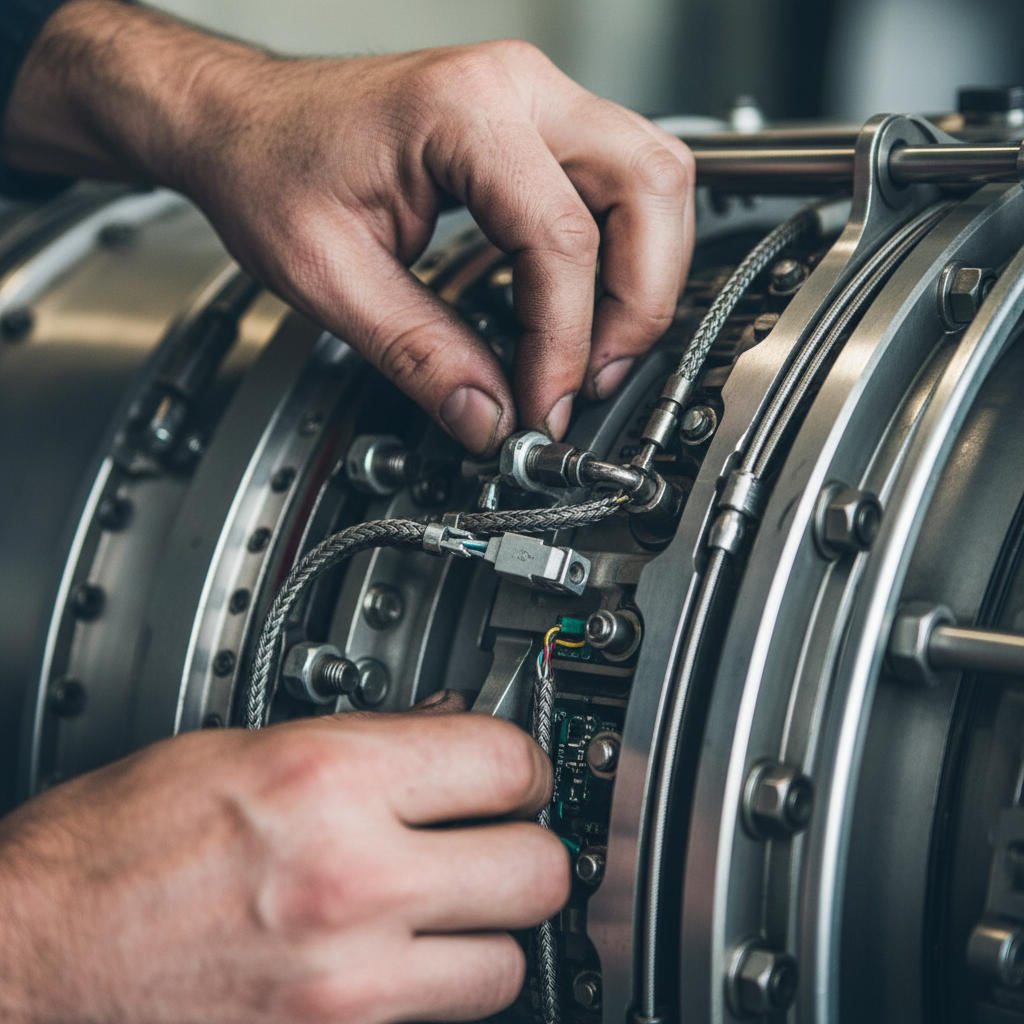
Anatomy of an AOG Bill
The hourly figures above are aggregates. What actually shows up on the invoice?
Engine repairs dominate. A single engine event ranges from $200,000 to over $2 million depending on engine family and severity. That alone can exceed what most operators budget per aircraft per quarter for scheduled maintenance.
Emergency logistics are the silent killer. An Onboard Courier (OBC) shipment for a critical part runs $5,000 to $30,000. Next Flight Out services add $15 to $50 per kilogram plus surcharges. If the aircraft needs repositioning to a maintenance base, ferry flights cost $15,000 to $75,000+. AOG mechanic overtime adds another $5,000 to $25,000 per incident.
Passenger compensation is the line item that gets executive attention. In the U.S., the 2024 DOT rule streamlines refunds for cancellations and significant delays, with compensation reaching up to $500 per ticket for delays over 12 hours and up to $10,000 per person for cancellation. Under EU261/2004, it’s up to EUR 600 per passenger. Multiply by 180 seats on a narrowbody and the math gets uncomfortable fast.
Lost revenue is the number that doesn’t appear on any invoice but hurts the most. An aircraft sitting on the ramp generates zero revenue. A widebody on a long-haul route can produce $100,000+ in daily revenue. Every hour grounded is money that doesn’t come back.
Here’s the detail that changes how you think about this: an unplanned removal costs 30 to 50% more than a planned one. Same part, same repair, but emergency logistics, expedited shipping, and out-of-route labor inflate the bill by a third to a half. The problem isn’t the wrench turning. It’s the scramble to get the wrench, the part, and the technician to the same place at the same time.
Why Maintenance Delays Cascade Worse Than Weather
Weather grounds fleets. Everyone pauses. Schedules reset together. Maintenance delays don’t work that way.
When a single aircraft goes AOG at a gate, the gate return and ATC flight-plan re-issuance alone take a minimum of 45 minutes, and that’s before anyone diagnoses the actual problem. Meanwhile, the rest of the network keeps moving. The three or four downstream flights on that aircraft’s rotation don’t get a weather hold. They get canceled, reboked, or flown with a swap aircraft (if one exists nearby).
Crew duty limits compound the damage. A 90-minute maintenance delay at 4 PM can time out a crew by 10 PM, canceling the final leg of the day. That’s not a maintenance cost in the traditional sense, but there’s no other place to attribute it.
EUROCONTROL’s standard inputs quantify this at the network level: tactical delay costs range from EUR 45 per minute at the gate for short delays to EUR 212 per minute in cruise for long ones. About 90% of delays fall under 30 minutes, which means most of the financial damage happens in high-frequency, moderate-severity events. Not the spectacular grounding. The persistent, everyday bleed.
The Incidents That Rewrote the Cost Equation
A few events from recent years put these per-hour numbers into context at scale.
Pratt & Whitney PW1100G GTF: 350 Aircraft Grounded for Years
A contamination problem traced to powdered metal in engines manufactured between late 2015 and mid-2021 forced recall of 3,000 PW1100G engines, each requiring 250 to 300 shop days for inspection. RTX took a $3 billion write-down. Pratt expects an average of 350 A320neo-family aircraft grounded through 2026, with a peak of 650 simultaneous groundings in the first half of 2024. Wizz Air secured EUR 300 million in compensation and still had to spend EUR 39 million on wet-leased replacement aircraft. A single PW1100G AOG scenario totals over $600,000 when you add logistics, lost revenue, and passenger disruption.
Alaska Airlines Flight 1282: Four Bolts, $160 Million
On January 5, 2024, a door plug separated from a 737 MAX 9 after four securing bolts were never reinstalled during manufacture. The FAA grounded all MAX 9s with mid-cabin door plugs the next day. Alaska only returned them to service on January 26, after a 19-day inspection cycle. Boeing paid approximately $160 million in initial compensation. The cause was a manufacturing process failure, not an in-service maintenance lapse. But the cost structure was identical to an AOG: grounded aircraft, lost revenue, passenger disruption, regulatory response.
Boeing 737 MAX Grounding: $20.7 Billion and Counting
The 20-month MAX grounding following the Lion Air and Ethiopian crashes remains the most expensive maintenance-adjacent event in commercial aviation history. Boeing’s direct costs reached $20.7 billion: $8.6 billion in customer compensation, $5 billion in production costs, $6.3 billion in program cost increases, plus training, software, and storage. Indirect losses from approximately 1,200 canceled orders exceeded $60 billion. American Airlines alone reported a $140 million pre-tax hit in Q3 2019 from 9,475 canceled flights in just one quarter.
For perspective on disruption scale beyond mechanical failures: Southwest’s December 2022 meltdown cost $725 to $825 million in operating losses plus a $140 million DOT fine. Delta’s July 2024 CrowdStrike-triggered outage canceled 7,000+ flights and cost roughly $550 million. The through-line: operational disruption in aviation consistently produces nine-figure losses, regardless of whether the root cause sits in a maintenance bay, a scheduling system, or a third-party software update.
Three Cost Drivers Getting Worse, Not Better
The per-minute and per-event costs above aren’t static. Three structural forces are pushing them higher.
Aging fleets
Maintenance cost per flight hour increases roughly 8% for every additional year of fleet age. In an aircraft’s first six years, per-aircraft maintenance spending grows 17.6% annually. OEM delivery delays (down 30% from the 2018 peak of 1,813 aircraft to 1,254 in 2024) mean airlines are flying older metal longer than planned. Older aircraft don’t just cost more to maintain. They generate more unscheduled events, which carry that 30-50% cost premium.
Workforce shortage
Boeing forecasts a need for 716,000 maintenance technicians by 2042, with a likely 20% shortfall by 2028. New technicians take two to five years to reach full productivity. Frontline attrition ran 5 to 11.5% in 2023, and MRO labor costs jumped 7.3% that year. When you can’t staff the line fast enough, unscheduled events take longer to resolve. Longer resolution means higher AOG cost per incident.
Fragile supply chains
The PW1100G crisis demonstrated what happens when a critical engine family hits a systemic quality issue: 250 to 300 shop days per engine, with no shortcut. But the broader picture is just as concerning. Part deliveries have fallen 30% short of recent peaks. The Aeronautical Repair Station Association’s 2026 assessment identifies raw material shortages, geopolitical volatility, and trade uncertainty as the largest structural constraints on MRO capacity expansion. Global MRO spend hit $136 billion in 2025, up 8% year-over-year. It’s heading toward $193 billion by the end of the decade. The industry is spending more and still falling behind.
What Actually Brings These Numbers Down
Three levers have real, documented impact on maintenance delay costs. A fourth one gets far less attention than it deserves.
Predictive maintenance is the most cited solution for good reason. Research published in 2026 shows AI-driven predictive maintenance can cut maintenance costs 12 to 18% and unplanned downtime 15 to 20%. Those numbers are meaningful, but they come with a caveat I’ll get to in a moment.
Digital twins are producing measurable results at scale. GE Aerospace’s digital twin engine models flag maintenance needs 60% earlier than traditional monitoring, with a 45% improvement in detection rates and roughly 50% fewer false alerts. Lufthansa Technik’s AVIATAR platform and Delta TechOps’ recent adoption of Trax eMRO software (digitizing workflows for 6,000+ technicians) point the same direction: moving from paper-based, reactive processes to data-driven, predictive ones.
Here’s the caveat. Oliver Wyman’s 2024 MRO survey found that 85% of airline operators invest in AI. But approximately 80% of the entire industry reports seeing little value from those investments so far. Buying the tool isn’t the same as operationalizing it. The gap between purchase and payoff is where most operators are stuck right now.
Which brings me to the fourth lever, the one that gets overlooked: physical asset visibility.
Most AOG time isn’t spent turning wrenches. It’s spent finding the right part, confirming its serviceability, getting it shipped, and locating the ground support equipment needed to install it. If your rotable inventory, tooling, and GSE aren’t tracked in real time, every AOG event takes longer than it should. Not by minutes. By hours. At $10,000 to $150,000 per hour, that’s not a logistics inconvenience. It’s a financial leak. Improving aircraft maintenance efficiency with tracking directly addresses this visibility gap.
This is the specific problem we solve at Datanet. Real-time tracking of aviation assets (parts, containers, GSE, tooling) using devices built for the operational environment, including DO-160 certified hardware for airfreight. Not shipment tracking that ends at the dock. Asset tracking that follows the asset through the full cycle: deployment, dwell, return, reuse. When a technician needs a part at 2 AM, the difference between “we know exactly where it is” and “let me check three systems and call the warehouse” is the difference between a two-hour AOG and a twelve-hour one.
The next 12 to 24 months will separate operators who fuse predictive analytics with real-time physical visibility from those still running spreadsheets and phone calls. The cost data is clear. The tools exist. The question is execution speed.
If your maintenance operation is leaking hours because assets are invisible between scheduled checks, that’s the gap worth closing first. Talk to our team or reach us at info@datanetiot.com.
Frequently Asked Questions
What does AOG mean and why does it cost so much?
AOG stands for Aircraft on Ground, an unscheduled condition where an aircraft can’t fly due to a technical or maintenance issue. It costs so much because the aircraft generates zero revenue while grounded, emergency logistics carry steep premiums, and the delay cascades into downstream flights, crew scheduling, and passenger rebooking. Boeing estimates the range at $10,000 to $150,000 per hour depending on aircraft type and route.
How much does maintenance cost per block minute for U.S. airlines?
In 2024, maintenance averaged $18.30 per block minute for U.S. passenger carriers, representing about 18% of the $100.76 total per-minute operating cost. It rose 8.4% year-over-year, making it the fastest-growing controllable cost category, ahead of both labor and fuel growth rates.
Why is unscheduled maintenance so much more expensive than scheduled?
Unplanned removals cost 30 to 50% more than planned ones. The part and repair are identical, but emergency logistics (expedited shipping, onboard couriers, ferry flights) and out-of-route labor inflate the bill. Planned maintenance lets you position parts and technicians in advance, eliminating the cost of the scramble.
Can predictive maintenance really reduce AOG costs?
Studies show AI-driven predictive maintenance can cut maintenance costs 12 to 18% and unplanned downtime 15 to 20%. GE Aerospace’s digital twins flag problems 60% earlier. However, Oliver Wyman’s 2024 survey found that roughly 80% of the industry reports seeing little value from AI investments so far, suggesting that implementation quality matters as much as the technology itself.
What is the biggest maintenance delay cost driver getting worse?
Fleet aging. Maintenance cost per flight hour increases approximately 8% for every additional year of average fleet age. With OEM delivery shortfalls running 30% below 2018 peaks, airlines are flying older aircraft longer than planned, compounding both scheduled and unscheduled maintenance costs simultaneously.
How does asset tracking reduce maintenance delay costs?
A significant portion of AOG time is spent locating parts, confirming availability, and arranging transport rather than performing the actual repair. Real-time asset tracking of rotable inventory, tooling, and ground support equipment compresses that search-and-ship window from hours to minutes, directly shortening AOG duration and reducing the per-event cost.


 +1 508 292 2210

2 Responses