

A five-cent tag, a smartphone camera, and a cloud database. That’s all a barcode asset tracking system requires. Barcodes are scanned over 10 billion times a day worldwide, and barcode technology holds a 25.33% share of the global asset tracking market, the largest of any single tracking method. If you’re evaluating whether barcode tracking fits your operation, you’re looking at the most accessible entry point into asset visibility that money can buy.
But “accessible” doesn’t mean “universal.” I’ve spent 15+ years deploying tracking systems for aviation, freight and industrial operations, and barcode tracking has earned a permanent place in the toolkit. It has also failed quietly when pushed into use cases it was never designed for. This guide covers both: where a barcode asset tracking system delivers measurable ROI, and where it stops working.
What Is a Barcode Asset Tracking System?
A barcode asset tracking system manages physical assets by attaching a unique machine-readable label (a 1D barcode, QR code, or Data Matrix) to each item, then using scanners or smartphone cameras to log every scan event in a centralized database. Each scan creates a timestamped record: which asset, who scanned it, where, and when.
The system relies on three components:
- Barcode labels, printed on polyester, aluminum, or standard paper depending on the operating environment
- Scanners: dedicated handheld hardware or smartphone cameras running a scanning app
- Cloud-based software that stores, queries, and reports on every scan event
That simplicity is the point. Unlike RFID or GPS, barcode tracking requires no battery in the tag, no radio infrastructure, and no specialized reader. Any smartphone manufactured in the last decade can do the job. The barcode itself was first scanned commercially in 1974 at a Marsh supermarket in Troy, Ohio: a pack of Wrigley’s Juicy Fruit gum. Fifty-two years later, the same basic primitive (unique visual pattern, scanner, database) runs asset tracking for hospitals, manufacturers, schools and construction sites.
How Barcode Asset Tracking Works
Implementation follows a straightforward six-step process:
- Inventory your assets by type and serial number.
- Choose a barcode format (2D is the default recommendation in 2026).
- Select cloud-based tracking software with a mobile app.
- Generate and print labels using durable materials suited to your environment.
- Apply labels in consistent, accessible locations on each asset.
- Configure scanning hardware: dedicated scanners, mobile computers, or just phones.
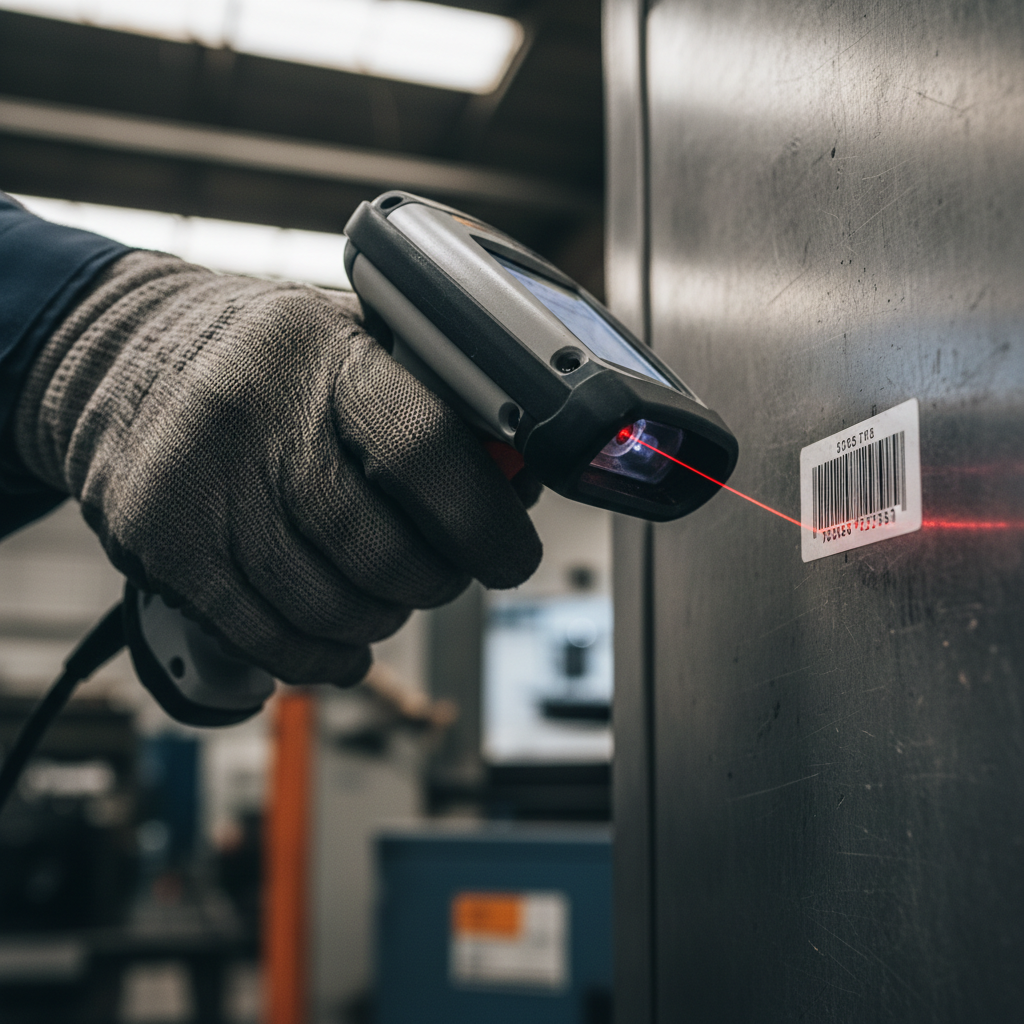
At runtime, the loop is even simpler. A worker scans the barcode. The scanner decodes the visual pattern into a string of characters. That string hits the cloud database, which updates the asset record with the new location, handler, and timestamp. The whole cycle takes under 10 seconds per asset when the software is configured properly.
Most vendor guides stop here. The real question is what that scan record actually tells you. A barcode scan confirms presence: this asset was at this location at this moment. It does not tell you where the asset is right now, or where it’s been between scans. That distinction matters more than most barcode software companies will admit, and we’ll come back to it.
1D vs 2D Barcodes: Which Format Belongs on Your Assets?
Not all barcodes are equal. The format you choose affects how much data the tag carries, how well it survives damage, and whether your team needs dedicated hardware or can rely on smartphones.
| Dimension | 1D (Linear) | 2D (Matrix) |
|---|---|---|
| Examples | Code 128, Code 39, UPC/EAN | QR Code, Data Matrix, PDF417 |
| Data capacity | 25 to 100 characters | 2,000 to 7,000 characters |
| Damage tolerance | Low (a single scratch across the bars kills readability) | High (built-in error correction handles up to 30% damage) |
| Smartphone readable | Requires a scanning app with linear support | Native camera app on most phones |
| Best fit | Simple asset IDs, low-data shelf labels | Field assets, harsh environments, rich data needs |
The industry direction is clear. GS1 Sunrise 2027 is the global initiative to shift from 1D to 2D barcodes at point of sale, with pilots running in 48 countries and companies like Procter & Gamble among the named participants. Once 90% of POS scanners worldwide can read 2D codes, the linear barcode becomes optional in retail. For asset tracking, the migration is even more compelling: a 2D barcode stores 20 to 70 times more data than a 1D label, tolerates partial physical damage, and reads natively from any modern phone camera.
If you’re labeling assets for the first time in 2026, go 2D. QR or Data Matrix. You avoid a forced re-labeling cycle when the rest of the industry finishes the transition.
Five Industries Where Barcode Tracking Earns Its Keep
A barcode asset tracking system isn’t theoretical. It generates measurable returns in specific operational contexts. Here are five where the data is clearest.
Healthcare
U.S. hospitals lose approximately $4,000 per bed per year to untracked or stolen equipment: infusion pumps, wheelchairs, portable monitors. UMC Utrecht, a Dutch academic hospital, deployed an indoor tracking solution and reported both financial savings from reclaiming mislaid equipment and faster device location that translated into better patient care. For most hospitals, barcode tracking is the first rung of a broader healthcare asset tracking strategy. They tag every mobile device, scan during room audits, and flag missing items before the loss compounds. Larger health systems layer RFID or BLE on top for real-time location, but the barcode layer stays as the universal baseline.
Manufacturing
QR-code-based asset updates take under 10 seconds on a factory floor using nothing but a smartphone. No specialized hardware. For manufacturers, barcode tracking underpins work-order management, preventive maintenance schedules, and inventory shrinkage reduction. But scanning alone rarely delivers full manufacturing asset visibility on its own. The ROI math is simple: every minute a technician spends searching for a tool or part is a minute that produces nothing.
Education and IT Fleets
Schools and universities track laptops, projectors, microscopes, and lab equipment with QR tags in consistent spots: back of laptops, side of instruments, inside book covers. This works well for campuses with a few thousand assets and tightly controlled environments. It starts to break above 5,000 mobile assets, where universities report “the barcode problem”: tags fall off, line-of-sight scanning is too slow, and one-at-a-time auditing doesn’t scale. The common remedy is layering passive RFID over the existing barcode infrastructure rather than replacing it.
AV and Equipment Rental
Broadcast studios, production companies, and AV rental houses use barcode tags to manage check-in/check-out workflows for cameras, sound mixers, and projectors. The value isn’t the scanning technology itself. It’s the software workflow behind rental equipment tracking: overdue notifications, equipment history visible to the entire crew, and an unbroken chain of custody for gear worth tens of thousands per unit.
Construction
Construction operations combine barcode scanning for tool cribs and static parts inventory with GPS telematics for mobile heavy equipment. This hybrid model is the norm across fleet-heavy industries. One tracking method for items that stay on site. Another for items that move between sites. The barcode layer handles the volume. The GPS layer handles the value.
Barcode vs RFID vs GPS: Choosing the Right Layer
Most “barcode vs RFID” articles on the internet pick a side. That’s not how real operations work. Mature asset programs combine barcodes, RFID, and GPS/cellular in layers, choosing each technology for the assets and conditions it fits best.
| Dimension | Barcode | RFID | GPS / Cellular IoT |
|---|---|---|---|
| Cost per tag | ~$0.05 | $1 to $30+ | $20 to $150+ (active device) |
| Line of sight required | Yes | No | No |
| Scanning speed | One item at a time | Bulk (simultaneous) | Automatic (no manual scan) |
| Location data | Only at the moment of scan | Zone-level (reader proximity) | Continuous GPS coordinates |
| Battery in tag | None | Passive: none / Active: yes | Yes |
| Range | Visual distance (~1 m) | Up to 10 m passive, 100 m active | Global (cellular coverage) |
| Best fit | Static, low-cost, accessible assets | Dense inventory, dock doors, high-mobility indoor | Assets in transit, between facilities, or assigned to third parties |
The pattern I see in the field again and again: barcodes handle about 80% of an operation’s assets (the cheap, durable, mostly-stationary items). RFID covers maybe 15% (the fast-moving items in warehouses and hospitals, where warehouse asset tracking often layers multiple technologies). GPS/cellular IoT covers the remaining 5% by count, but often 50%+ by value, because those are the high-cost assets that leave the building: containers, ground support equipment, MRO tooling, fleet vehicles.
The cost gap is the deciding factor for most organizations starting out. At five cents per tag versus one to thirty dollars for RFID, the math favors barcodes for any operation with hundreds of assets and a limited first-year budget. Start there. Upgrade selectively when the data tells you which specific assets need more visibility.
What a Barcode Asset Tracking System Costs
Pricing in this market is fragmented. Enterprise vendors require custom quotes. SMB platforms charge per user per month. Beyond the operational cost, these assets also carry a financial dimension that fixed asset management handles on the balance sheet. Understanding the total cost of ownership of asset tracking requires looking beyond sticker prices at the general picture:
- Barcode labels: approximately $0.05 each for standard polyester. Aluminum tags for outdoor or harsh environments run $0.50 to $2.00.
- Label printers: $200 to $800 for a thermal printer that produces asset labels in-house.
- Scanners: $0 if you use smartphones. $150 to $1,500 for dedicated handheld scanners (rugged warehouse models sit at the high end).
- Software: SaaS platforms range from free tiers (limited to 250 assets on some platforms) to $50 to $150+ per user per month for enterprise features. Several vendors sell on annual contracts bundled with implementation support.
- Implementation timeline: 2 to 8 weeks for an SMB deployment. 3 to 6 months for enterprise healthcare or manufacturing rollouts, depending on asset count and existing system integration.
The cost people forget: re-labeling. In harsh environments (outdoor equipment, chemical exposure, high UV), barcode labels degrade. Budget for a 15 to 25% annual replacement rate on exposed labels. If that number sounds expensive, invest in aluminum or ceramic tags upfront. They cost more per unit but survive years instead of months.
Industry projections suggest 40 to 60% operational cost savings for mature barcode/RFID-hybrid tracking programs. The largest single ROI driver in healthcare is reclaiming the $4,000-per-bed annual equipment loss. In manufacturing, it’s reduced downtime from faster tool and part location, which is why serious operations pair scanning data with asset utilization tracking to see how hard each asset actually works.
Where Barcode Tracking Hits a Wall
This is the section most barcode vendor articles skip. Barcodes have structural limits, and understanding them before you commit saves you from the slow frustration of a system that works in the stockroom but fails in the field.
Line of sight is non-negotiable. Every asset must be physically found and individually scanned. If an item is behind a shelf, inside a shipping crate, or across a large warehouse, it doesn’t exist in the system until someone walks to it and captures the tag. There is no passive detection, no automatic logging.
Physical damage kills readability. Scratches, chemicals, UV radiation, moisture, grease. A 1D barcode with a single scratch across the bars is unreadable. 2D codes handle partial damage better (error correction can survive up to 30% loss), but even they have limits in heavy industrial environments. AI-powered scanning is improving accuracy on degraded labels, but the barcode must still be physically present and mostly intact.
One-at-a-time scanning caps throughput. Auditing 200 IT assets in a server room takes one person roughly an hour. Auditing 5,000 mobile laptops across a university campus takes a team working for days. This is why RFID (which reads dozens of tags simultaneously, through boxes and bags) gets layered on top once asset counts pass certain thresholds.
No data exists between scans. This is the limit I encounter most in my work. A barcode tells you that Asset #4471 was at Warehouse B at 9:17 AM on Tuesday. It tells you nothing about where the asset is right now, where it went after that scan, or whether it ever left the building. For assets that stay inside one facility, periodic scan records are often enough. For assets in transit, cycling between sites, assigned to field crews, or loaned to third parties, the gap between scans is exactly where visibility collapses.
That gap is the territory of GPS/cellular asset trackers: devices that report location continuously, whether the asset is on a truck, at a vendor’s MRO shop, or sitting in a yard three time zones away. When your barcode tracking system works perfectly inside four walls but the asset pool keeps disappearing after handoff, the problem isn’t the barcodes. It’s the architecture, which is exactly the challenge enterprise asset tracking is built to solve.
Making Implementation Stick
Most barcode tracking projects don’t fail because of the technology. They fail because adoption crumbles in the first 90 days. The scanner sits in a drawer. The software goes un-synced. The labels peel off and nobody replaces them. Following proven asset tracking best practices and a phased asset tracking implementation guide is what separates the deployments that stick from the ones that quietly decay.
Here’s what I’ve seen work in deployments that lasted:
Pick your label material for the worst conditions the asset will face, not the average. Indoor IT equipment gets standard polyester. Anything that goes outdoors, near chemicals, or through temperature swings needs aluminum or ceramic tags. Paying $1.50 per tag beats re-labeling 2,000 assets after six months of UV exposure.
Place every label in the same spot on the same asset type. Back of laptops. Right side of tool handles. Lower-left corner of equipment frames. Consistency eliminates the “where’s the barcode?” friction that slows scanning and frustrates floor staff.
Keep the scan under 10 seconds per asset. If the workflow involves opening an app, waiting for it to load, scanning, confirming, tapping three buttons, then waiting for sync, it’s dead on arrival. The software should be: aim phone, scan, done. If your chosen platform can’t deliver that speed, switch platforms before you label a single asset.
Set an audit cadence and enforce it. Monthly for high-value assets (medical equipment, IT fleet). Quarterly for low-value (furniture, hand tools). The audit rhythm is the habit that keeps the database accurate. Without it, the system decays into a one-time inventory snapshot that’s outdated by week four.
Know when barcodes aren’t the right layer. If assets routinely move between facilities, cross company boundaries, or leave your physical premises, a barcode system will tell you when they left but not where they went. That’s the point to consider GPS/cellular trackers that report location automatically. Not as a barcode replacement, but as a second layer for the assets that need continuous visibility.
At Datanet, we work with operations that have already solved the barcode layer and need that continuous visibility for what moves beyond four walls: reusable containers, ground support equipment, tooling in MRO loops, fleet assets cycling through third-party facilities. If that gap sounds familiar, take a look at the asset trackers we deploy or reach out to our team. We’ll tell you honestly whether you need us or not.
Frequently Asked Questions
What is a barcode asset tracking system?
A barcode asset tracking system assigns a unique machine-readable label to each physical asset and uses scanners (or smartphone cameras) to log scan events in a cloud database. Each scan records the asset identity, the scanner, the location, and the timestamp. The three core components are barcode labels, scanning hardware, and tracking software.
Is barcode or RFID better for asset tracking?
Barcode is better when cost per tag matters most (~$0.05 vs $1 to $30+ for RFID), assets are physically accessible, and one-at-a-time throughput is acceptable. RFID wins when you need bulk scanning without line of sight or high-speed dock-door receiving. Most mature operations use both in layers: barcodes for the majority of assets, RFID for the high-mobility subset.
How much does a barcode asset tracking system cost?
Tags cost about $0.05 (polyester) to $2.00 (aluminum). Dedicated scanners run $150 to $1,500, though smartphones work at no additional hardware cost. Software subscriptions range from free (limited asset counts) to $50 to $150+ per user per month. SMB implementations typically launch in 2 to 8 weeks.
What’s the difference between 1D and 2D barcodes?
1D (linear) barcodes store 25 to 100 characters and are fragile if scratched. 2D barcodes (QR Code, Data Matrix) store 2,000 to 7,000 characters, tolerate partial damage via built-in error correction, and scan natively from any smartphone camera. For asset tracking in 2026, 2D is the standard recommendation.
Can barcode tracking tell me where an asset is right now?
No. Barcode tracking records location at the moment of each scan, not between scans. If an asset was scanned in Warehouse B at 9 AM but isn’t scanned again until Thursday, its location in between is unknown. Continuous, real-time location requires GPS or cellular IoT devices.
What is GS1 Sunrise 2027?
GS1 Sunrise 2027 is the global initiative to transition retail from 1D (UPC/EAN) to 2D barcodes at point of sale, with pilots running in 48 countries. Once 90% of POS scanners can read 2D codes, linear barcodes become optional. For asset tracking, the practical takeaway is simple: label with 2D formats now to avoid a forced re-labeling cycle later.






 +1 508 292 2210

2 Responses