

US scheduled airlines spent $3.74 billion on fuel in December 2025 alone. That number gets the boardroom’s attention every quarter. And fuel is, without question, the loudest line item in commercial aviation.
But aviation operational efficiency is not a fuel problem. It is a stack problem. Fuel sits on top, visible and urgent. Underneath: maintenance predictions, turnaround coordination, crew scheduling, ATC infrastructure, and (most neglected of all) the physical assets nobody can locate when they need them most.
The operators pulling ahead right now aren’t just optimizing descent profiles. They’re measuring every layer of that stack, down to the ground support equipment and ULD containers that most carriers still manage with radio calls and spreadsheets.
Here’s what the full efficiency stack looks like, where proven ROI already exists, and where the blind spots persist.
What Aviation Operational Efficiency Actually Means
Aviation operational efficiency is the practice of extracting more output (seat miles, on-time departures, gate turns) from fewer inputs (fuel, labor, equipment, time) across every phase of airline and airport operations. It spans flight planning, ground handling, maintenance, crew management, and air traffic flow as a single interconnected system.
The instinct is to think of it as a cockpit concern. It isn’t. Industry research frames it as a “networked approach” that breaks silos between flight crew, maintenance technicians, and ground staff. When the wall between the IT department and the hangar stays intact, efficiency gains in one domain get consumed by waste in another.
Four interlocking layers define the stack:
- Flight planning and execution: fuel load, route optimization, descent profiles, weight and balance.
- Predictive maintenance and MRO: sensor analytics, failure forecasting, parts availability.
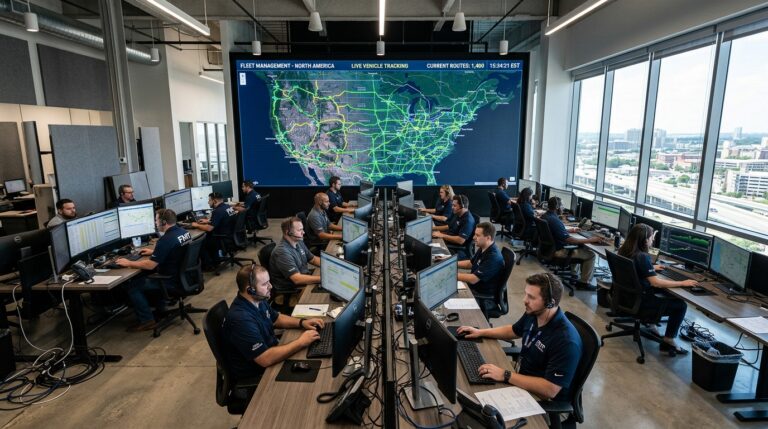
- Operations Control Center (OCC): live fleet monitoring, disruption recovery, crew dispatch.
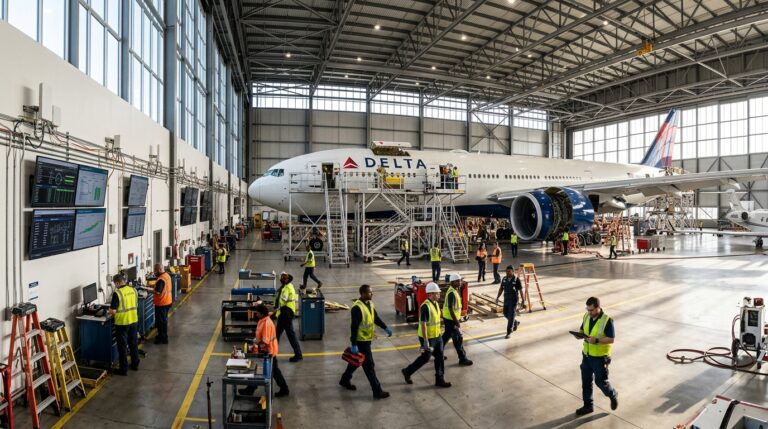
- Ground operations and asset coordination: turnaround management, gate scheduling, equipment positioning, asset tracking.
Each layer depends on the one below it. A flawless fuel plan achieves nothing if the aircraft sits waiting for a part nobody can find.
The Fuel Layer: Highly Optimized, Rapidly Decelerating
Fuel accounts for 25 to 30 percent of airline operating costs in most regions. It got optimized first, and the results are genuine.
easyJet’s Descent Profile Optimization program, deployed across 228 aircraft, delivered $9.3 million in validated fuel savings at an average of 25 kg per flight. When crews used managed-descent mode more than 60% of descent time, that number rose to 30 kg per flight. OpenAirlines’ SkyBreathe platform, now active at over 80 airlines, reports up to 5% per-flight fuel reduction; its customer base saved $150 million and avoided 590,000 tonnes of CO2 in a single year. GE Aerospace’s FlightPulse took a different route: hand the data directly to the pilot. At Qantas, 2,715 pilots engaged with the tool and saved 5.71 million kg of fuel.
Impressive. But the curve is flattening.
Annual fuel-efficiency gains slowed from roughly 2.4% per year in the 2000s to about 1.9% in the 2010s. IATA’s 2026 brief warns that efficiency improvements may have dropped to 0.3% by 2025. The easy wins are taken. Every additional kilogram of fuel is harder and more expensive to find.
When the air-side curve flattens, the ground side is where the next meaningful savings live.
Predictive Maintenance: The 10:1 ROI Reshaping MRO
An aircraft parked unscheduled costs between $10,000 and $150,000 per hour, depending on aircraft type and airline. That is the price of AOG (Aircraft on Ground), and it turns maintenance from a cost center into a strategic weapon.
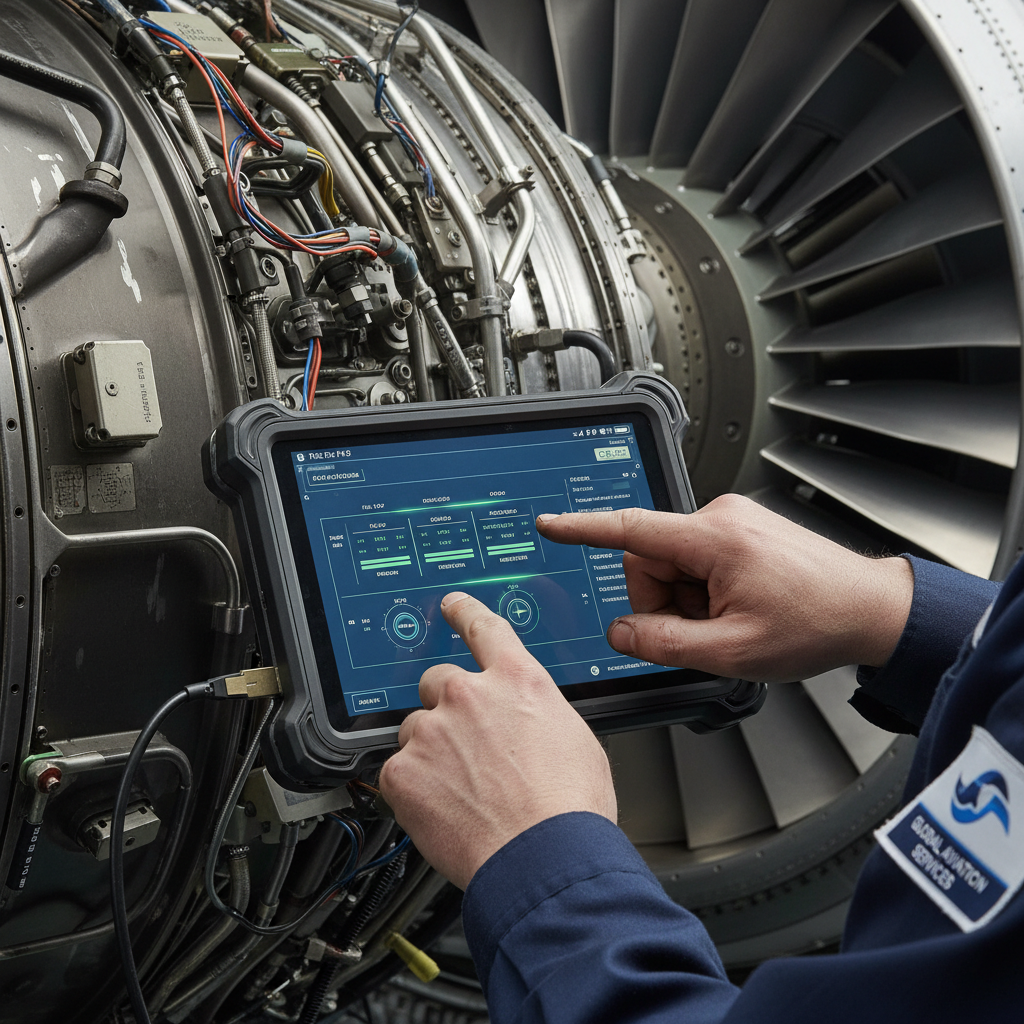
Predictive maintenance (PdM) replaces calendar-based part swaps and post-failure scrambles with sensor-driven forecasting. Industry research shows an average 10:1 ROI, a 25 to 40 percent reduction in maintenance costs, and up to 50 percent decrease in unplanned downtime.
Delta TechOps sets the benchmark. Their APEX platform reports over 95% accuracy on pending-failure predictions. That accuracy compresses turnaround time, improves gate utilization, and breaks the chain of cascading delays a single AOG event can trigger across a network. Lufthansa Technik confirmed it would replicate the APEX model, calling it a pattern that “is going to be copied” across the industry.
But there’s a dependency that rarely makes the case study. You can predict a failure perfectly and still lose 48 hours if the replacement part sits in a warehouse three countries away with no real-time location data. Perfect prediction without parts visibility is just a more precise way to watch an aircraft sit idle.
That is an asset tracking problem, not a maintenance problem.
Turnaround Time: Where Minutes Convert to Millions
Industry turnaround benchmarks from 2025, drawing on analysis of over 450,000 airport turns, show that operators using apron analytics posted a 5% increase in turns per stand and a 25% reduction in median departure delays. For a busy hub, that translates to tens of millions of dollars recovered annually.
The stakes are amplified by the 80/20 slot rule: an airline must use its assigned slot at a congested airport at least 80% of the time during a season, or risk losing it. A blown turnaround doesn’t just delay one flight. It can cost the airline its gate position for an entire future season.
Video-based apron analytics do well at measuring human workflow. Fueling start times. Catering completion. Boarding elapsed minutes. Pushback readiness.
What those platforms typically don’t capture is where the physical assets are. The GPU that should be at gate B7 is still at C12. The ULD offloaded an hour ago hasn’t returned to the pool. The deicing cart is somewhere between two terminals and nobody logged it.
These aren’t edge cases. They are the daily texture of most airport ramps. And they’re invisible to timing-based analytics because those systems measure when, not where.
The Layer Most Operators Under-Invest In: Physical Asset Visibility
Here is where I see the biggest disconnect between what the industry talks about and what actually causes friction on the ground.
Airlines and MROs spend aggressively on fuel software, predictive maintenance, and turnaround analytics. Good investments, well documented ROI. But the physical assets moving between stations, airlines, MRO shops, and countries remain shockingly opaque.
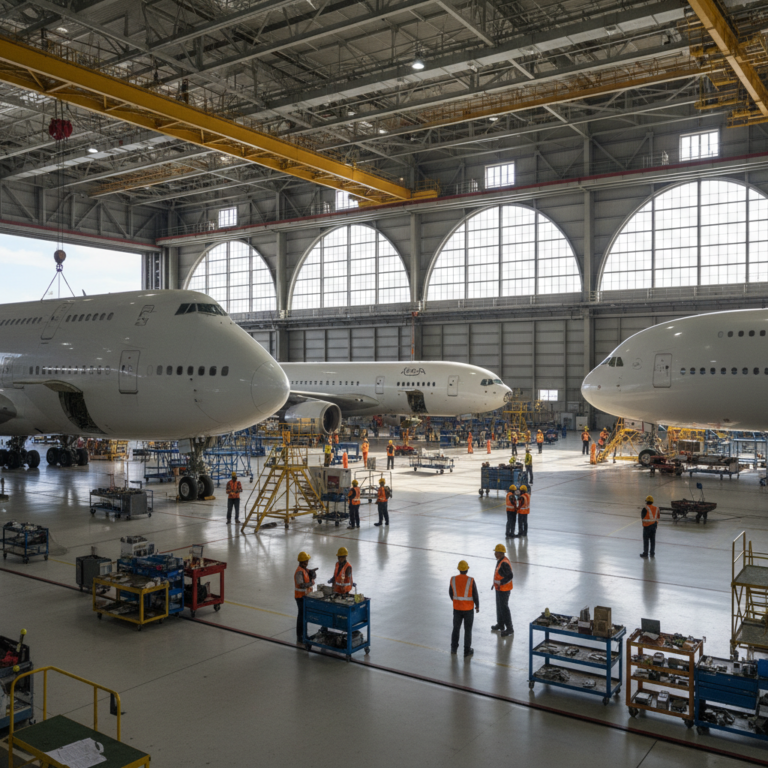
Ground support equipment. ULD containers. Specialized line-maintenance tooling. Rotable spare parts in transit. These assets have a lifecycle that extends far past a single delivery. They cycle continuously: deployment, use, return, dwell, redeployment.
Most carriers still track these the way they track a shipment: visibility ends at delivery. But a shipment tracking mindset does not fit a reusable asset. Shipment tracking tells you where something is until it arrives. Asset tracking follows the object through its full cycle, including the return, the dwell, the reuse. The job doesn’t end at delivery. It restarts.
When a container pool goes dark after delivery, cycle times stretch. Airlines over-purchase equipment to buffer what they can’t locate. MRO shops burn hours hunting for tooling that should be on a shadow board but isn’t. Parts that were “shipped Tuesday” sit in a warehouse with no status update for days.
Run the numbers on one example. If you manage a pool of 5,000 ULDs and your average cycle time is 12 days when it should be 8, you’re carrying roughly 1,667 excess units. At $800 to $2,000 per unit, that’s $1.3 to $3.3 million in dead capital. This is a direct result of poor aviation asset utilization rate. Now scale that across GSE fleets, tooling inventories, and rotable parts. The compounding is fast and quiet.
The technology to solve this is not emerging. IoT trackers with cellular or satellite connectivity, rated for aviation environments (including DO-160 certified devices for airfreight), deploy in days and report location, dwell time, and movement in near real-time. The gap is not hardware. It’s adoption. Most operators still treat ground-asset visibility as a nice-to-have, even as they spend millions on the layers above it.
IT Fragility: The Operational Risk Nobody Budgeted For
In October 2025, Alaska Airlines grounded flights nationwide after a significant IT outage. In August 2025, a frequency outage at Newark halted arrivals. In November 2025, the FAA mandated flight cuts of up to 10% at 40 high-volume airports due to staffing and infrastructure strain.
The pattern: operational efficiency now depends on IT resilience as directly as it depends on fuel management or fleet scheduling. A single digital failure erases weeks of optimization in an afternoon.
And this extends to the ground. When asset management lives in spreadsheets or a local database, a laptop crash, a miscommunicated radio call, or a shift handover gap creates a micro-outage. Nobody writes an incident report when a GPU takes 20 extra minutes to locate. But multiply that by 400 daily departures at a major hub and the silent cost is staggering.
Real-time asset data is as much a resilience play as it is an efficiency play. When disruptions hit, operators with live visibility across all layers recover first because they see the current state, not the state from six hours ago.
When the Full Stack Works Together
The aviation software market is projected to grow from $11.8 billion in 2025 to $22.5 billion by 2033. AI-specific aviation software is growing at 20.5% CAGR through 2035. Capital is flowing into this space. The question is whether it reaches every layer or only the most visible ones.
When the stack is instrumented top to bottom, three things become measurable:
- Compounding savings. A 3% fuel reduction plus a 30% drop in unplanned maintenance events plus a 25% improvement in turnaround delay doesn’t just add up. It multiplies, because each layer feeds the next. Shorter maintenance means more gate hours. More gate hours means more turns. More turns means more revenue per aircraft per day.
- Capital released from over-provisioned assets. When you know the real-time location and status of every ULD, GPU, and rotable part, you stop buying extras to compensate for what you can’t find. That capital returns to the balance sheet or funds revenue capacity.
- Faster recovery from disruption. IT outages, ATC gaps, and weather events will keep happening. Operators with live visibility at every layer recover first because they can redeploy what’s available, not what they hope is available.
easyJet’s Jetstream AI already replaces 3,000 pages of operational manuals with a generative AI interface serving 2,000 daily flights. That’s the direction: AI acting on real-time data across every operational layer. But AI is only as useful as the data feeding it. If ground-side assets generate no location or status telemetry, the AI has a hole in its picture that no algorithm can fill.
Closing that hole does not require a multi-year digital transformation. Modern IoT asset trackers, including DO-160 certified devices built for airfreight environments, deploy fast, report over cellular or satellite, and integrate with existing platforms. The technology is proven. Aviation ground operations are simply late to adopt it.
If your container pool, GSE fleet, or MRO tooling goes invisible after delivery or deployment, that’s the efficiency layer still waiting to be measured. We build tracking for exactly this problem. Reach out if it’s on your radar: info@datanetiot.com.

Frequently Asked Questions
What does aviation operational efficiency mean?
It is the practice of generating more output (seat miles, gate turns, on-time departures) from fewer inputs (fuel, labor, equipment, time) across every phase of airline and airport operations. Flight planning, maintenance, crew scheduling, turnaround management, and ground asset coordination work as an integrated system. Gains in one layer compound with gains in others.
How much does aircraft downtime cost?
An unscheduled Aircraft on Ground (AOG) event costs between $10,000 and $150,000 per hour depending on aircraft type and airline. The direct cost is only part of the damage: a single AOG triggers cascading delays across a network, multiplying the financial impact well beyond the initial downtime window.
What ROI does predictive maintenance deliver in aviation?
Industry benchmarks show an average 10:1 return on investment, with 25 to 40 percent lower maintenance costs and up to 50 percent less unplanned downtime. Delta TechOps’ APEX platform reports over 95% accuracy on pending-failure predictions, the current industry standard.
How is on-time performance measured?
Both Cirium and OAG define a flight as “on time” if it arrives at the gate within 15 minutes of schedule. Cirium’s On-Time Performance Review has tracked this metric for over 16 years and serves as the industry’s primary public benchmark for airlines and airports.
What is the difference between shipment tracking and asset tracking?
Shipment tracking monitors a consignment until delivery. Asset tracking follows a reusable asset (ULD, ground equipment, tooling) through its entire lifecycle: deployment, use, return, dwell, and redeployment. In aviation, most ground equipment cycles continuously, making asset tracking the appropriate model for visibility.
How large is the aviation software market?
Grand View Research valued it at $11.8 billion in 2025, projecting $22.5 billion by 2033. AI-specific aviation software is the fastest-growing segment at 20.5% CAGR through 2035. The aviation analytics market is forecast to reach $13.42 billion globally by 2035.





 +1 508 292 2210

2 Responses