

A record 183.2 million TEUs moved across the world’s oceans in 2024. Three separate months broke 16 million TEU for the first time in history. The global fleet now exceeds 6,700 active vessels carrying 33.6 million TEU of capacity.
And yet, the average logistics team still relies on a patchwork of carrier portals, EDI messages, and email chains to answer one question: where is my container?
Container visibility solutions are supposed to fix that. Most of them do, to a point. They tell you where the box is right now. Some predict when it will arrive. But the majority stop the moment cargo reaches destination. The physical container (the metal asset you’re paying for) goes dark.
That gap between knowing where your shipment is and knowing where your asset is costs more than most companies realize. This article breaks down what container visibility actually looks like in 2026, where the technology delivers and where it falls short, and what to prioritize if you’re evaluating solutions right now.
What Container Visibility Really Means (and What It Doesn’t)
Container visibility is the ability to monitor a shipping container’s location, status, and condition across every leg of its journey: ocean, port, rail, road. In practice, it layers multiple data sources into a single view so you stop toggling between Maersk’s portal, Hapag-Lloyd’s portal, and a spreadsheet.
The technology stack works in four layers:
- Data acquisition. AIS signals from vessels (coastal and satellite), IoT sensors attached to or built into containers (GPS, temperature, humidity, shock, door-open), and terminal operating systems reporting gate-in/gate-out events.
- Carrier data feeds. EDI 315/214 messages and modern REST APIs deliver booking, equipment, and milestone events. The Digital Container Shipping Association (DCSA) is gradually standardizing these APIs across carriers, though adoption is uneven.
- Aggregation and normalization. Platforms ingest all of the above, deduplicate events, and present a single timeline per shipment. Vizion (now part of Descartes) processes over 300 million container events and tracks 98% of all shipments globally. project44, FourKites, and Shippeo offer comparable aggregation at scale.
- Intelligence. Predictive ETA models, exception alerts, emissions calculations (GLEC, ISO 14083), and integration with your TMS or ERP.
That’s the standard pitch. And it’s accurate as far as it goes.
The problem is where it stops. Most platforms define “container visibility” as shipment tracking across carriers. The moment cargo is delivered and the container is emptied, visibility ends. The container enters a return cycle (repositioning, cleaning, dwell at depot, reloading) that nobody tracks unless you deliberately build that layer.
This distinction matters. Shipment tracking follows the cargo from origin to destination. Asset tracking follows the container through its entire lifecycle, delivery included but not ending there. If your container pool feels invisible after the cargo is out, that’s the gap asset tracking closes.
The Accuracy Gap Nobody Puts in the Sales Deck
Here’s a number that should change how you evaluate visibility vendors.
A joint study by University of Nevada and Texas A&M researchers, analyzing 1.7 million logistics records, found that container-level tracking maintained 87.3% accuracy on single-transshipment routes. Bill-of-Lading tracking hit 97.6%.
On multi-transshipment lanes, the gap got worse. B/L tracking held at 94.1%. Container tracking collapsed to 75.8%.
Why? The container identifier is tied to a physical box that can be swapped mid-transit, especially during transshipments. A Bill of Lading follows the cargo legally from origin to destination regardless of which steel box it sits in. The same study found that operators using B/L-based systems processed 300 to 400 shipments per day versus roughly 50 for container-only systems. A six-fold productivity gap.
None of this means container-level tracking is useless. It means you need to understand which tracking method your platform uses, what accuracy you’re actually getting on your specific lanes, and whether the vendor’s “99% coverage” claim refers to carrier coverage or data accuracy. Those are very different things.
If your routes involve multiple transshipments (and in 2026, more routes do thanks to Red Sea re-routings and alliance reshuffles), ask your vendor for accuracy benchmarks on multi-leg lanes. If they can’t provide them, that tells you something.
Shipment Tracking Ends at Delivery. Then What?
Most container visibility platforms are built to answer a supply chain manager’s question: “When will my cargo arrive?” Fair question. Worth solving. The best platforms solve it well.
But for companies managing reusable containers, ULDs, chassis, or any pooled equipment, the problem doesn’t end at delivery. It starts there.
After cargo is stripped, the container enters a return cycle. It sits at a depot (dwell time). It gets repositioned to the next loading point. It might need cleaning or repair. Each day it sits idle is a day it’s not earning. Each day it’s unaccounted for is a day you might be paying detention charges without knowing it—a challenge that comprehensive inventory visibility solutions are designed to address across the full equipment lifecycle.
Detention and demurrage costs are the most visible symptom of this blind spot. Industry benchmarks point to 20 to 40% D&D cost reduction with real-time visibility. The mechanism is straightforward: you see the container approaching free-time expiry, you act before the charges start.
But the deeper cost is cycle time. If you can’t see where your containers are post-delivery, you can’t compress the return cycle. You can’t right-size your pool. You end up ordering more containers than you need because you don’t trust the ones you have to come back on time. That excess capacity is pure cost, hidden in the balance sheet as “fleet management.”
This is where container visibility becomes asset tracking. And it’s where most software-only platforms hit a wall. The return leg often lacks the carrier EDI and API feeds that power the outbound journey. The container is off-hire, sitting in a third-party depot, invisible to every platform that depends on carrier data.
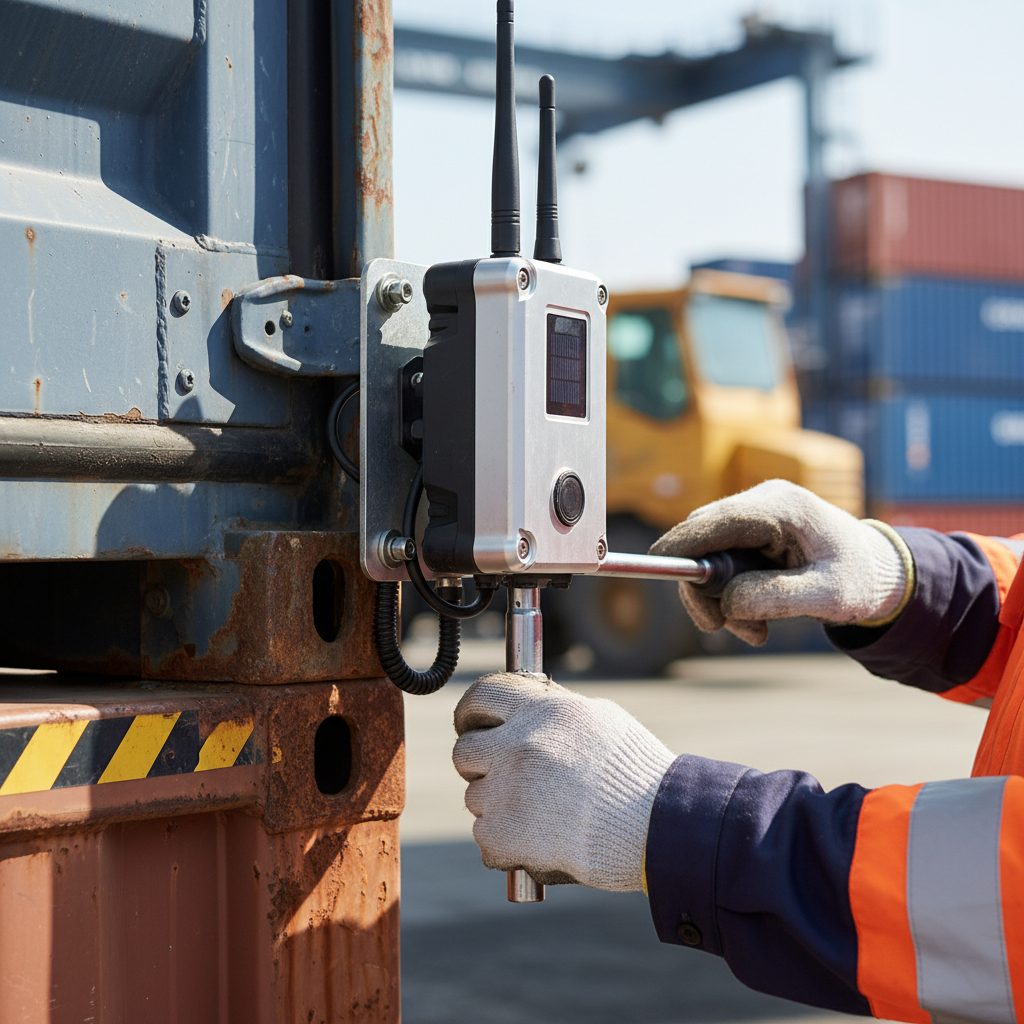
You need hardware on the box. A GPS tracker that reports position independent of any carrier system. Purpose-built ocean equipment trackers (battery-powered, cellular or satellite, ruggedized for salt, stack weight, and vibration) can report position and status for months without intervention, through port, depot, and open water. That’s the only layer that keeps working after the carrier washes its hands of the container.
Anatomy of a Visibility Stack That Actually Works
A working container visibility solution is not one product. It’s a stack. Each layer has a job, and skipping one creates a blind spot that the others can’t compensate for.
| Data source | What it covers | Update frequency | Limitation |
|---|---|---|---|
| AIS (terrestrial + satellite) | Vessel position, heading, speed | Seconds (coastal), minutes (ocean) | Vessel-level only. No container granularity. |
| Carrier EDI/API | Booking, load/discharge, gate events, customs | Minutes to hours | Depends on carrier accuracy. Goes silent off-hire. |
| IoT sensors on container | GPS, temperature, humidity, shock, door status | Minutes (configurable) | Requires hardware investment. Battery life matters. |
| Port/terminal data | Yard position, gate-in/gate-out, dwell | Real-time | Coverage varies by terminal. Many ports still lag. |
| Inland telematics (truck/rail) | Drayage and rail positions | Minutes | Often a separate system. Integration required. |
AIS provides fast, low-cost coverage in coastal waters; satellite AIS extends visibility to open ocean. But AIS tells you where the vessel is, not which container is on it or what state it’s in. Carrier APIs fill that gap on the outbound journey. IoT sensors fill it everywhere else.
On the intelligence layer, AI-driven ETA prediction is the headline capability. Shippeo commits to 90% accuracy for ocean ETA predictions up to 30 days before arrival. Windward and Portcast claim comparable performance using deep-learning models that fuse weather, port congestion, and historical AIS data. A 2024 paper in Expert Systems with Applications validated this approach, showing that bi-directional deep-learning models outperform earlier ML baselines for vessel arrival time prediction.
Smart containers deserve a mention. Hapag-Lloyd’s Live Position and Maersk’s Captain Peter service embed telematics directly into reefer containers, reporting position and refrigeration status over cellular networks. Coverage is growing, but it’s concentrated on reefer boxes (roughly 3 to 5% of the global fleet). The other 95%+ of dry containers are still passive: visible only through carrier milestone events unless you add your own hardware.
I bring up all these layers because the mistake I see repeatedly is this: companies invest heavily in the platform layer (aggregation, dashboards, predictive ETA) and skip the sensor layer. They get great pre-delivery visibility and zero post-delivery visibility. If your containers cycle back (and in any reusable pool, returnable container program, or leased fleet, they do), the hardware layer is not optional.
One cautionary note on platforms: technology alone doesn’t solve the problem if the industry can’t agree on standards. Maersk and IBM shut down TradeLens in early 2023 after six years of trying to create a blockchain-based logistics platform. The technology worked. The adoption didn’t. Any visibility stack you build needs to work with the carriers and partners you actually have, not the ones you wish would adopt a universal standard.
How to Choose a Container Visibility Solution Without Regret
The market is crowded. project44, FourKites, Descartes (Vizion), Shippeo, Portcast, and dozens of niche players all promise container visibility. Carrier-direct tools from Hapag-Lloyd, Maersk, and CMA CGM offer free tracking for booked shipments. Tradlinx’s comparison guide lists 16+ ocean visibility tools ranging from free tiers to six-figure enterprise contracts.
Before you sign anything, evaluate these five things:
1. Data accuracy on your lanes, not “coverage.” Every vendor claims 95%+ carrier coverage. The real question is what accuracy looks like on your specific routes, especially multi-transshipment ones where container tracking can drop below 80%. Ask for accuracy metrics by lane type. If the vendor doesn’t track lane-level accuracy, that’s a red flag.
2. Cross-modal coverage. Ocean-only visibility creates a different blind spot. Your container doesn’t teleport from port to warehouse. The drayage, rail, and last-mile legs are where delays compound and costs spike. A solution that stops at port discharge is solving half the problem. The FourKites research report found 50% of shippers have zero visibility into ocean freight; the percentage with no visibility into the drayage leg after port is almost certainly higher.
3. Integration depth, not just “API available.” Connecting an API takes a week. Maintaining clean, normalized data flowing into your ERP or TMS takes months of iteration. Ask about data mapping, error handling, and what happens when a carrier changes its event schema (it happens more often than vendors admit). The hidden cost of API-based visibility is not the license fee. It’s the ongoing integration engineering.
4. Alert intelligence, not just alerts. A platform that fires 200 exception alerts a day creates fatigue, not visibility. The best systems prioritize exceptions by financial exposure: detention fee accumulating, cargo value at risk, production schedule impact. If you can’t configure alert thresholds by business impact, you’ll drown in notifications within a month.
5. Carrier-direct or neutral? Carrier portals (Hapag-Lloyd Live Position, Maersk Captain Peter, MSC MyMSC) own ground-truth data for their containers. But they only cover their own fleet. Neutral platforms (project44, FourKites, Vizion) aggregate across carriers, giving you cross-carrier benchmarking and a single dashboard. Most operations at scale need both: carrier-direct for depth, neutral for breadth. Understand which architecture your vendor uses before committing.
One more factor often overlooked: cybersecurity. Visibility platforms depend on the integrity of the underlying IT systems at ports, carriers, and terminals. The Rhysida ransomware attack on the Port of Seattle in August 2024 exposed data of 90,000 individuals and disrupted operations for weeks. DP World Australia suffered a separate cyber incident in November 2023 that halted port operations for three days. Your visibility is only as reliable as the weakest link in the data chain. Ask vendors how they handle upstream outages and data integrity checks.
Three Measurable Outcomes Worth Tracking
Visibility for its own sake is a nice dashboard. Visibility that changes operational outcomes is an investment. Here’s where the ROI actually shows up:
- Detention and demurrage reduction. Industry benchmarks point to 20 to 40% D&D cost reduction with real-time visibility. For companies moving hundreds of containers monthly, this alone can justify the platform cost within one quarter. The mechanism is simple: you see the container approaching free-time expiry, you act before the charges start. No visibility means you find out about the charge on the invoice.
- Cycle time compression. When you can see where every container is, including post-delivery, you stop over-ordering to compensate for uncertainty. Pool sizes shrink. Utilization rates rise. Unilever built a Virtual Ocean Control Tower using MarineTraffic data to monitor 12,000 containers across 1,500 ships, precisely to coordinate inland logistics with predictive arrival data and reduce buffer stock.
- Scope 3 emissions reporting. Container visibility feeds directly into transport emissions calculations under GLEC and ISO 14083. With the EU’s Corporate Sustainability Reporting Directive (CSRD) expanding requirements, integrating ESG data into shipping emissions tracking is shifting from voluntary to mandatory. A visibility platform that captures route, mode, and distance data per shipment gives your sustainability team the inputs they need without manual data collection.
The container tracking market is projected to reach USD 19.1 billion by 2031. Adjacent segments (smart containers, vessel ETA prediction, real-time visibility platforms) are growing even faster. The technology works. The question isn’t whether to invest in container visibility. It’s whether to invest in a solution that tracks the shipment or one that tracks the asset.
If your visibility ends when the cargo is delivered, you’re solving half the problem. The other half (where your containers sit, how fast they return, what condition they’re in) is where operational dollars are won or lost.
We build visibility solutions that cover the full container cycle: ocean, port, depot, and back. Hardware plus integration, configured for your fleet. If that’s the gap you’re looking at, reach out to our team or email us at info@datanetiot.com.
Frequently Asked Questions
What is container visibility?
Container visibility is the ability to track and monitor shipping containers in real time across ocean, port, rail, and road legs. It combines carrier milestone data, AIS vessel tracking, IoT sensors, and predictive analytics to show where a container is, when it will arrive, and what condition it’s in throughout transit.
What is the difference between container tracking and Bill of Lading tracking?
Container tracking follows the physical box identifier, which can change during transshipments when cargo is moved between containers. Bill of Lading tracking follows the cargo’s legal document from origin to destination. Research shows B/L tracking is 10+ percentage points more accurate on multi-transshipment routes and supports roughly six times higher operator throughput.
How accurate is ocean container tracking?
On single-transshipment routes, container-level tracking achieves about 87% accuracy. On multi-transshipment routes, it drops to approximately 76%. AI-powered ETA models from leading platforms claim 90% accuracy for arrival predictions up to 30 days out, though these are vessel-level estimates that don’t account for post-discharge movements.
What is the difference between shipment tracking and asset tracking?
Shipment tracking follows cargo from origin to delivery and ends there. Asset tracking follows the physical container through its full lifecycle: delivery, return, dwell time at depot, repositioning, and reload. For companies managing reusable container pools, asset tracking closes the visibility gap that shipment tracking leaves open after delivery.
Can I track containers for free?
Yes. Carrier portals (Hapag-Lloyd, Maersk, CMA CGM, MSC) offer free milestone tracking for booked shipments. Free aggregators and API tiers exist at several platforms. These work for low-volume, single-carrier use cases but lack cross-carrier analytics, predictive ETA, and post-delivery visibility.
How do IoT sensors improve container visibility?
IoT sensors (GPS, temperature, humidity, shock, door-open) mounted directly on the container report position and condition data independent of carrier systems. This is the only visibility layer that works after the container leaves carrier custody, making it essential for return-cycle tracking, cold-chain compliance, and detention avoidance in reusable fleets.





 +1 508 292 2210

4 Responses