

Somewhere between $800 million and $1.5 billion in returnable containers disappear from global supply chains every year. Racks, totes, IBCs, pallets: they ship out loaded, and a painful percentage never comes back. If you’re researching how to track returnable containers, you’ve probably already felt that number in your replacement budget.
After 15+ years deploying IoT tracking across industrial supply chains, I can tell you the technology is almost never the bottleneck. The bottleneck is accountability. Most operations start shopping for GPS trackers or RFID portals before they’ve answered a far simpler question: who has my containers right now, and are they late? This challenge mirrors what fleet operators face when learning how to track fleet assets effectively.
This guide covers the practical steps that actually close a returnable container loop: serialization, custody events, technology selection, and the dwell-time economics that move the real financial needle.
The Accountability Gap (Not a Technology Gap)
When containers go missing, the first instinct is to buy a tracking device. Understandable. But in most operations I’ve walked into, the failure mode looks the same: containers leave with no unique identity, get handed to a partner with no recorded custody, sit idle in a yard for weeks with no flag, and eventually get written off as “shrinkage.”
That’s not a visibility problem. It’s an accountability vacuum.
Industry estimates put annual loss rates at 6% to 10% for companies without systematic tracking. Run the math on your own pool. Twenty thousand racks at 8% annual loss and $200 per unit is $320,000 in replacement spend. Every year. For assets you already paid for.
A distinction matters here. Shipment tracking tells you where a package is until it arrives. Asset tracking follows the physical container through its entire lifecycle: the return leg, the idle time at your partner’s dock, the wash cycle, the next dispatch. Most “tracking” solutions stop at delivery confirmation. The container’s second life (the return trip, the inspection, the redeployment) is exactly where losses compound.
The fix starts before any sensor purchase. Assign named custodians. Define return deadlines. Build a process that flags overdue assets and triggers collection. Every outbound shipment should create a return obligation, and that obligation gets tracked until fulfilled.
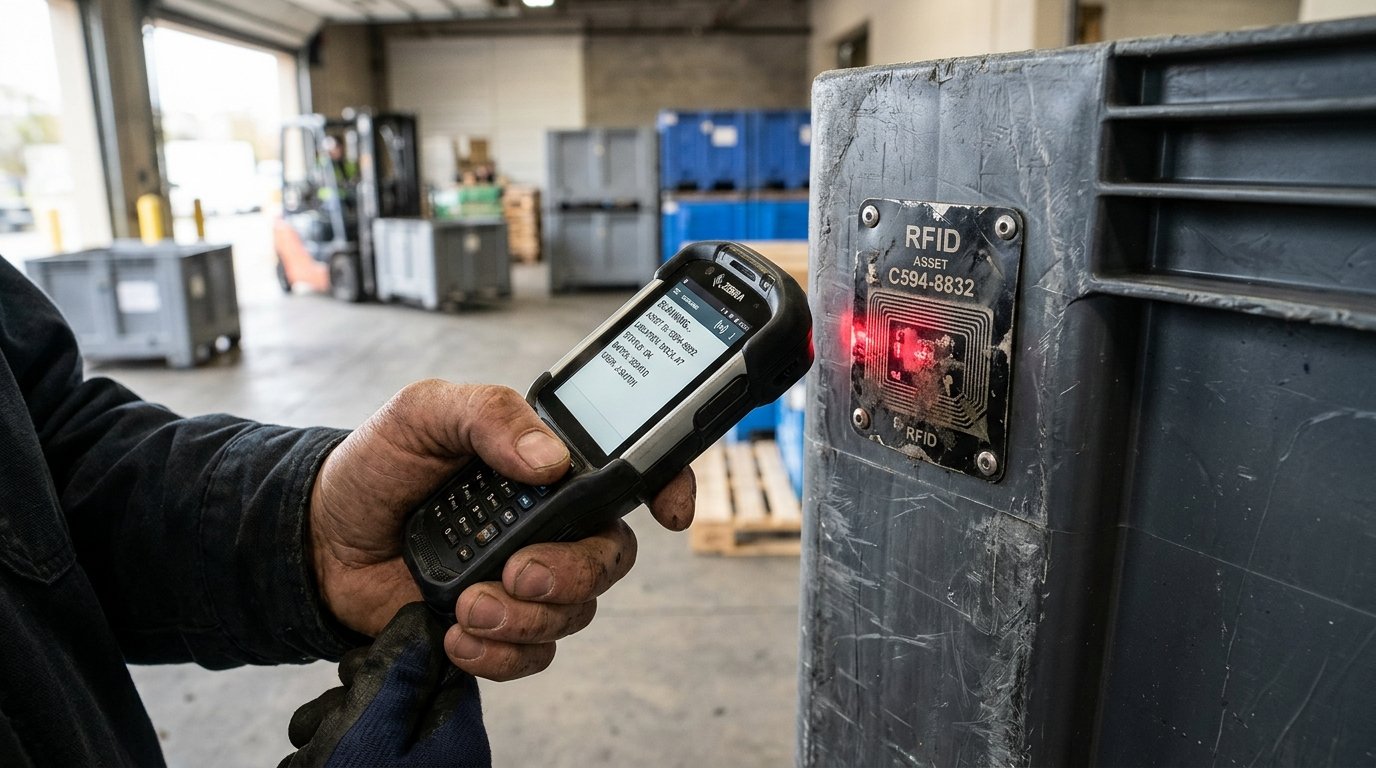
Serialize Every Container Before You Buy a Single Sensor
Every returnable container needs a unique, permanent identity. Not a batch number. Not a product SKU. An individual identity tied to that physical unit.
GS1’s Global Returnable Asset Identifier (GRAI) was built for exactly this purpose. It combines your company prefix, asset type, check digit, and an optional serial number. The serialized form lets you track individual container history: how many cycles it’s completed, who’s held it longest, when it was last inspected.
This step costs almost nothing compared to sensor infrastructure. A durable barcode or DataMatrix label, properly applied, can survive years of handling. For harsher environments (chemical wash, freezing, forklift impacts), metal plates or embedded RFID inlays add durability without adding complexity.
The mistake I see most often: skipping serialization and jumping straight to IoT. I’ve watched operations spend six figures on RFID portals, only to realize they can’t reconcile returns because containers aren’t individually identifiable. The portal reads a tag. But if that tag identifies the container type rather than the specific unit, you know how many came back. You don’t know which ones are still missing, or who had them.
Serialize first. The sensor decision gets dramatically easier once every container has a name. This serialization principle applies across all returnable assets—the same logic used when businesses need to keep track of tools at work.
Five Custody Events That Close the Loop
A returnable container loop has five critical handoff points. Miss any one, and you create a gap where containers quietly disappear.
| Event | What it answers | What it triggers |
|---|---|---|
| Dispatch | Which containers left, with whom, and when are they due back? | Creates a return obligation for the recipient |
| Receipt | Did the recipient confirm the same containers? | Flags shortages and misroutes immediately |
| Empty / ready for pickup | Is the container available for return transport? | Schedules collection or consolidation |
| Return receipt | Which containers physically came back? | Closes the custody obligation |
| Inspect / release | Can this container safely circulate again? | Routes to reuse, repair, or retirement |
Adient deployed RFID across 875,000 returnable containers with dock-door readers capturing identity, direction, and location. The reported result: 99% read accuracy and a counting process reduced from days to minutes. But the real value isn’t the read accuracy itself. It’s that every dock-door crossing creates a timestamped custody event, and that event feeds a reconciliation loop that replaced manual audits.
Mobis took a complementary approach: UHF RFID at six dock doors feeding container events directly into SAP’s Container Management Module. Production planners could see container availability alongside parts inventory. Not in a separate spreadsheet. Not two days later.
You don’t need RFID to implement this framework. Barcode scans at each handoff work for lower-volume loops. What matters is that every event gets recorded, every custody transfer gets confirmed, and overdue balances get flagged before they become write-offs.
Picking the Right Technology for Your Loop
The question isn’t “which technology is best?” It’s “which technology answers the question I actually need answered, at a cost that makes sense for this asset?”
John Deere figured this out back in 1999. Their global container pool (roughly 1.5 million units) used three tiers: active RFID for high-value, long-distance loops; passive RFID for centralized, high-throughput flows; and barcodes for inexpensive totes. That segmented logic still holds today.
| Technology | What it tells you | Best for | Key limitation |
|---|---|---|---|
| Barcode / QR | Identity at a deliberate scan | Low-volume loops, budget entries | Requires a person or camera to scan |
| Passive UHF RFID | Automated identity at fixed read points | Dock doors, conveyors, bulk movements | No position data between readers |
| BLE (Bluetooth Low Energy) | Presence observation; direction finding for positioning | Facilities, yards, distributed pools | Basic detection and engineered AoA are very different capabilities |
| UWB (Ultra-Wideband) | Fine-grained indoor positioning | Locating specific racks inside a warehouse | Requires fixed anchors; accuracy varies by site |
| GNSS + Cellular | Outdoor position with remote reporting | High-value racks, trailers, cross-border loops | GPS finds position; still needs a network to transmit |
| LoRaWAN / Satellite | Connectivity for remote or sparse assets | Rural, maritime, no-cellular zones | Communication method, not a positioning system |
The myth I bust most often: “We need GPS on every container.” You almost certainly don’t. For a $30 tote, a GPS tracker with a cellular subscription is economic nonsense. A barcode scan at dispatch and return, paired with an RFID read at the dock door, delivers accountability without per-unit telemetry costs.
Reserve cellular GNSS for assets where the value justifies continuous visibility: automotive racks worth $500+, IBCs carrying regulated materials, or containers circulating across borders where you lose sight for weeks. Devices like the Oyster3 or Oyster Edge deliver multi-year battery life with configurable reporting intervals, so you pay for updates that match how often the asset actually moves.
The layered approach works: barcodes for identity at every tier, RFID at high-throughput chokepoints, cellular on the assets that justify the spend. One technology for an entire pool is rarely the right call.
Dwell Time: Where Your Money Actually Hides
Little’s Law, a foundational principle in operations research, gives you the pool-sizing math in one line:
Working pool ≈ containers dispatched per day × average full-loop days
Dispatch 1,000 containers daily with a 20-day average loop, and you need roughly 20,000 in circulation. Cut that loop to 15 days, and the number drops to 15,000. Five thousand fewer containers to purchase, store, maintain, and track. At $200 per unit, that’s $1 million in avoided capital expenditure.
Now consider where that cycle time actually lives. In most industrial loops I’ve analyzed, transit accounts for a small fraction of the total. The real time sink is dwell: how long containers sit idle at a partner’s site between being emptied and being collected for return.
I’ve walked automotive supply chains where containers spend 3 days in transit and 12 days parked in a customer’s yard. The container isn’t lost. It’s idle, invisible, and consuming capital.
Tracking data turns this from a frustration into a negotiation tool. When you can show a partner their average dwell is 14 days against a contractual target of 7, the conversation changes. No finger-pointing required. Just evidence. Some companies build dwell-time penalties into supply agreements. Others use the data to optimize collection routes by consolidating pickups from nearby partners. Both require the same input: visibility into where containers sit and for how long.
There’s a deeper signal most operations miss entirely. A sudden dwell-time spike at one customer site (say, from 7 to 18 days) rarely means they’re hoarding your racks. It often indicates their production line slowed, their warehouse hit capacity, or their receiving crew changed schedules. Dwell data becomes an early-warning system for operational disruptions across your partner network, well before those disruptions show up in order patterns.
EU Regulation: The Compliance Clock Is Running
Regulation (EU) 2025/40, which generally applies from August 2026, sets mandatory reuse targets for transport packaging. By 2030, specified categories face a 40% reuse requirement. The 2040 target calls on operators to “endeavour” to reach 70%: a softer legal formulation, but an unmistakable trajectory.
For tracking specifically, the regulation includes provisions for reusable labeling and digital carrier information, with implementation dates starting no earlier than February 2029. These provisions address trip counting, rotation calculations, and allow estimation where precise calculation isn’t feasible.
To be clear: this is not a blanket GPS mandate. But it does require auditable records of how many times each container (or container type) has actually circulated. If your system can’t answer “how many round trips has this IBC completed this year?” then a compliance gap is forming right now.
Modeling from the Ellen MacArthur Foundation suggests 35% to 69% GHG reductions in highly collaborative, scaled return systems. Those numbers depend on actual return rates, efficient transport, and effective washing. Tracking alone doesn’t prove sustainability. It provides the evidence that supports (or contradicts) your reuse claims. That’s the difference between a compliance checkbox and an operational advantage.
Three Outcomes to Measure in 90 Days
You don’t need a year-long rollout to prove the model. Pick one container loop: a single route between your facility and a key partner. Instrument the five custody events. Then measure three things:
- On-time return rate. Containers returned by deadline divided by containers due in that dispatch cohort. This single number tells you whether your accountability system works. Below 80%? The problem is process, not technology.
- Capture completeness. Percentage of expected handoff events that actually got recorded. If dispatch scans happen reliably but return scans don’t, your data has a gap exactly where losses occur.
- Full cycle time. From dispatch to inspected-and-available-for-reuse. Not just transit. The complete loop including dwell and inspection. This feeds the Little’s Law calculation and reveals how many containers your pool truly needs.
A pilot on a single lane with barcode scans at five handoff points can produce these metrics in weeks. If the data exposes a 15% loss rate and 22-day cycles on a loop you assumed took 10, the business case for wider deployment writes itself.
One cautionary note. Tesco’s discontinued Loop reusable-packaging trial is a sharp reminder that tracking alone can’t fix unfavorable system economics. Collection logistics, washing costs, and partner behavior matter as much as sensor accuracy. Start with a loop where return infrastructure already exists (or is straightforward to build), prove the model there, then expand.
If your container pool goes invisible after delivery, that’s exactly the gap asset tracking closes. We help operations teams size the right technology mix for their loop structure and asset value, from barcode custody on up to cellular GNSS. Explore our asset tracking devices or talk to our team.
Frequently Asked Questions
What is the simplest way to start tracking returnable containers?
Assign a unique durable code (barcode, QR, or RFID tag) to each container, maintain an asset register, and scan at dispatch and return. Reconcile customer balances weekly. You don’t need GPS or complex infrastructure to close the accountability loop on day one.
Do I need GPS on every returnable container?
Almost never. GPS plus cellular makes economic sense for high-value assets (racks above $500, cross-border IBCs) where visibility gaps last weeks. For most totes and bins, barcode or RFID custody at handoff points delivers accountability at a fraction of the cost.
How should I calculate my container return rate?
Define a dispatch cohort and a return deadline. Divide containers returned on time by containers due in that same cohort. Track late returns and permanent write-offs as separate categories. Without consistent windows and definitions, return-rate numbers across sites or partners aren’t comparable.
Is RFID always better than QR codes for container tracking?
No. RFID excels at automating bulk reads at dock doors and conveyors. QR codes work well for lower-volume loops and environments where partners use smartphones for scanning. The right choice depends on throughput, physical conditions, and whether your partners will install fixed readers.
Does the EU packaging regulation require GPS on returnable containers?
Regulation (EU) 2025/40 requires auditable rotation and trip records, not a specific tracking technology. It allows estimation where precise calculation is infeasible and exempts certain packaging categories. The obligation is to prove reuse, not to install a particular sensor.
How much does returnable container tracking cost?
There is no universal per-container price. Barcode labels cost cents. Passive RFID tags range from $0.10 to $2.00+ depending on durability. Cellular GNSS trackers run $20 to $80+ per unit plus connectivity. Request all-in quotes covering identification, readers, integration, subscriptions, and support. The meaningful comparison is cost per completed rotation, not cost per tag.





 +1 508 292 2210