

Half of global shippers have zero end-to-end visibility into their ocean freight. Not partial. Not delayed. Zero.
If you manage container flows, that number probably doesn’t shock you. You’ve lived the spreadsheet with 300 container numbers updated by forwarding agents who are themselves refreshing carrier portals. The 6 AM call about a missed transshipment in Tanjung Pelepas that nobody flagged. The demurrage invoice that lands three weeks after the damage is done.
Ocean freight visibility is supposed to fix all of that. But the term gets used so loosely it can mean anything from a carrier login to a full predictive control tower. Here’s what it actually means, what it costs to ignore, and where the operational value really sits.
What Ocean Freight Visibility Actually Means
Ocean freight visibility is the ability to monitor the real-time location, status, and predicted arrival time of cargo moving by sea, across every leg: origin warehouse to destination port, through last-mile drayage, and (in best practice) through the container’s return cycle. It combines vessel tracking data, carrier milestone feeds, IoT sensor readings, and predictive analytics into a single operational picture.
That definition sounds clean. The reality is a data problem. Roughly 80% of global trade by volume moves by sea, yet ocean has historically been the least digitized transport mode. Visibility has to pull from multiple sources at once: AIS vessel broadcasts, carrier EDI and API milestone events, IoT devices on individual containers, and port terminal operating system feeds. Each source has a different refresh rate, different error profile, and different coverage gap.
A carrier’s “track my container” portal gives you milestone events: gate-in, loaded on vessel, departed, arrived, discharged, gate-out. That’s container tracking. Ocean freight visibility takes those milestones and layers on exception alerts (the vessel skipped the transshipment port), predictive ETAs (it will arrive 38 hours late), emissions calculations, and integration with your TMS or ERP so downstream operations can react before the problem shows up at the dock.
The DCSA Track-and-Trace API standard, now adopted by nine of the largest ocean carriers, helps with data consistency. It defines a canonical event model across five shipping phases. But standardized data is still carrier-reported data. It’s only one layer of the picture.
What Flying Blind Actually Costs
Start with the most direct line item: demurrage and detention.
Average D&D charges hit $1,219 per container by Q1 2021, a 104% year-over-year spike. Rates have moderated since the supply chain crisis peak, but the structural exposure hasn’t changed. Free time at most U.S. terminals runs 3 to 4 days. The moment a container sits past that window, you’re paying. On certain corridors in 2025 and into 2026, port congestion has crept back up, pushing dwell times above breakeven again.
Visibility won’t eliminate D&D entirely. But it changes the math. When you know a vessel is running 48 hours late three days before arrival instead of three hours before, trucking dispatch has time to reschedule. Warehouse teams can reallocate labor. Your customer gets an accurate revised ETA instead of silence followed by an apology.
Then there’s the human cost. Shippers using manual track-and-trace workflows burn an average of 166 hours per month checking statuses across carrier portals. That’s a full-time employee doing nothing but copying container numbers into websites. Same research found a 75% reduction in ocean freight booking time after deploying a visibility platform. Those hours don’t disappear; they move to work that actually advances the business.
The less visible cost is inventory. When you can’t predict when freight will arrive, you buffer. You carry more safety stock. That’s tied-up capital. For a mid-size shipper moving 500 containers per month, even a 2-day improvement in ETA accuracy can reduce safety stock requirements by 15 to 20%, freeing working capital that was doing nothing but hedging against uncertainty. Integrated inventory visibility solutions connect ocean freight data with warehouse management systems to optimize stock levels based on real-time arrival predictions.
And now there’s a compliance dimension. The EU CSRD, California’s SB-253, and the ISSB frameworks all require Scope 3 emissions disclosure for transportation. If you can’t track which vessel carried your cargo on which route, you can’t calculate primary emissions data. You’re left with industry averages, and auditors are increasingly rejecting those. Visibility platforms now embed GLEC v3 and ISO 14083 emissions calculators that turn shipment-level events into audit-ready CO2e figures. Without that data pipeline, you’re exposed.
Why Carrier Data Alone Falls Short
Most shippers’ first instinct is to rely on carrier data. It’s free (included in the freight contract), it uses standardized milestone events, and your forwarder probably already funnels it into their portal. Logical starting point.
The problem: between 15% and 40% of carrier-supplied ocean data points contain errors. Timestamps are off. Events fire in the wrong order. Milestones duplicate. And over 90% of what the industry calls “ocean visibility” data comes from those same carrier EDI feeds. Most visibility platforms are normalizing the same flawed source material.
Carrier ETAs are another pain point. A carrier’s estimated arrival time is based on the published schedule, adjusted manually by the carrier’s operations team. On volatile trade lanes (Asia to Europe, trans-Pacific), those ETAs are routinely off by 24 to 48 hours. During peak disruption in 2021 and 2022, carrier ETAs were essentially decorative.
ML-driven predictive ETAs, trained on historical voyage data and real-time AIS vessel positions, outperform carrier schedules by 20 to 40%. Leading platforms in 2026 report sub-6-hour accuracy on trans-Pacific routes. That gap between “the carrier says Wednesday” and “the model says Friday morning” is the difference between a smooth handoff and a warehouse scrambling at 4 AM.
The DCSA standard helps with format consistency. It doesn’t fix the underlying accuracy problem. And it doesn’t cover the legs before or after the port: origin drayage, destination drayage, and what happens to the container after the cargo is stripped.
Four Technology Layers That Make Visibility Real
Effective ocean freight visibility isn’t one data source. It’s four layers, each filling gaps the others can’t.
Vessel Position via AIS
Every commercial vessel over 300 gross tons broadcasts its position via the Automatic Identification System, mandated by the IMO SOLAS convention. Satellite AIS from providers like Spire and MarineTraffic gives global coverage, including mid-ocean where cellular networks don’t reach. This tells you where the ship is, but not which of the 8,000 containers on board is yours or what condition your cargo is in.
Carrier Milestone Feeds
EDI-315, EDI-322, and increasingly DCSA-compliant APIs deliver milestone events from the shipping line: booking confirmed, gate-in at origin, loaded, departed, transshipment, arrived, discharged, gate-out. Useful for workflow automation and exception triggers. Limited by the error rates and latency discussed above. Think of it as the carrier’s version of events, which may not always match reality.
IoT Hardware on the Container
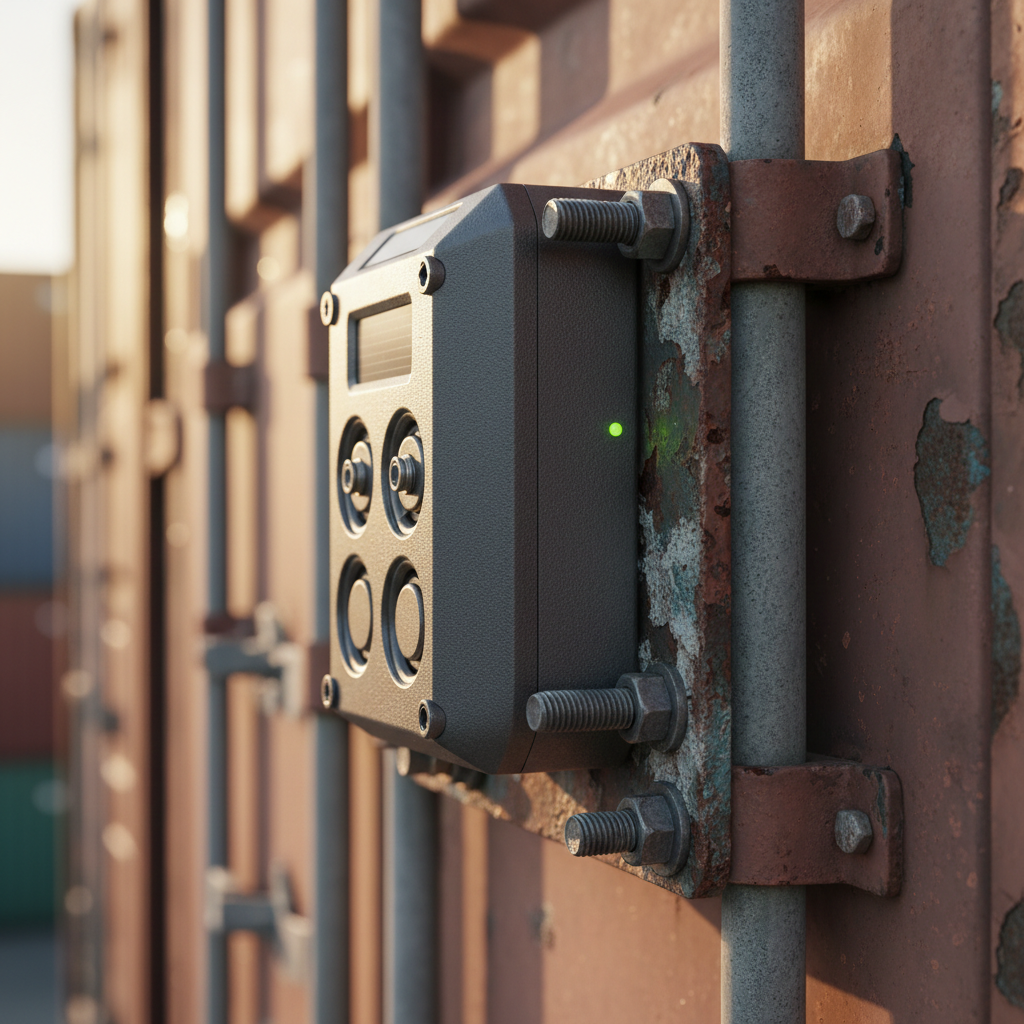
This is where the picture gets sharp. A GPS tracker mounted on or inside the container reports position every 15 to 60 minutes, independent of any carrier system. Advanced devices add temperature, humidity, shock, tilt, and light sensors (door-open detection). Connectivity uses cellular (LTE-M, NB-IoT) near shore and falls back to satellite at sea. Battery life ranges from a few months to over 10 years depending on reporting interval and sensor load.
The economics have shifted. Per-container tracking hardware has dropped below $100 for cellular GPS devices, making deployment practical for dry containers, not just high-value reefer cargo. That’s a fundamental change from five years ago, when IoT tracking was a luxury reserved for pharma cold chains and aerospace parts.
Predictive and Prescriptive Analytics
ML models ingest the three layers above plus historical voyage patterns, weather, and port congestion data to predict ETAs, dwell times, and exception risk. The newest platforms layer generative-AI assistants on top, so a logistics coordinator can ask “which of my shipments are at risk of missing the Thursday delivery window?” and get an actionable answer in seconds. The shift is from dashboards people stare at to systems that tell people what to do.
Each layer covers a different blind spot. AIS shows vessel position. Carrier APIs show what the carrier reports. IoT shows ground truth at the container. Predictive ML shows what’s about to happen. Most shippers still rely on layers one and two. The operational advantage lives in three and four.
The Blind Spot: Shipment Tracking vs. Asset Tracking
Here’s where most ocean visibility conversations stop too early.
Every platform tracks the shipment: booking to delivery. Once the container reaches the consignee and the freight invoice is paid, the tracking job is considered done. Dashboard goes green. Case closed.
But the container doesn’t stop moving. It gets stripped, returned to a depot or terminal, repositioned (often empty), and enters the next cycle. For container pool operators, chassis owners, shipping lines managing their own equipment, and any company running reusable transport packaging, the shipment-centric view creates a massive blind spot.
This is the operational difference between shipment tracking and asset tracking. Shipment tracking answers “where is my cargo right now?” Asset tracking answers “where is my equipment, how long has it been sitting idle, and when will it be available for the next loaded move?”
The costs hiding in that blind spot are real. Dwell time at depots. Empty repositioning fees. Containers sitting at customer sites past the agreed return window. None of that shows up in shipment visibility. It shows up in your P&L as unexplained fleet shrinkage, idle asset costs, and a container pool that’s 15% larger than it needs to be because you can’t see where the surplus is stuck.
If your container pool feels invisible after delivery, that’s the gap asset tracking closes. IoT hardware that stays on the asset through its full cycle, not just the loaded leg, turns return logistics from guesswork into a managed process. We build exactly these solutions at Datanet, pairing ocean equipment tracking devices with platforms that follow the asset from load to return to reload.
When Visibility Pays for Itself
The most honest question in any visibility conversation is: at what volume does this make financial sense?
Here’s the rough math.
| Cost Line | Typical Exposure (100 containers/month) | Visibility Impact | Annual Savings Estimate |
|---|---|---|---|
| Demurrage and detention | $500+ per container in excess dwell | 20 to 30% reduction | $120,000 to $180,000 |
| Manual status checking | 166 hours/month at $50 to $70/hr loaded cost | 50 to 70% time reduction | $50,000 to $85,000 |
| Safety stock buffer | Varies by cargo value; 15 to 20% reduction in buffer | 2+ days of ETA accuracy improvement | $100,000+ in freed working capital |
| Scope 3 non-compliance | Audit risk, customer contract penalties | Primary data replaces averages | Hard to quantify; increasingly real |
A mid-market visibility platform runs $50,000 to $150,000 per year. Per-container IoT devices cost $50 to $200 depending on sensor configuration and battery life, plus $3 to $10 per month in connectivity. The ocean freight visibility market is projected to grow from $3.2 billion in 2025 to $11.8 billion by 2034, and that trajectory reflects how fast the ROI math is becoming obvious to shippers of all sizes.
The breakeven point for most operations sits around 50 to 100 containers per month. Below that, a basic carrier API integration (often free or low-cost from your forwarder) may suffice. Above that, the cost of not having visibility compounds fast.
For asset tracking beyond the shipment (container pools, chassis fleets, reusable packaging), the math tilts further. If you manage 500+ reusable assets and can’t locate 15% of them at any given time, the replacement cost of that invisible 15% dwarfs the tracking investment. I’ve seen this firsthand with aerospace clients running ULD and GSE pools where “missing” equipment turned out to be sitting at three different stations, untracked, for months.
Getting Started Without Blowing Up Your Stack
Nobody in the SERP covers this part well, so let me be direct about what day one actually looks like.
The biggest obstacle to ocean freight visibility isn’t technology. It’s the messy data already sitting in your systems. Container numbers with transposed digits. Booking references that don’t match between forwarder and carrier. Shipment records split across multiple ERPs because of acquisitions. Before you plug in any platform, you need clean reference data.
Here’s a sequence that actually works:
- Pick one trade lane. Your highest-volume or highest-pain lane. Clean the booking data for that lane: match container numbers to purchase orders, reconcile forwarder references with carrier booking numbers. This takes weeks, not months.
- Connect carrier APIs for that lane. Most platforms offer self-service onboarding for major carriers via DCSA-compliant connectors. You’ll start seeing milestone events within days. Validate the data against what your team knows from manual tracking. You’ll find discrepancies. That’s the point.
- Identify the containers where milestone data isn’t enough. Reefers that need temperature logging. High-value cargo that needs position updates mid-ocean. Equipment that goes dark after delivery. Those are your IoT hardware candidates. Mount GPS trackers on those assets first.
- Integrate the visibility feed into your TMS or ERP. Most platforms support webhooks, flat-file exports, or direct API feeds. The goal: exception alerts and ETA updates flow into systems your team already uses, not into one more dashboard they’ll forget to check after the first week.
- Expand lane by lane. Each lane you add is easier because your reference data is cleaner and your team knows the workflow. By lane three or four, onboarding time drops by half.
The whole process, from first lane to operational multi-lane visibility, typically takes 8 to 16 weeks for a mid-sized operation. The vendors who tell you it’s “plug and play in a week” are selling you a login, not a working solution. The difference matters.
One thing I’ll add from experience: the human side is often harder than the technical side. Forwarders may resist sharing data because transparency exposes service gaps. Internal teams may resist because the new system shows how much manual work was actually rework. Expect pushback and plan for it. Change management isn’t a buzzword here; it’s the difference between a visibility project that sticks and one that gets abandoned at month four.
If you’re evaluating where IoT hardware fits into your ocean visibility stack, or if you need help matching devices to your specific containers and trade lanes, reach out to our team. That’s what we do: pair the right tracking hardware with the right platform, configured for the way your freight actually moves. info@datanetiot.com / +1 508 292 2210.
Frequently Asked Questions
What is ocean freight visibility?
Ocean freight visibility is the ability to track the real-time location, status, and predicted arrival time of cargo shipped by sea. It combines vessel AIS data, carrier milestone feeds (EDI/API), IoT container sensors, and predictive analytics into a single operational view across carriers, trade lanes, and logistics partners.
How is ocean freight visibility different from container tracking?
Container tracking means looking up a single container ID on a carrier portal for milestone events. Ocean freight visibility normalizes data across multiple carriers, overlays ML-driven predictive ETAs, flags exceptions automatically, calculates Scope 3 emissions, and integrates with TMS and ERP systems for operational action. Tracking tells you where a box is. Visibility tells you what to do about it.
How much does an ocean freight visibility platform cost?
Most platforms charge $50,000 to $300,000 annually depending on shipment volume, carrier coverage, and features. IoT hardware for container-level tracking adds $50 to $200 per device plus monthly connectivity. ROI breakeven typically falls within 6 to 12 months for shippers moving 100 or more containers per month, driven by D&D savings and labor reductions.
When should I add IoT hardware to my visibility setup?
IoT devices make sense when carrier milestone data is insufficient: temperature-sensitive cargo (pharma, food), high-value goods, containers that need tracking beyond delivery (reusable assets, container pools), or trade lanes where carrier data quality is poor. With per-device costs now below $100 for basic GPS trackers, the threshold for justifying hardware has dropped significantly.
How accurate are ML-driven ETAs compared to carrier schedules?
Leading predictive models achieve 80% to 95% accuracy within a 24-hour window on major trade lanes, compared to 50% to 60% for carrier-published schedules. The gap widens on volatile routes and during disruptions. Accuracy improves further when models are trained on a shipper’s own historical shipment data.
How does ocean visibility help with Scope 3 emissions reporting?
Visibility platforms log which vessel carried your cargo on which route, enabling primary emissions calculations per shipment using frameworks like GLEC v3 and ISO 14083. This replaces the industry-average estimates that regulators increasingly reject for Scope 3 disclosures under CSRD, SB-253, and ISSB standards.






 +1 508 292 2210

3 Responses