

An aircraft on the ground earns nothing. Eurocontrol estimates that every minute of departure delay costs roughly $75. Scale that across a fleet: average departure delay in Europe hit 21 minutes per flight in July 2025, with 9.5 of those minutes attributed to reactionary delay from earlier disruptions. At that rate, aircraft turnaround performance isn’t just an operations metric. It’s a P&L line item.
The process behind that metric involves over 100 tasks, at least five different organizations, and a critical path where one late step cascades through the network. I’ve spent 15+ years in IoT and asset tracking for aviation, and the pattern I keep seeing is operators investing in turnaround optimization before they’ve established what’s actually causing the delay. They buy cameras before they know where their ground equipment is. They chase average turn time when the real killer is variability.
This piece pulls apart what turnaround performance actually means, where turns break, and which interventions have evidence behind them.
What Aircraft Turnaround Performance Actually Measures
Turnaround performance captures the elapsed time and process reliability between an aircraft’s arrival at a stand (in-block) and its departure (off-block). It sounds like a single number. In practice, it is a system of interlocking handoffs, each owned by a different organization.
The confusion starts because “turnaround” means entirely different things depending on who’s talking. A fleet planner means gate occupancy. A COO means on-time departure. An MRO director means weeks in a repair bay. These are fundamentally different clocks, and collapsing them into one KPI hides the problem instead of revealing it.
| Metric | What it measures | Typical time scale | Common mistake |
|---|---|---|---|
| Gate turnaround time | In-block to off-block at the airport stand | 25 to 90 minutes | Treating a scheduled target as achieved performance |
| On-time performance (OTP) | Whether a flight arrives or departs within a tolerance of schedule | Flight-level | Using OTP as a proxy for turn duration |
| MRO turnaround time | Time an aircraft, engine, or component spends in maintenance | Days to months | Comparing repair cycles with airport gate turns |
Cirium defines an on-time airline arrival as gate arrival within 14 minutes and 59 seconds of the published schedule. That threshold measures punctuality against the timetable, not the duration or quality of the ground process. An airline can post 90% OTP while its average gate turn runs 15 minutes over plan, simply because the schedule built in enough buffer. Conversely, a carrier with tight turn targets can execute perfectly on the ramp and still miss its departure slot due to ATC sequencing or weather.
On the MRO side, the scale is entirely different. Oliver Wyman reported that narrowbody engine repair turnaround times were regularly 180 to 200 days or more for many operators. If someone in your organization says “our turnaround is 190 days,” they are not discussing Gate B7. These metrics need separate dashboards, separate owners, and separate improvement programs.
Anatomy of a Gate Turn: 100 Tasks, One Critical Path
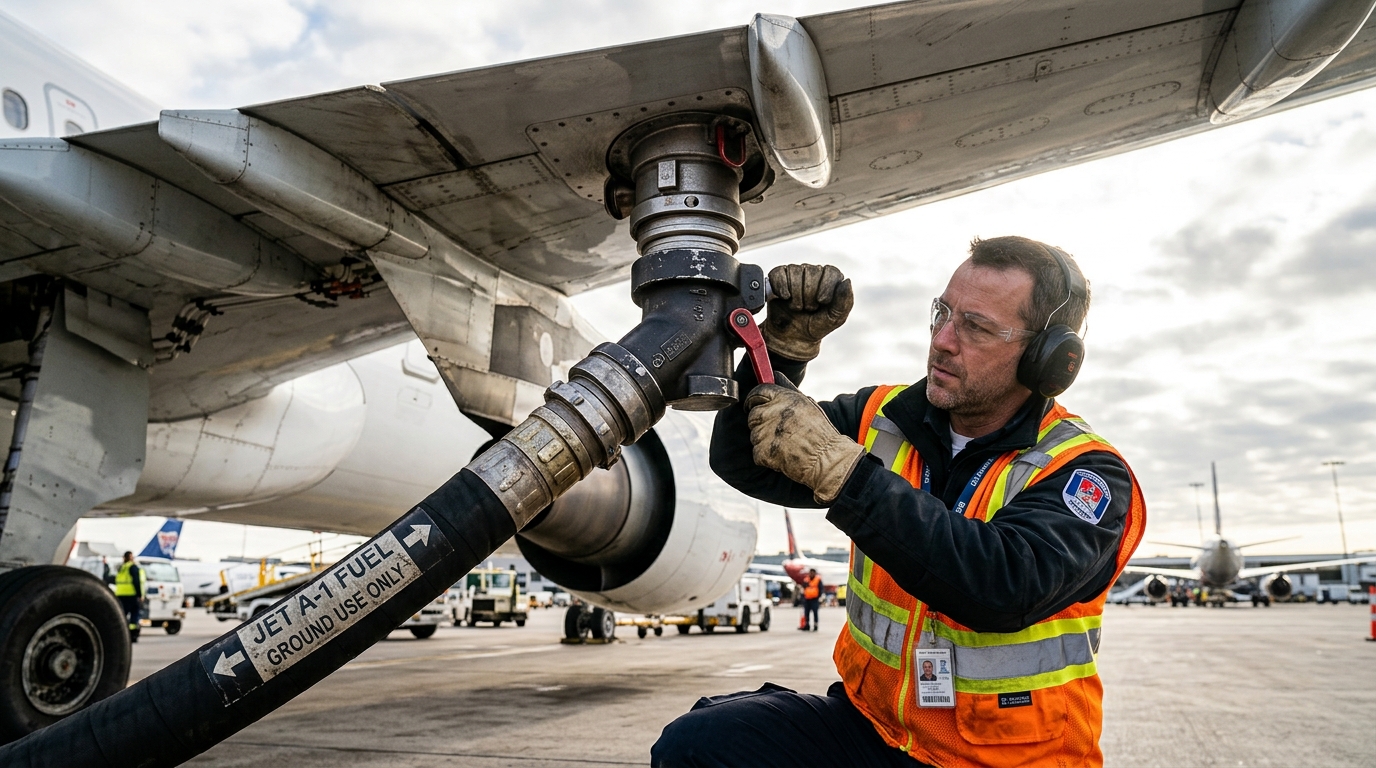
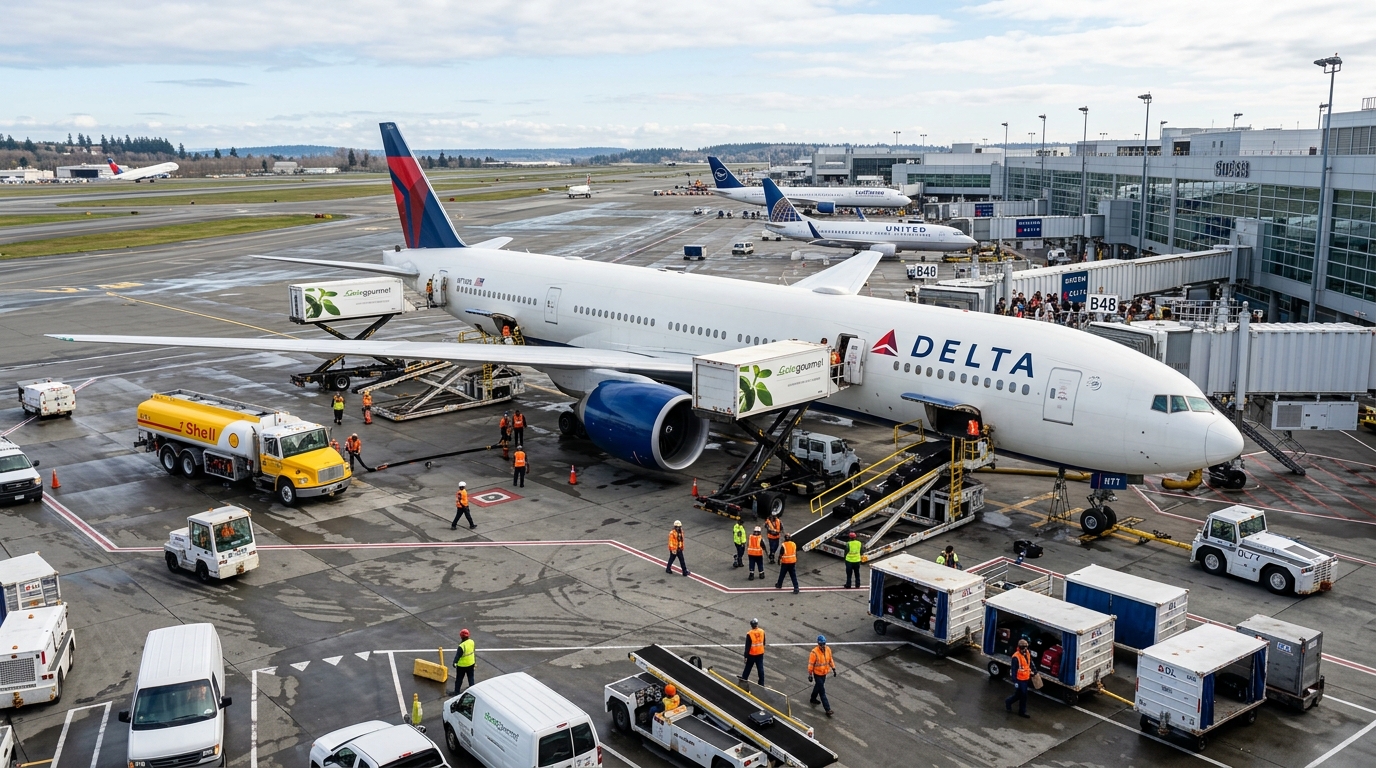
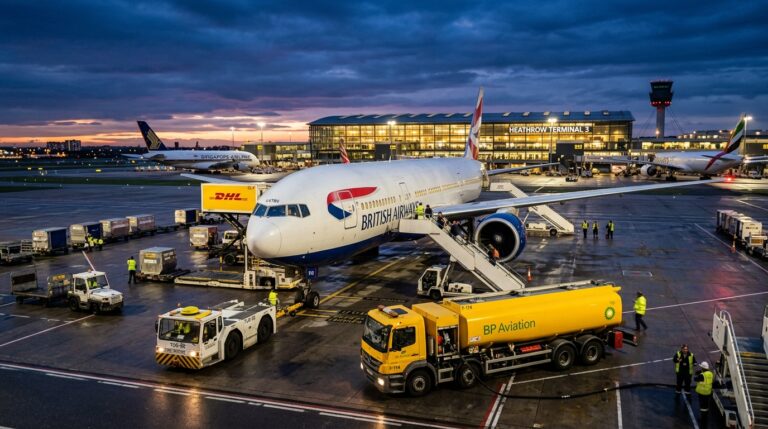
A standard gate turn involves disembarkation, cabin cleaning, catering, cargo and baggage unloading and loading, refueling, water and waste servicing, passenger boarding, safety checks, and pushback. Depending on the airport, aircraft type, and route, add de-icing, crew changes, security sweeps, or accessibility services. FAA Advisory Circular AC 00-34B provides guidance for aircraft servicing, ground handling, and marshalling, while noting that its content is not all-inclusive and does not override local airport requirements.
The performance of a turn depends on how these tasks are sequenced. Some run in parallel: fueling, cleaning, and catering can happen simultaneously. Others are strictly sequential: you don’t board passengers while deep cleaning is in progress. The critical path is the longest chain of sequential dependencies. No turn can ever be shorter than that chain, regardless of how fast the parallel activities complete.
Southwest Airlines executed 10-minute turns starting in 1972, when the airline operated three aircraft and needed every minute of utilization. Vice President Bill Franklin studied racing pit crews and mapped the work into a coordinated, all-hands operation. Over 100 tasks had to complete in parallel, and a single delay could break the sequence. Southwest later acknowledged that regulation, security, and operational complexity made that exact target impossible. By 2019, they were testing handheld baggage scanners, mobile gate readers, and dual-door boarding to preserve fast coordination within a far more complex environment.
The lesson isn’t “copy the 10-minute turn.” It’s that turnaround performance is a process-design problem, not a motivation problem. Parallelize what you can. Make handoffs visible. Treat idle aircraft as a system cost.
OAG cites Boeing research estimating that cutting a typical point-to-point turn from 40 to 30 minutes could increase utilization by 8%. That is an enormous number in an industry where fleet costs dominate the balance sheet. But the same analysis cautions that the financial value depends on route pattern, fuel price, financing, and load factor. A 10-minute reduction that creates reliability problems wipes out the utilization gain.
What Actually Delays the Turn
Ask most ground ops managers what causes late turns, and you’ll hear “late inbound.” They’re not wrong. But that answer hides the structure of the problem.
In January 2026, average European departure delay was 18.1 minutes per flight, up 3.4 minutes year over year, with 8.4 minutes attributed to reactionary delay. Reactionary delay is delay caused by the late arrival of the aircraft, crew, or passengers from a previous flight. It is the largest single delay category in European aviation, and it has almost nothing to do with what happens on the ramp. Yet it directly compresses the available turn time.
Beyond late inbounds, turn delays cluster around a few recurring sources.
Equipment positioning is one of the most underestimated. Ground support equipment (tugs, belt loaders, air conditioning units, passenger stairs) needs to be at the right stand at the right time. When a tug is three gates away or a belt loader is stuck behind a catering truck, the clock runs. Most airports have no real-time visibility into where their GSE fleet actually is. Equipment gets “borrowed,” reassigned, or simply lost in a ramp environment with hundreds of moving assets. I’ve watched ramp teams spend 5 to 8 minutes locating a single piece of equipment that was supposed to be staged at their gate. That search time doesn’t get its own IATA delay code. It just disappears into the turn.
Baggage and cargo handling is another persistent source. Industry data for 2026 puts total baggage mishandling cost at $6.3 billion, with transfer bags accounting for 39% of all mishandling. A late bag isn’t just a customer service issue. It is a gate hold, a delayed departure, and a potential reactionary delay on the next leg. At transfer-heavy hubs, baggage timing is often the binding constraint on the critical path.
Catering and cleaning windows compress when a flight arrives late. The scheduled crews may have already moved to another aircraft. Rescheduling introduces a secondary delay that doesn’t appear in the “late inbound” code but is a direct consequence of it.
Then there’s the delay nobody codes: the 3-to-5-minute gap where the ramp coordinator doesn’t know the current status of a task. Is fueling complete? Has the last bag been loaded? Is the wheelchair passenger boarded? Without real-time status on every milestone, the coordinator either waits (adding delay) or calls the start of boarding prematurely (risking a door-close hold). That gap is a visibility problem, and it persists even at well-run stations.
Technology That Moves the Needle (and Claims That Don’t)
Four categories of technology are actively deployed against turnaround delay. They solve different parts of the problem, and none replaces the others.
Airport Collaborative Decision Making (A-CDM)
EUROCONTROL’s A-CDM specification connects airlines, ground handlers, airport operators, ATC, and the network manager through shared operational data. The central concept is Target Off-Block Time (TOBT): a shared estimate of when an aircraft will be ready to leave the stand. When TOBT is accurate, ATC sequences departures more efficiently and all partners work toward the same target instead of separate assumptions.
A-CDM is not software you buy off the shelf. It is a process architecture that requires all five stakeholders to share timely, accurate information. The specification covers turnaround processes, de-icing coordination, and performance measurement. Implementation is difficult because it depends on the weakest data link in the chain. But where it works, it replaces five separate guesses with one shared clock.
AI Computer Vision
Camera systems on the apron detect and timestamp ramp events: aircraft arrival, service vehicle positioning, door operations, boarding start, pushback. The value is shifting from post-mortem delay reports to real-time alerts when a milestone is at risk.
A 2025 report covering more than 450,000 AI-enabled turns at 15 airports reported a 25% reduction in departure delays at participating airports. In Europe, those airports averaged departure delays six minutes below the 18-minute regional average, with nearly $600 in savings per turn.
These figures deserve careful reading. The report is vendor-associated. Published materials don’t establish that participating airports had the same baseline flight mix, weather, staffing, or ATC constraints as comparison airports. The projected $900 million in annual airline gains by 2035 is a modeled scenario, not realized savings. If you are evaluating this technology, demand the airport-level methodology, time window, exclusion rules, and an independent validation period.
Deployments are expanding. Heathrow’s 2025 annual report described its Terminal 5 camera network as improving aircraft turnaround performance and supporting more punctual departures, with plans to scale across 116 gates. Vancouver International Airport announced a phased deployment of camera-based event detection, connecting to its digital twin for end-to-end analysis. Neither has published a controlled before-and-after comparison. Deployment evidence is real. Measured causal impact is still emerging.
Ground Equipment Visibility and Asset Tracking
This is the layer most turnaround conversations miss entirely. Airlines and airports invest in cameras, dashboards, and scheduling tools. Then a turn runs late because the belt loader was parked at a gate 400 meters away and nobody knew.
Real-time tracking of GSE (tugs, loaders, stairs, GPUs, air start units) addresses one of the most common and least measured delay sources. When every piece of equipment carries a location-aware tracker, the ramp coordinator sees which assets are available and where, not which assets are supposed to be there according to yesterday’s plan.
The same principle applies to ULDs (unit load devices), dollies, and other reusable containers moving between aircraft, warehouses, and stations. A ULD pool with no visibility behaves like an infinite black hole: you keep buying more because you can never find what you already own. Tracking turns a pool management problem into a logistics optimization problem.
The technology is field-proven. Cellular and GNSS asset trackers with multi-year battery life can be deployed on GSE and ULDs without wiring or infrastructure changes. The ROI math is direct: fewer lost assets, fewer replacement purchases, shorter equipment search times, and tighter turns.
Resource Optimization
Planning and allocation tools use operations research and AI to schedule ground-handling staff and equipment against planned and disrupted flight schedules. They solve a different problem than cameras: ensuring the right number of people and vehicles are planned for each turn, and re-planning when disruptions hit.
A camera tells you fueling started four minutes late. A resource planner prevents that by allocating the fuel truck to the right stand at the right time. The two systems are complements, not substitutes.
Electrification on the Ramp
Swissport reported that 26.3% of its global motorized GSE fleet was electric at the end of 2025, targeting 55% by 2032, with autonomous electric vehicle trials planned for 2026. Evaluate this through a turnaround lens: electric GSE has different charging requirements, positioning logistics, and failure modes than diesel equipment. Sustainability benefits are real. Impact on turnaround predictability needs separate measurement.
Building a Turnaround Performance Program
If you’re reading this because your turns are unpredictable, here’s the sequence I’d recommend based on what I’ve seen work across dozens of aviation deployments.
First, define which clock you’re optimizing. Gate occupancy, process readiness, departure punctuality, and MRO downtime have different owners and different levers. A single “turnaround KPI” obscures accountability.
Second, map milestone owners. For every step in your turn (disembark, clean, cater, fuel, load, board, push), name the organization responsible and the data source that confirms completion. If you can’t name both, you have a visibility gap.
Third, establish a baseline by station and aircraft type. A 737 turn at a domestic hub and an A330 turn at an international outstation are not the same process. Aggregate averages hide the worst performers. Measure distributions, not just means. Standard deviation tells you more about reliability than average turn time ever will.
Fourth, separate controllable from uncontrollable delay. Reactionary delay, weather, and ATC restrictions are real, but your ramp team cannot fix them. Dashboards that isolate ground-controllable delay let you measure what your teams actually influence.
Fifth, invest in visibility before optimization. You cannot optimize a process you cannot see. Before committing to AI cameras or scheduling tools, answer two questions: do we know where our GSE is right now? Do we know which tasks are complete in real time? If the answer to either is no, start there. The data foundation has to exist before analytics can deliver.
Sixth, report variability alongside averages. A station with a 32-minute average turn and a 4-minute standard deviation is reliable. A station with the same 32-minute average and a 12-minute standard deviation is not. The second station forces schedule buffers, and buffer time is where utilization goes to die.
And always: keep safety as the floor. FAA AC 00-34B exists for a reason. Marshalling, fueling, towing, and passenger movement have safety requirements that do not flex for a tighter target. The goal is safe, repeatable predictability. Not the shortest possible turn regardless of conditions.
At Datanet, we work with airlines, MROs, and ground handlers to close the visibility gap on the ramp. From GSE and ULD tracking to airfreight-approved devices like the Thingfox T2 (DO-160 certified), we build the asset tracking layer that turnaround optimization depends on. If your equipment pool goes invisible the moment it leaves the warehouse, that’s the gap worth closing first. Talk to our team.
Frequently Asked Questions
What is aircraft turnaround performance?
It measures how reliably and quickly an aircraft completes required ground processes between arriving at a gate (in-block) and departing for its next flight (off-block). It is distinct from on-time performance, which compares actual flight times to published schedules, and from MRO turnaround time, which measures days or months in a repair facility.
What is a good aircraft turnaround time?
There is no universal benchmark. Turn time depends on aircraft type, airport, route, carrier procedures, and service requirements. Southwest’s 10-minute turn was a specific historical model the airline later acknowledged was no longer achievable. The right target is the shortest reliable turn your specific operation can sustain safely.
What causes most turnaround delays?
In Europe, reactionary delay (from late inbound aircraft, crew, or passengers) accounts for 8 to 10 minutes of average departure delay per flight. Ground-controllable delays commonly stem from equipment positioning, baggage handling, catering timing, and gaps in real-time data between ramp partners.
Can AI reduce turnaround delays?
AI computer vision can improve event visibility and enable earlier intervention when milestones slip. A 2025 vendor-associated report covering 450,000+ turns reported a 25% departure delay reduction, but the figure is not from a controlled trial. Demand airport-specific baselines and transparent methodology before building a business case around vendor benchmarks.
Is turnaround time the same as on-time performance?
No. Turn time is ground time at the gate. On-time performance measures whether a flight arrives or departs within a tolerance of schedule (typically 15 minutes). A fast turn can still produce a late departure if the inbound flight arrived late. A slow turn can still be “on time” if the schedule included enough buffer.
How does ground equipment tracking improve turnaround performance?
Real-time GSE tracking eliminates search time when tugs, belt loaders, or stairs are not at their expected position. It also supports better pool management for ULDs and reusable containers. When every asset carries a location-aware tracker, ramp coordinators allocate based on actual availability rather than assumptions or radio calls.




 +1 508 292 2210

3 Responses