

Most asset tracking dashboards I’ve seen in the field share the same flaw: too many numbers, too few decisions. A logistics VP once walked me through a screen with 47 KPIs. I asked which three drove his last budget approval. He couldn’t name one.
That’s the gap. Not a data problem. A relevance problem. If you’re searching for asset tracking key performance indicators, you probably have trackers deployed already (or you’re about to). The real question is which metrics earn their place on the dashboard and which ones just make your quarterly report look busy while nobody acts on them.
Below is the framework I use with clients across aviation, logistics, and industrial operations. Not a catalog of everything you could measure. A hierarchy of what you should measure, in what order, and the benchmarks that separate “tracking things” from “tracking value.”
Two KPI Layers Most Teams Confuse
Here’s a distinction that rarely shows up in vendor literature but changes how you build your dashboard.
Layer one measures your tracking system. Read rate, location accuracy, update frequency. These tell you whether the infrastructure is doing its job. If your RFID read rate is 82% instead of 99%, every metric downstream (utilization, loss rate, cycle time) inherits that 18% error. Classic garbage-in problem.
Layer two measures the asset itself. OEE, MTBF, MTTR, availability. These metrics exist whether or not you have tracking technology. But without reliable layer-one data feeding them, they’re estimates dressed up as measurements.
Most KPI guides skip straight to layer two. They hand you OEE targets without asking whether your tracking system can produce the data OEE requires. That’s like optimizing a recipe while your scale is broken.
A functional dashboard stacks both layers. When OEE drops, you check whether the tracking system’s read rate dropped first. If it did, the problem is your infrastructure, not your maintenance team. If it didn’t, now you have a real operational signal worth acting on.
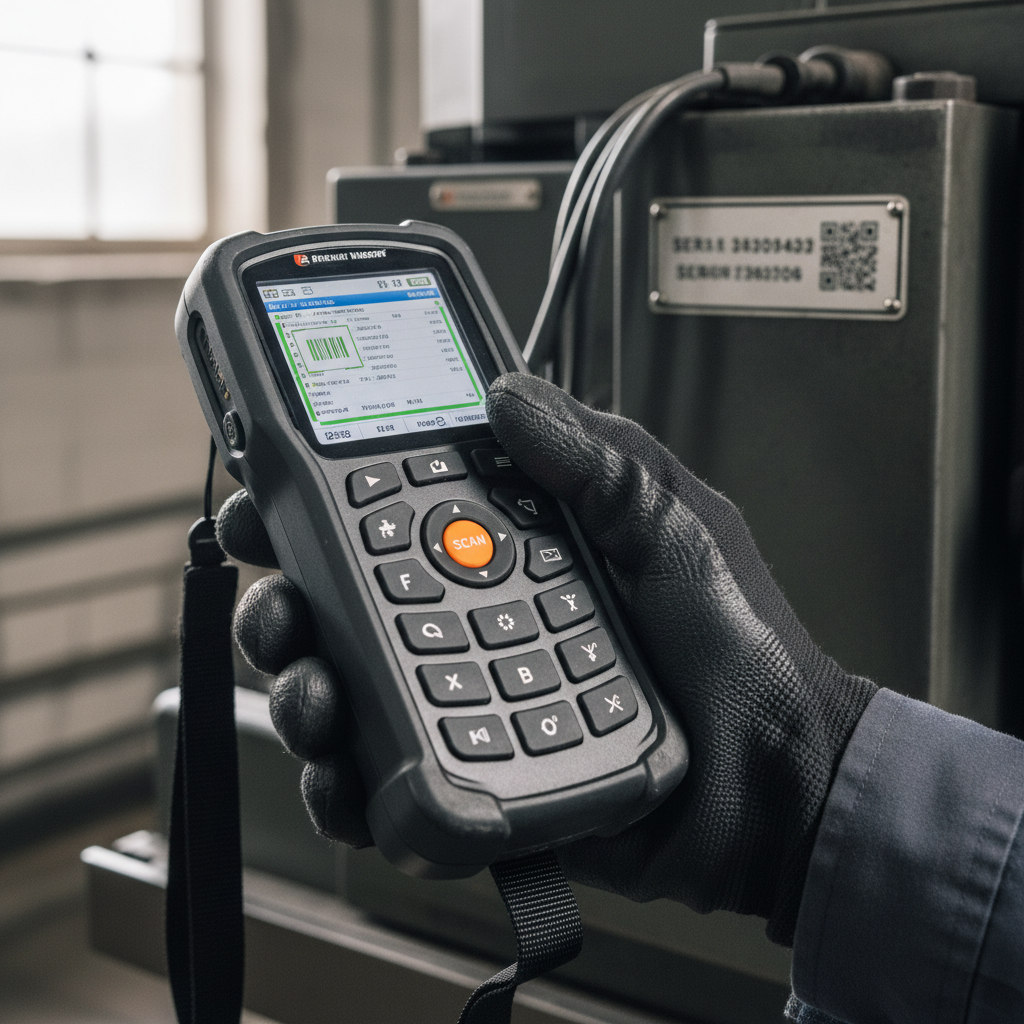
Tracking System KPIs: The Foundation Everyone Skips
Four metrics tell you whether your tracking infrastructure is trustworthy enough to build on.
Read rate (%). The percentage of tagged assets your system successfully identifies during a scan cycle. Passive RFID programs should target 99%+ on standardized workflows like receiving and cycle counts. BLE-based systems in warehouses typically hit 95-98%. Below 90%, your downstream KPIs are unreliable. Don’t build a performance framework on a cracked foundation.
Location accuracy is the second metric, and it’s measured differently depending on your technology: centimeters for UWB, meters for GPS, “room-level” or “zone-level” for BLE. The number itself matters less than whether it matches your operational need. A ground support equipment yard at an airport doesn’t need centimeter precision. An MRO tool crib does. Define the accuracy threshold your operation requires before you evaluate the measurement.
Location update frequency. How often the system refreshes an asset’s position. Real-time (sub-minute) for high-value mobile assets. Hourly or daily for static equipment parked in known locations. The cost of higher frequency is battery life: a GPS tracker pinging every 10 minutes drains in months. One pinging once a day can run 10+ years on a single battery. Every frequency decision is a battery-life trade.
Then there’s Mean Time to Locate (MTTL), which answers a simple question: how long does it take someone to physically find a tracked asset after the system says “it’s there”? Well-run programs report a 60-80% reduction in MTTL after deploying tracking. In hospital settings, RTLS deployments have cut search time by up to 90%. In aviation MRO, where a missing torque wrench can ground a maintenance task, even a 50% MTTL improvement translates directly to fewer delayed departures.
Reliability KPIs: Is Your Asset Earning Its Keep?
Once your tracking system feeds clean data, these metrics reveal how the assets themselves perform.
Overall Equipment Effectiveness (OEE) collapses three dimensions into one number: Availability x Performance x Quality. World-class OEE sits at 85% or higher. Most organizations I’ve worked with start in the 55-65% range. OEE is powerful for trending, less useful for diagnosis. When it drops, you decompose it back into its three components to find the root cause.
Mean Time Between Failures (MTBF) tracks the average operating time between unplanned breakdowns. Higher is better. But track MTBF per asset class, not as a fleet-wide average. A fleet average of 2,000 hours tells you nothing useful if one population of ground power units fails at 400 hours while another runs to 5,000.
Mean Time to Repair (MTTR) is the average duration from failure detection to return-to-service. This KPI improves almost immediately with tracking: when the system tells maintenance exactly where the failed asset sits, technicians spend less time searching and more time fixing. That’s the MTTL connection in practice.
Asset Availability measures the percentage of time an asset is ready for use. The target for critical assets: 90%+. In aviation ground operations, GSE availability below 85% during peak hours forces airlines to rent replacement equipment at surge pricing. The cost of that single metric being off is quantifiable in dollars per flight hour.
Finally, Planned Maintenance Percentage (PMP) is the ratio of planned to total maintenance work orders. World-class range: 70-85%. Below 50% means your team lives in reactive mode, chasing failures instead of preventing them. Tracking data lifts PMP by triggering maintenance on actual usage cycles rather than calendar intervals.
Financial KPIs: The Numbers the CFO Reads
Operational metrics justify the maintenance budget. Financial metrics justify the tracking investment itself. These are the numbers that survive a board meeting.
The ratio of maintenance spend to replacement asset value (Maintenance Cost % of RAV) is the clearest indicator of fleet health economics. World-class programs run at 1-3% of RAV; anything above 5% signals a reliability problem where you’re spending more to keep the asset alive than replacement economics warrant. Without tracking data feeding accurate utilization hours, this metric is a guess.
Asset Loss and Shrinkage Rate (%) is the KPI that builds the business case fastest. Organizations moving from manual management to software-based tracking report a 90% reduction in asset loss. In healthcare, RTLS deployments deliver 30-50% cuts in loss and theft, recovering $300K to $500K annually per facility.
Utilization Rate tracks how much of an asset’s available time it spends in productive use. The target for critical equipment: 70-85%. This is the metric that reveals hidden fleet oversizing. If your container pool utilization sits at 40%, you own (or lease) roughly twice as many containers as you need. Every untracked container sitting idle at a port is capital doing nothing.
Inventory Accuracy measures the match between what your system says you have and what physically exists. Target: 95%+. Below that, procurement overbuys to compensate, and audit cycles eat team hours. For checkpoint-driven counts, a barcode asset tracking system is often the simplest fix, and companies adopting tracking software report 50-70% reductions in audit time.
ROI Payback Period closes the loop. Mid-market deployments typically pay back in 6-18 months. Healthcare RTLS often hits sub-12-month payback because the loss problem is severe enough to generate fast returns. The longer the payback window, the more likely the program gets killed before it proves itself. If your projected payback exceeds 18 months, revisit which KPIs you’re measuring: you may be tracking too many things that don’t convert to financial outcomes.
How Technology Choice Shapes Your KPI Ceiling
The technology you deploy determines which KPIs you can even measure with confidence. Choosing GPS and then expecting centimeter-level indoor accuracy isn’t an implementation failure. It’s a design error. If you’re still weighing which to deploy, this breakdown of RFID vs GPS asset tracking explains where each technology fits and where it doesn’t.
| Technology | Accuracy | Range | Best For | KPI Strength |
|---|---|---|---|---|
| Barcode / QR | Scan-dependent | Manual | Receiving, retail | Inventory accuracy at checkpoints |
| Passive RFID | 99%+ read rate | 1-5 m | Warehouse, toll, bulk scans | Read rate, cycle-count speed |
| BLE | 1-3 m | Up to 100 m | Indoor healthcare, IT rooms | Room-level presence, MTTL |
| UWB RTLS | 10-30 cm | 10-50 m | High-value indoor, MRO | Precise location, dwell time |
| GPS/GNSS | 3-5 m outdoor | Global | Fleet, containers, geofencing | Geofence compliance, cycle time |
| LoRaWAN | Zone-level | 2-15 km | Industrial yards, agriculture | Presence detection, battery KPI |
For outdoor container and equipment tracking (ULD pools, GSE, reusable transport assets), GPS/GNSS with cellular connectivity hits the sweet spot of accuracy, coverage, and battery life. Devices like the Oyster3 or Oyster Edge are built for exactly that profile: multi-year battery, global coverage, weatherproof housing.
For airfreight containers that move between temperature-controlled environments and cargo holds, the device needs DO-160 certification to fly legally on commercial aircraft. This matters most in pharmaceutical air cargo tracking, where temperature excursions carry serious cost. The Thingfox T2 holds that certification, which is why we deploy it across airline and freight-forwarder operations.
The point is not the hardware. It’s the fit between hardware capability and KPI requirement. Pick the KPI threshold first. Then pick the technology that measures it reliably within your budget and battery constraints. If payback is your priority, this guide to asset tracking technologies that pay back shows which options deliver measurable returns.
The Maturity Sequence: What to Measure First
You don’t need all these KPIs on day one. Trying to measure everything simultaneously is one of the fastest ways to kill a tracking program before it proves value. Here’s the sequence that works in practice.
Phase 1 (months 1-3): Prove the data is clean. Focus exclusively on tracking system KPIs: read rate, location accuracy, MTTL. If these are unstable, nothing else matters. This is also when you discover tagging gaps, zones with poor signal coverage, and firmware issues that affect data quality.
Phase 2 (months 3-9): Connect tracking to operations. Add utilization rate and inventory accuracy. These two metrics alone justify most tracking investments because they expose idle assets and phantom inventory. Industry case studies show manufacturing operators using RTLS reporting a 10-20% utilization lift, translating to significant six-figure savings on multi-million-dollar tool fleets.
Phase 3 (months 9-18): Layer in reliability. Introduce OEE, MTBF, MTTR, and PMP. By this point you have enough historical tracking data to compute baselines, set targets, and run before-and-after comparisons. The conversation shifts from “we track things” to “tracking reduced unplanned downtime by X%.”
Phase 4 (year 2+): Financial and predictive. Add Maintenance Cost % of RAV, loss prevention rate, and ROI payback period. Start exploring predictive KPIs: AI-driven failure risk scores, digital-twin synchronization metrics. This is the layer where AI and digital-twin frameworks start earning their budget, because only now do you have the historical data they need to generate useful predictions.
The companies I see succeed are the ones that resist the temptation to boil the ocean on launch day. Two or three metrics per phase. Get them stable. Then expand.
Three Mistakes That Kill KPI Programs
Measuring the technology instead of the outcome. I’ve seen dashboards where “number of GPS pings per day” is the primary KPI. That’s an infrastructure health check, not a business metric. If your CEO asks “how’s asset tracking going?” and the answer is “we got 14,000 pings today,” you’ve already lost the conversation. Translate pings into utilization, loss prevention, or cycle time reduction.
No single owner. When KPIs are “shared” across maintenance, operations, and finance, nobody owns the number. The metric drifts, the dashboard goes stale, and six months later someone asks why the company spent $200K on trackers with no visible return. Every KPI needs one name attached to it. Not a department. A person.
Skipping the tracking-system layer. This loops back to the distinction at the top of this article. If your OEE drops from 78% to 71%, and you don’t know whether that reflects a real performance decline or a tracking system read-rate issue, you’ll make the wrong intervention every time. Check layer one before you act on layer two.
When the KPI program is built right, three outcomes show up on the balance sheet:
- Asset loss drops 30-50% within the first year, recovering six figures in capital previously written off.
- Utilization lifts 10-20%, which means fewer leased replacements and smaller purchase orders for new equipment.
- Audit cycles compress 50-70%, freeing ops teams for work that generates revenue instead of paperwork.
If your asset pool feels invisible once it leaves the warehouse, or your maintenance crew spends more time searching than fixing, those are the gaps a properly instrumented KPI program closes. Before you commit to metrics, it helps to understand the common asset tracking challenges that derail deployments. We build these systems for aviation, logistics, and industrial operators. Talk to our team or browse the asset tracking device catalog to see what fits your operation.

Frequently Asked Questions
What are the most important KPIs for asset tracking?
Start with three: tracking system read rate (99%+ target for RFID), asset utilization rate (70-85% for critical assets), and inventory accuracy (95%+). These expose idle assets, phantom inventory, and data quality problems. Add OEE, MTBF, and financial metrics only after the foundational data is stable.
How do you calculate asset tracking ROI?
Compare total deployment cost (hardware, software, installation, training) against measurable savings: reduced asset loss, lower rental and replacement spend, fewer audit hours, and decreased unplanned downtime. Mid-market deployments typically pay back in 6-18 months. Healthcare and aviation programs, where loss and downtime penalties are steep, often see sub-12-month payback.
What is the difference between asset tracking KPIs and asset management KPIs?
Asset tracking KPIs (read rate, location accuracy, update frequency) measure whether your tracking system works. Asset management KPIs (OEE, MTBF, MTTR, availability) measure the asset itself. Both layers belong on the same dashboard, but tracking KPIs must be reliable before management KPIs can be trusted.
Which tracking technology produces the best KPI data?
No universal best exists. GPS/GNSS covers outdoor fleet and container tracking globally. UWB delivers centimeter accuracy for indoor high-value assets. Bluetooth asset tracking offers room-level presence at lower cost. Passive RFID excels at high-volume checkpoint scans. Match technology to KPI accuracy requirements, not the other way around.
How long before an asset tracking KPI program shows results?
Data validation takes 1-3 months. Operational improvements like utilization gains typically appear in months 3-9. Full financial visibility, including maintenance cost reduction and loss prevention, emerges between months 9-18. Trying to measure everything from day one is the most common cause of early program failure.
What is a good OEE benchmark for tracked assets?
World-class OEE is 85% or higher. Most organizations begin between 55-65%. Track OEE per asset class rather than as a fleet average, because an acceptable average can hide subpopulations of assets failing at unacceptable rates.






 +1 508 292 2210
