

In July 2024, a single software update from a cybersecurity vendor took down an estimated 8.5 million Windows devices worldwide. The system designed to protect infrastructure in real time became the threat. That event carries a lesson worth more than any vendor brochure: real-time monitoring is not about speed alone. It is about converting fresh data into the right action before the window closes.
Whether you run a fleet of containers across three oceans, a network of Kubernetes clusters, or a ground support operation at a major airport hub, the mechanics are the same. Sensors, agents, and instruments generate a stream of observations. Something (or someone) must decide which observations demand attention now, which can wait, and which are noise. Get that filtering wrong, and you end up with 500 open alerts and zero situational awareness.
This guide breaks down what real-time monitoring actually requires, how the architecture works, where it delivers measurable ROI, and why the biggest failure mode in 2026 is not missing data. It is drowning in it. For teams evaluating remote monitoring solutions, this distinction is where success or failure begins.
What Real-Time Monitoring Actually Means
Real-time monitoring is the continuous analysis of telemetry delivered with low enough latency that the observation can drive an action while the underlying event is still operationally relevant. That definition is more useful than most because it ties the concept to a decision, not to a refresh rate.
A dashboard updating every five seconds is not real-time monitoring if nobody looks at it. A sensor reading arriving 30 seconds late is real-time if a technician can still reroute before a container misses its connection. The word “real-time” describes the relationship between when something happens and when you can still do something about it.
This is where confusion starts. The latency that qualifies as “real-time” depends entirely on the decision it supports:
| Use case | Acceptable latency | Decision it enables |
|---|---|---|
| Payment fraud scoring | <100 milliseconds | Approve or decline a transaction |
| IT incident detection | 1 to 10 seconds | Page the on-call engineer |
| Industrial equipment health | 1 to 60 minutes | Schedule or escalate maintenance |
| Physical asset tracking | 5 to 30 minutes | Reroute, recover, or rebalance a pool |
| Environmental monitoring | 15 to 60 minutes | Trigger containment or evacuation |
The practical vocabulary breaks into four telemetry types. Metrics are numerical measurements aggregated over time: CPU load, cycle counts, temperature. Logs capture event records with context: error messages, state changes, access events. Traces follow a request or object across distributed systems or physical locations. Profiles sample execution behavior inside a process, showing where resources get consumed.
Most organizations start with metrics and logs. Grafana’s 2025 survey of 1,255 practitioners found 95% collected metrics and 87% collected logs, but only 57% used traces and 16% used profiles. The drop-off is not ignorance. It reflects instrumentation effort, storage cost, and skills gaps.
One distinction worth making early: monitoring and observability are not the same thing. Monitoring checks whether known conditions are healthy and fires alerts when they are not. Observability is broader. It uses all four telemetry types to explain why a system behaves a certain way, even for conditions you never anticipated. Monitoring is one practice inside a wider observability program.
How the Architecture Works
Strip away vendor marketing, and every real-time monitoring system follows the same five-layer feedback loop.
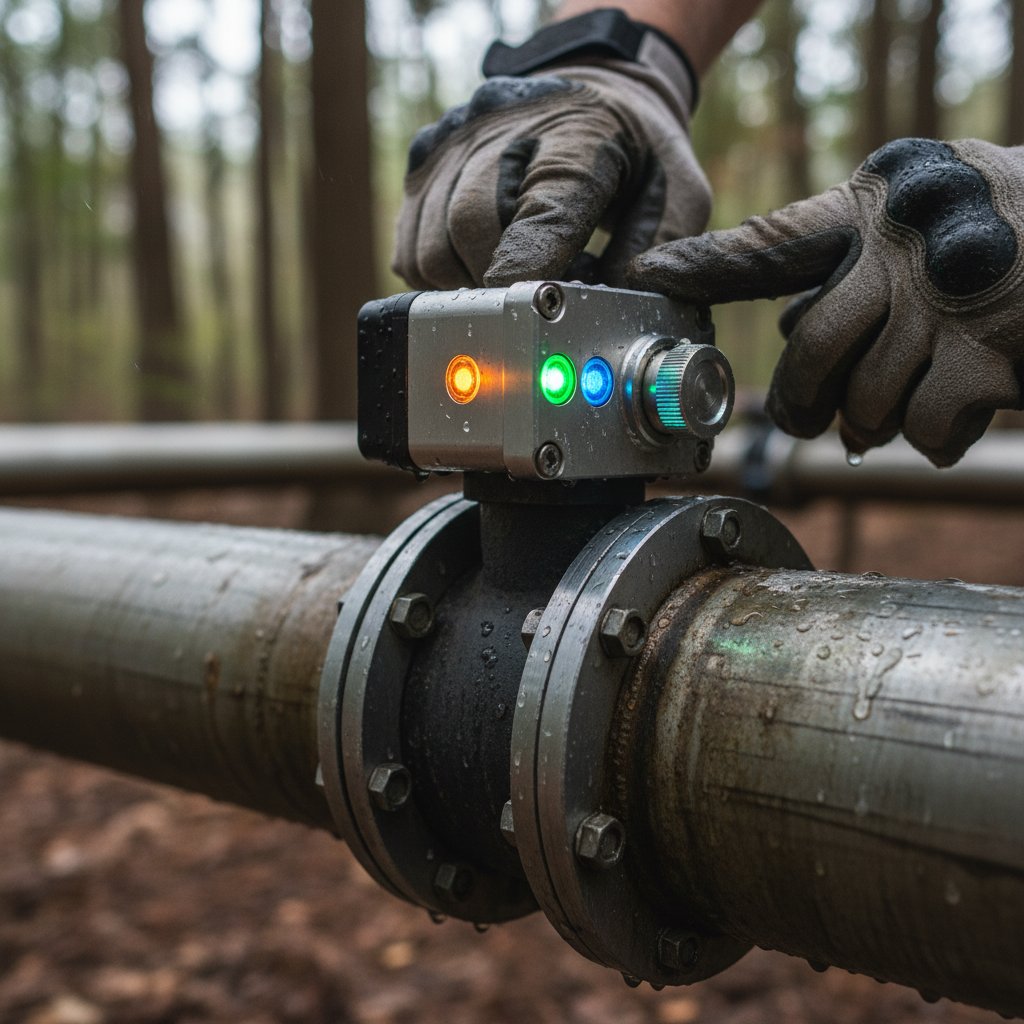
1. Instrumentation and collection. Something generates the observation. In software, that is an SDK, agent, or host collector. In the physical world, it is a GPS tracker on a ULD, a vibration sensor on a compressor, a temperature probe in a pharma shipment, or an RFID gate at a warehouse dock. The quality of everything downstream depends on what you instrument and how often it reports.
2. Transport. The observation travels from source to processor. HTTP, gRPC, MQTT, Kafka, cellular, satellite, LoRaWAN. Push protocols (the device sends when it has something) work better for event-driven scenarios. Polling (the system asks at intervals) suits periodic state checks and legacy compatibility.
3. Processing. Raw data becomes useful signal here. Processors validate schemas, strip sensitive information, aggregate, sample, deduplicate, and enrich with identity or location context. OpenTelemetry, the vendor-neutral instrumentation standard, builds this into its Collector architecture with receivers, processors, and exporters chained into pipelines. That modularity matters because it means you can change your storage or analysis backend without re-instrumenting thousands of devices.
4. Storage and query. Time-series databases for metrics, log stores for events, trace stores for paths, and hot/cold tiers that trade query speed against retention cost. This is where most budgets spiral. More data at higher frequency costs more to store and query. Most of it will never be looked at.
5. Detection and action. Thresholds, baselines, rules, anomaly detection, or ML models generate alerts, tickets, automated controls, or dashboard views. An alert that is not actionable is not an alert. It is a distraction.
Google’s Site Reliability Engineering practice formalizes the detection layer with four “golden signals”: latency, traffic, errors, and saturation. The framework forces you to monitor user-visible service health rather than indiscriminately collecting everything a sensor can report. Google’s own guidance warns that per-second measurements can be expensive to collect, store, and analyze, and that every alert page should be actionable.
That last point is the one I see violated most often in field deployments. Teams instrument aggressively, set thresholds conservatively, and end up with hundreds of alerts per day. Within weeks, the operations team starts ignoring them all. At that point, you have a monitoring system that monitors nothing.
Where Real-Time Monitoring Delivers Measurable ROI
The concept scales from a single pump to a global payment network. Here are five domains where the return is documented.
Industrial maintenance. Siemens reported that Sachsenmilch Leppersdorf, a dairy processing facility running 365 days a year, used predictive maintenance to detect a faulty pump early enough to save an amount in the low six figures. The sensor data alone did not create that outcome. Connecting vibration readings to work orders, spare parts availability, and maintenance windows did. Prediction without execution is just an interesting chart.
Digital infrastructure. Netflix built Mantis, an on-demand event-stream platform that reduced mean time to detect from tens of minutes to a few seconds. The design insight was to subscribe to expensive, high-cardinality event streams only when needed, while keeping a low-cost baseline for routine health checks. Architecture shaped by economics, not just engineering ambition.
Payments and fraud. Visa’s published case with Emirates National Bank of Dubai claims $105 million in fraud-loss prevention across more than $40 billion in annual payment volume. Whether or not you take that specific number at face value (it is vendor-reported), the principle holds: millisecond-level scoring catches what batch analysis discovers too late.
Environmental detection. California’s ALERTCalifornia network, developed with UC San Diego, uses over a thousand AI-equipped cameras across the state. A July 2026 government statement says AI cameras detected over 900 fires on state lands before a single 911 call. Early awareness does not replace dispatch or suppression crews, but it works best when it sits inside a structured environmental monitoring plan. It buys minutes that save structures and lives, one reason the environmental monitoring market keeps expanding.
Physical asset tracking. This is my world. In aviation, a ULD (unit load device) that goes untracked after delivery is not a dashboard blind spot. It is capital sitting idle, or lost. The same applies to reusable containers in maritime logistics, ground support equipment on airport ramps, and MRO tooling that moves between hangars. Real-time location and condition data on these assets compresses cycle times, reduces replacement purchases, and eliminates the spreadsheet-and-phone-call search parties that still define daily operations at too many facilities.
Across all five domains, the pattern repeats. The value is not in the data stream itself. It is in the loop that closes: observation, interpretation, action, feedback.
The Alert Fatigue Problem
Here is the paradox at the center of real-time monitoring in 2026: organizations have never had more observability tooling, and they have never been more overwhelmed by it.
Grafana’s 2026 survey of 1,363 practitioners reports that 39% cite complexity as the leading obstacle, 38% cite noise, and 30% specifically identify alert fatigue. The same survey found organizations use an average of eight observability technologies. That is eight places to look when something breaks.
The mechanics are straightforward. A team sets conservative thresholds because missing a critical event feels worse than receiving a false alarm. Over time, the volume of non-critical alerts trains operators to treat all notifications as background noise. When the genuine emergency arrives, it is buried under 200 others. The monitoring system is technically working. Operationally, it is useless.
Google’s SRE practice addresses this directly: every page (their term for a high-priority alert) should require intelligent human action within a specific timeframe. If a page can be handled by a script, it should not be a page. If it happens so often that it becomes routine, the underlying problem should be fixed, not the threshold adjusted upward again.
The same logic applies to physical asset monitoring. I have seen operations teams disable geofence alerts within the first month because every routine vehicle movement triggered a notification. The fix is not fewer sensors. It is better rules: alert when ground support equipment leaves the airport perimeter, not when it moves between gates. Alert when a container has been stationary at a non-designated location for 48 hours, not every time it stops.
This is where 92% of respondents in the 2026 Grafana survey say they see value in AI surfacing anomalies before downtime. But 95% also say it is important for AI to show its reasoning. Trust without explainability is just automated noise from a fancier source. Effective asset monitoring and control requires both detection accuracy and actionable insights.
How to Start Without Disrupting Operations
The fastest way to kill a monitoring initiative is to instrument everything at once. I have watched it happen: a six-month rollout, 400 sensors deployed, a platform nobody configured properly, and within a quarter the whole project shelved because nobody could find signal in the data.
A better sequence:
Define the decision first. Before selecting hardware or software, write down the specific decisions you want the system to support. “Know where our ULDs are” is too vague. “Reduce ULD dwell time at outstations by 20% within six months” is a decision with a measurable outcome. Every sensor, threshold, and alert rule should trace back to a statement like this.
Start with four signals. Borrow Google’s golden signals framework. For a physical asset pool, the equivalents are: cycle time (latency), throughput (traffic), loss rate (errors), and utilization (saturation). These four will tell you whether your asset pool is healthy before you add layers of complexity.
Standardize instrumentation early. Whether you use OpenTelemetry for software or GPS/cellular trackers for physical assets, lock in the data schema before scaling. Changing how you label, timestamp, and attribute data after 10,000 devices are deployed is exponentially harder than getting it right at 50.
Budget for telemetry, not just hardware. The device is the cheapest part. Connectivity (cellular, satellite, LoRaWAN), data ingestion, storage, and query capacity are the recurring costs that surprise teams at scale. Plan retention tiers from day one: high-resolution data for the last 30 days, aggregated data for the last year, archived summaries beyond that.
Close the loop. Monitoring that generates insights nobody acts on is an expense, not an investment. Assign every alert class an owner, a response procedure, and a feedback mechanism. When a team ignores an alert category consistently, either fix the threshold or fix the underlying condition. Do not leave it in the queue as noise.
Real-Time Monitoring Is a Discipline, Not a Dashboard
The observability market is projected to reach $6.93 billion by 2031, growing at nearly 16% per year. The device count is climbing toward 21 billion active IoT connections in 2025. More tools, more sensors, more data is the default trajectory.
But the organizations that extract real value from real-time monitoring are not the ones with the most dashboards. They are the ones that defined what decisions the data should support, built the filtering to suppress noise, assigned ownership for every alert class, and measured outcomes in operational dollars: reduced downtime, shorter cycle times, lower loss rates, faster mean time to resolve.
Whether you are monitoring Kubernetes pods or tracking a pool of 2,000 reusable containers with industrial-grade asset trackers across 14 airports, the principle is identical. Fresh data only matters if someone (or something) can act on it before it goes stale.
If your asset pool feels invisible once equipment leaves your facility, that is exactly the gap real-time monitoring closes. Talk to our team or reach us at info@datanetiot.com.
Frequently Asked Questions
What is the difference between real-time and near-real-time monitoring?
Real-time monitoring delivers and analyzes telemetry while the underlying event is still actionable. Near-real-time accepts a bounded delay (typically seconds to minutes) for batching, transport, or processing. The right threshold depends on the decision: milliseconds for payment fraud, seconds for IT incidents, minutes for physical asset rerouting.
What should a company monitor first?
Start with the four golden signals from Google’s SRE framework: latency, traffic, errors, and saturation. For physical assets, the equivalents are cycle time, throughput, loss rate, and utilization. Define the decision each signal supports before expanding scope or increasing reporting frequency.
How does AI improve real-time monitoring?
AI can detect anomalies, correlate signals across systems, classify alerts by severity, and forecast failures. In Grafana’s 2026 survey, 92% of respondents said they see value in AI surfacing problems before downtime. The key constraint: 95% also said AI must explain its reasoning to be trusted in production.
What are the biggest risks of real-time monitoring?
Alert fatigue, false positives, runaway telemetry costs, data leakage from poorly secured sensors, vendor lock-in, and systemic risk when the monitoring infrastructure itself fails. The 2024 CrowdStrike outage proved that a trusted update distributed at speed can cause more damage than the threats it was built to prevent.
How much does real-time monitoring cost to implement?
Hardware (sensors, trackers, agents) is typically the smallest line item. Connectivity, data ingestion, storage, processing, and skilled personnel are the recurring costs that determine long-term spend. Budget by working backward from the decisions you need to support, not forward from the number of devices you can deploy.
How should we measure monitoring success?
Track detection latency, time to acknowledge, time to mitigate, false-positive rate, service-level-objective compliance, prevented losses, and telemetry cost per actionable incident. A monitoring system succeeds when it changes a decision or prevents harm, not when it fills the largest screen in the room.








 +1 508 292 2210

2 Responses