

About 40% of global greenhouse-gas emissions trace back to energy generation. If your organization buys electricity, steam, heat, or cooling from an external provider, a portion of those emissions belongs on your books. That is scope 2 emissions in one sentence.
Here is where most companies trip: the GHG Protocol does not accept a single Scope 2 figure. It requires two. One reflects the average carbon intensity of your local grid. The other reflects the energy products you chose to buy. Those two numbers almost never match. And the gap between them reveals more about a company’s real climate posture than either figure alone.
What Scope 2 Emissions Actually Cover
The GHG Protocol divides corporate emissions into three scopes. Scope 1 covers direct emissions from sources a company owns or controls: fuel burned in fleet vehicles, on-site boilers, backup generators. Scope 3 covers everything else across the value chain, from purchased materials to business travel to end-of-life treatment of sold products.
Scope 2 sits between the two. It captures indirect emissions from purchased or acquired electricity, steam, heat, and cooling. The operative word is “purchased.” If you combust natural gas in your own boiler, the emissions are Scope 1. If a utility burns that gas to generate the electricity you buy, those same emissions become Scope 2.
That boundary matters because Scope 2 is the category where procurement decisions carry the most direct leverage. Changing the carbon intensity of a supplier’s blast furnace (Scope 3) is slow and indirect. Changing which electricity product you buy, signing a power-purchase agreement, or installing rooftop solar sits comparatively within your control. That agency turns Scope 2 into both a genuine decarbonization lever and, when poorly handled, a vehicle for inflated claims.
The macro context adds urgency. The International Energy Agency reports that global energy-related CO2 hit a record 37.8 gigatons in 2024. Electrification is shifting more industrial and commercial activity onto power systems, which means the carbon intensity, timing, and procurement method behind each megawatt-hour now matter more than ever.
Location-Based vs Market-Based: Two Methods, Two Stories
This is where Scope 2 accounting becomes genuinely interesting, and where most confusion lives.
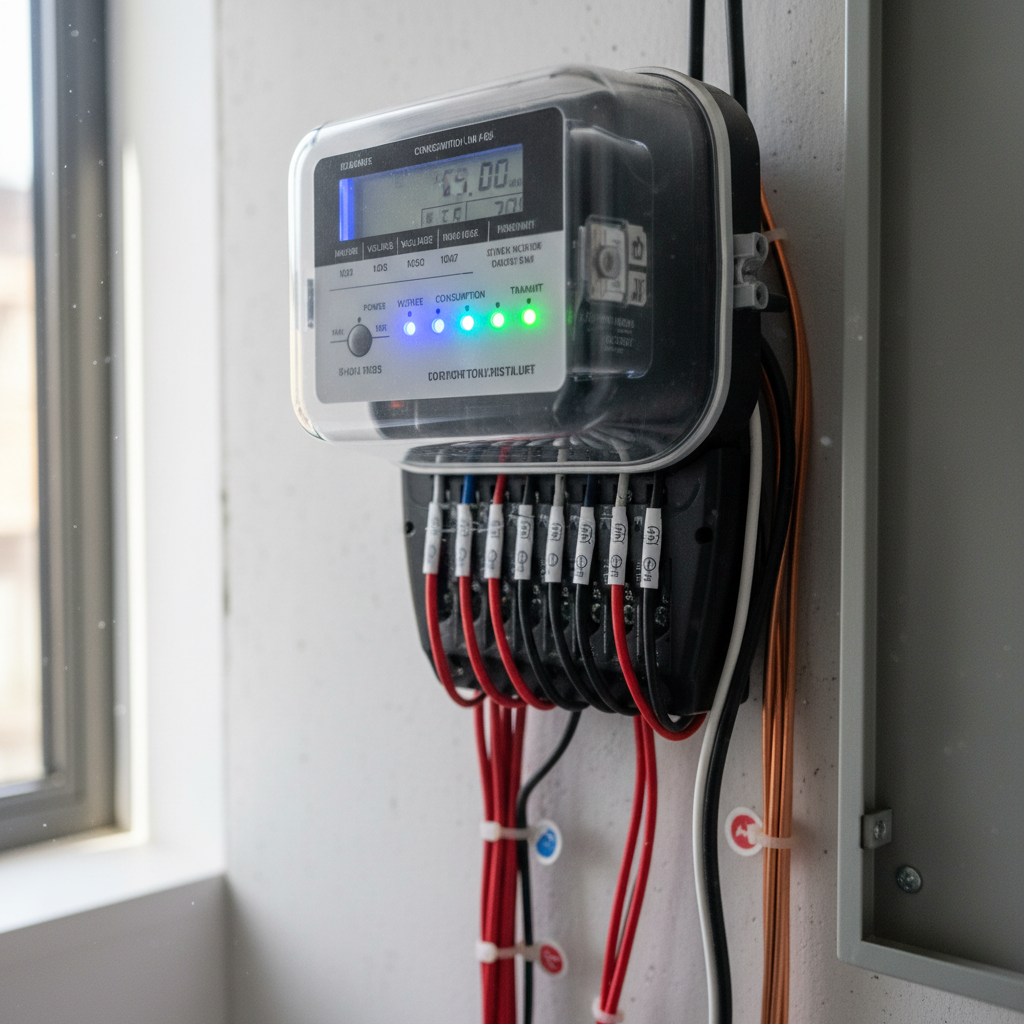
The location-based method uses the average emissions intensity of the grid serving your facility. Purchased electricity (in MWh) multiplied by a regional grid factor. In the United States, EPA’s eGRID database provides these factors, most recently updated with 2023 generation data. The result answers one question: given average grid conditions, what emissions footprint does this building’s electricity consumption carry?
The market-based method uses emission factors tied to the specific energy products you bought. Power-purchase agreements, Renewable Energy Certificates, green utility tariffs: each carries its own factor (often zero for renewables). The result answers a different question: based on the buyer’s deliberate procurement choice, what is the attributed emissions footprint?
| Dimension | Location-based | Market-based |
|---|---|---|
| Core question | What is the average carbon intensity of my local grid? | What electricity product did I choose to buy? |
| Primary data source | Regional grid factor (e.g., EPA eGRID) | Supplier rate, REC, PPA, green tariff, or residual mix |
| Strength | Comparable across sites, difficult to game | Reflects procurement choices, supports differentiated products |
| Limitation | Ignores what the buyer actually purchased | Can overstate physical decarbonization if instruments are annual, geographically distant, or poorly matched |
The GHG Protocol requires organizations using contractual instruments to report both results. The location-based figure serves as the comparability anchor: it shows what the grid actually emits, regardless of who bought which certificate. The market-based figure shows what the company claims through purchasing decisions.
Consider a manufacturer in a coal-heavy grid region. By buying enough RECs from a wind farm several states away, it can report a near-zero market-based figure while its location-based number stays high. Both numbers are legitimate within their own framework. But the gap should trigger a question: did those certificates change anything about the physical electricity reaching the building, or did they transfer an accounting attribute from a distant generator?
An overlooked dynamic works in the opposite direction. As grids decarbonize (EU power-sector emissions fell nearly 10% in 2024, with renewables approaching half of total generation), location-based Scope 2 improves even if a company changes nothing. Neither method alone tells the full story. Together, they start to.
How to Calculate Scope 2 Emissions
The arithmetic is simple. The data collection is where companies fail.
- Gather activity data. Pull electricity consumption in MWh from utility invoices, interval meters, or energy management systems for every facility in your organizational boundary. Repeat for purchased steam, heat, and cooling where applicable.
- Apply the location-based factor. For US sites, use EPA’s Emission Factors Hub, updated in January 2025 with eGRID-derived factors. For international facilities, use the relevant national or sub-national grid factor.
- Build the market-based ledger. Map every contractual instrument to its facility: supplier-specific emission rates, RECs (with serial numbers and retirement records), PPA terms, utility green tariffs. Where no qualifying instrument exists, use the residual mix for that market. Where no residual mix exists, default to the location-based factor.
- Document the chain. Emission factor version, certificate vintage, retirement registry, generation date, market boundary, and the mapping from each site to each instrument. This is what auditors and assurance providers will request.
- Report both totals. Publish the location-based result and the market-based result. Label each clearly. A single unlabeled Scope 2 number is an incomplete disclosure.
The most common failure is not bad math. It is incomplete activity data. A company with 40 facilities across 12 countries, where five sites estimate consumption from cost data rather than metered usage, inherits that estimation error into every downstream calculation. Accuracy begins at the meter, not the spreadsheet.
Certificates, Contracts, and the Quality Gap
A Renewable Energy Certificate represents the environmental and non-power attributes of one megawatt-hour of renewable electricity generation. It is a property right. Not a delivery receipt. Grid electricity does not label electrons by origin. RECs assign ownership of the “renewable-ness” for accounting purposes.
Used with discipline, the mechanism works. The GHG Protocol’s 2015 Scope 2 Guidance established eight quality criteria for contractual instruments. The attribute must be conveyed. The claim must be unique. The certificate must be retired for the reporting entity. Vintage should align with the consumption period. The supply should connect to the relevant market.
Where it falls apart: a company in Houston buys RECs from a wind farm in Oregon, retires them against Houston consumption, and reports a lower market-based figure. The RECs are real. The retirement is documented. But the physical electricity serving the Houston facility came from the ERCOT grid, which may have been running gas-fired generation at that exact hour. Critics of broad annual market accounting, including EnergyTag, argue this framework permits claims like “solar-powered at night” when fossil generation was physically serving load. Their remedy: match clean generation and consumption in the same grid and the same hour, using timestamped granular certificates.
The scale of the underlying gap is stark. CDP’s November 2024 analysis found that nearly half of major global companies used no renewable electricity at all. Among those that do buy renewables, instrument quality varies enormously. The distance between “we retired enough annual RECs to cover our load” and “we matched clean generation to every hour of consumption on the same grid” is the distance between basic compliance and credible decarbonization.
What Big Tech’s Scope 2 Numbers Really Show
Data centers consume vast amounts of electricity, which makes Big Tech the highest-profile Scope 2 reporting category. Their disclosures are instructive for what they reveal and for what they leave ambiguous.
Amazon reports market-based Scope 2 emissions of 2.80 million metric tons CO2e in 2024, down from 5.50 million in 2019. Behind that trajectory: 621 renewable-energy projects totaling 33,485 MW. The progress is real and substantial. But the small uptick from 2.76 million in 2023 to 2.80 million in 2024 shows that portfolio changes, load growth, and methodology recalculations can affect reported numbers even when the long-term direction is strong.
Google reports a 12% decline in data-center energy emissions in 2024 while procuring over 8 GW of clean energy. Google also pairs procurement with efficiency improvements and has committed to 24/7 carbon-free energy matching by 2030. That combination of procurement plus operational discipline is more credible than either lever alone.
Then there is Microsoft. Its FY24 disclosure shows combined Scope 1, 2, and 3 emissions fell only 2% from its 2020 baseline, despite significant renewable-electricity commitments. The target: cut those combined emissions by more than half by 2030. The lesson is blunt. A company can make genuine Scope 2 progress while total emissions barely budge, because data-center construction, hardware procurement, and supply-chain impacts (all Scope 3) keep growing.
Scope 2 improvement does not equal net-zero progress. It is one layer. Without Scope 1 and Scope 3 context, a declining Scope 2 figure can mask an expanding total footprint.
The Road to 2027: Hourly Matching and Stricter Standards
The GHG Protocol launched a public consultation on Scope 2 revisions in October 2025, with comments closing January 31, 2026. Proposed changes retain dual reporting, update the location-based factor hierarchy, add deliverability requirements for market-based claims, and introduce hourly matching for certain voluntary claims above a large-consumption threshold. The final standard is expected in 2027.
The infrastructure for granular tracking is already materializing. In June 2025, EnergyTag accredited its first granular-certificate schemes (Energinet Denmark and Flexidao), enabling hourly clean-energy tracking across 47 countries on four continents. Accreditation is not itself a carbon-accounting standard, but it makes more precise procurement claims technically possible at scale.
Alongside the GHG Protocol changes, IFRS S2 (effective for reporting periods beginning January 1, 2024) now requires disclosure of climate-related risks, opportunities, and progress toward targets. Scope 2 data is increasingly reviewed as investor-grade performance information, not a line item buried in a sustainability microsite. Organizations navigating these evolving ESG reporting requirements must prepare data systems that can accommodate both current and anticipated disclosure standards.
What does 24/7 carbon-free energy matching look like in practice? Each hour of electricity consumption is matched to zero-emission generation on the same grid during that same hour. It creates demand for storage, firm clean power, and flexible load management. The World Resources Institute reports that Google, Microsoft, and several governments have committed to 24/7 targets, though the approach requires interval data, sophisticated procurement, and can carry cost premiums that smaller organizations struggle to absorb.
The risk ahead is a two-speed market. Large companies with procurement teams and data infrastructure pursue hourly matching. Smaller organizations stay dependent on annual certificates and generic factors. The 2027 standard will try to bridge that gap, but the practical question for any company reporting today is this: are you storing the data that the next standard will require?
Hourly consumption records. Contract metadata. Certificate serial numbers. Generation timestamps. Location-specific factors. Collecting this now, while you still report annually, is cheaper than reconstructing it in 2028.
Frequently Asked Questions
What are Scope 2 emissions?
Scope 2 emissions are indirect greenhouse-gas emissions from purchased or acquired electricity, steam, heat, and cooling. They represent the emissions produced at the power plant or utility that generated the energy your organization consumed. Direct combustion in equipment you own or control falls under Scope 1 instead.
Why do companies report two Scope 2 numbers?
The GHG Protocol requires a location-based result (using average grid emission factors for your region) and a market-based result (using factors tied to the specific energy products purchased). Each answers a different question: what does the local grid emit per MWh, and what did the buyer contractually claim through procurement choices?
Are RECs the same as physically using renewable electricity?
No. A REC represents the environmental attributes of one MWh of renewable generation. It assigns ownership for accounting purposes. Grid electricity does not identify its generation source. A REC can support a bounded market-based claim, but it does not prove that renewable electrons physically reached your meter at the time of consumption.
What is 24/7 carbon-free energy matching?
Rather than matching total annual consumption to an equal volume of renewable certificates, 24/7 matching pairs each hour of electricity use to zero-emission generation on the same grid during that same hour. It drives demand for storage, firm clean power, and demand flexibility. Google, Microsoft, and several governments target this standard by 2030.
Can Scope 2 improve without any action from the company?
Yes. As a regional grid adds more renewable generation, the average emission factor drops. That improves the location-based Scope 2 result for every organization on that grid, regardless of individual procurement. This is precisely why publishing both methods (and disclosing Scope 1 and 3 alongside) matters for a complete picture.
How will the 2027 GHG Protocol update change Scope 2 reporting?
The proposed revisions retain dual reporting, strengthen deliverability requirements for market-based instruments, and introduce hourly matching for some voluntary disclosures. The final standard is expected in 2027. Companies should begin preserving interval consumption data, certificate chain-of-custody records, and contract details now to prepare.
Every Scope 2 calculation, whether location-based, market-based, or hourly, begins with the same raw input: accurate, facility-level energy consumption data. For companies running distributed operations across warehouses, ports, maintenance hubs, and fleet depots, that data is often the weakest link. Invoices arrive monthly in inconsistent formats. Interval metering exists at some locations but not others. If your emissions inventory rests on estimated rather than measured consumption, the problem is not in your accounting method. It is in the monitoring layer underneath it. That is a gap we work on every day with environmental tracking and operational visibility across distributed sites—similar challenges exist in sectors like environmental monitoring for agriculture, where distributed measurement infrastructure is equally critical. If your data infrastructure needs that kind of attention, let’s talk.








 +1 508 292 2210

3 Responses