

Most environmental monitoring programs on farms collect data nobody acts on. The sensors work fine. The dashboard fills up. And the irrigation schedule stays exactly the same as last season.
That is expensive. Agriculture pulls roughly 69% of the world’s freshwater. Agrifood systems emit 16.5 Gt of CO2-equivalent per year. Environmental monitoring for agriculture can move both numbers, but only when a measurement connects to an actual decision: irrigate less, apply fertilizer differently, scout a zone, change a rotation. (See also: scope 2 emissions.)
This guide covers what environmental monitoring actually includes, which sensor investments return real dollars, what breaks in the field, and how to build a program that outlasts its first season.
What Environmental Monitoring for Agriculture Actually Covers
The term gets stretched thin. Vendors use it to sell soil probes. Academics use it for satellite-based land classification. Regulators use it for nitrate compliance. All partially right, all incomplete.
At its core, environmental monitoring for agriculture is the continuous or periodic measurement of conditions that affect farm productivity, resource use, and environmental impact. It spans six domains:
- Soil: moisture, temperature, electrical conductivity, pH, organic matter, compaction, nutrient levels
- Weather: temperature, humidity, wind, rainfall, solar radiation, evapotranspiration
- Water: irrigation flow, drainage quality, groundwater nitrate, salinity, runoff volume
- Crop health: vegetation indices, canopy temperature, disease markers, pest pressure
- Atmosphere: methane, CO2, ammonia emissions at the source
- Land use: cover classification, field boundaries, rotation history, degradation tracking
Precision agriculture overlaps with environmental monitoring, but the emphasis differs. Precision ag optimizes inputs for yield and margin. Environmental monitoring adds resource condition and ecological outcomes to the equation. In practice, the same soil moisture probe serves both goals. The question is whether someone acts on the data for both.
Despite decades of development, adoption remains uneven. USDA survey data shows autosteering or guidance at 70% adoption among large-scale US crop farms, but only 52% for midsize operations. Yield monitors and soil maps reach 68% of large farms. Scale, connectivity, capital, and technical skills still matter as much as sensor performance. If that surprises you, it shouldn’t. The technology is rarely the bottleneck. The operation around it is.
The Sensor Stack: Soil, Sky, Water, Machine
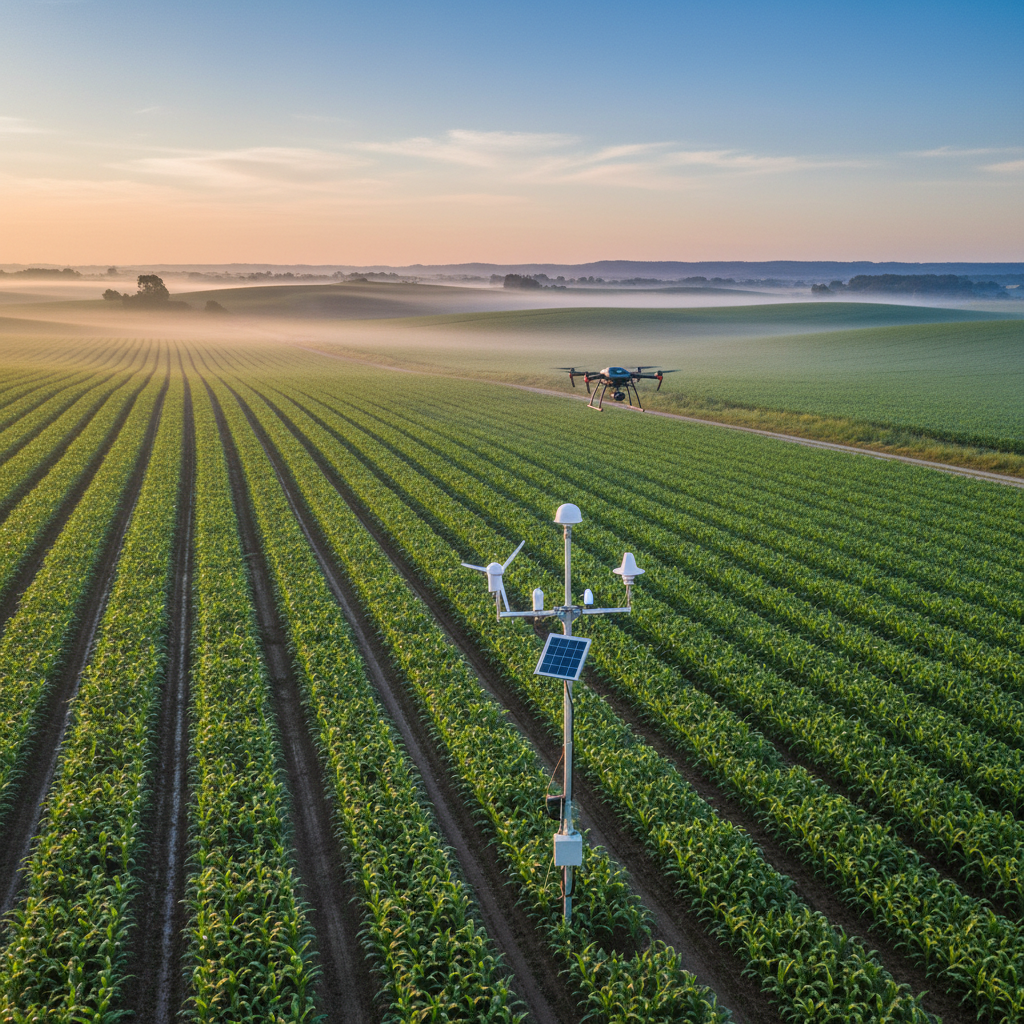
Five observation layers form a modern agricultural monitoring system. None of them works alone.
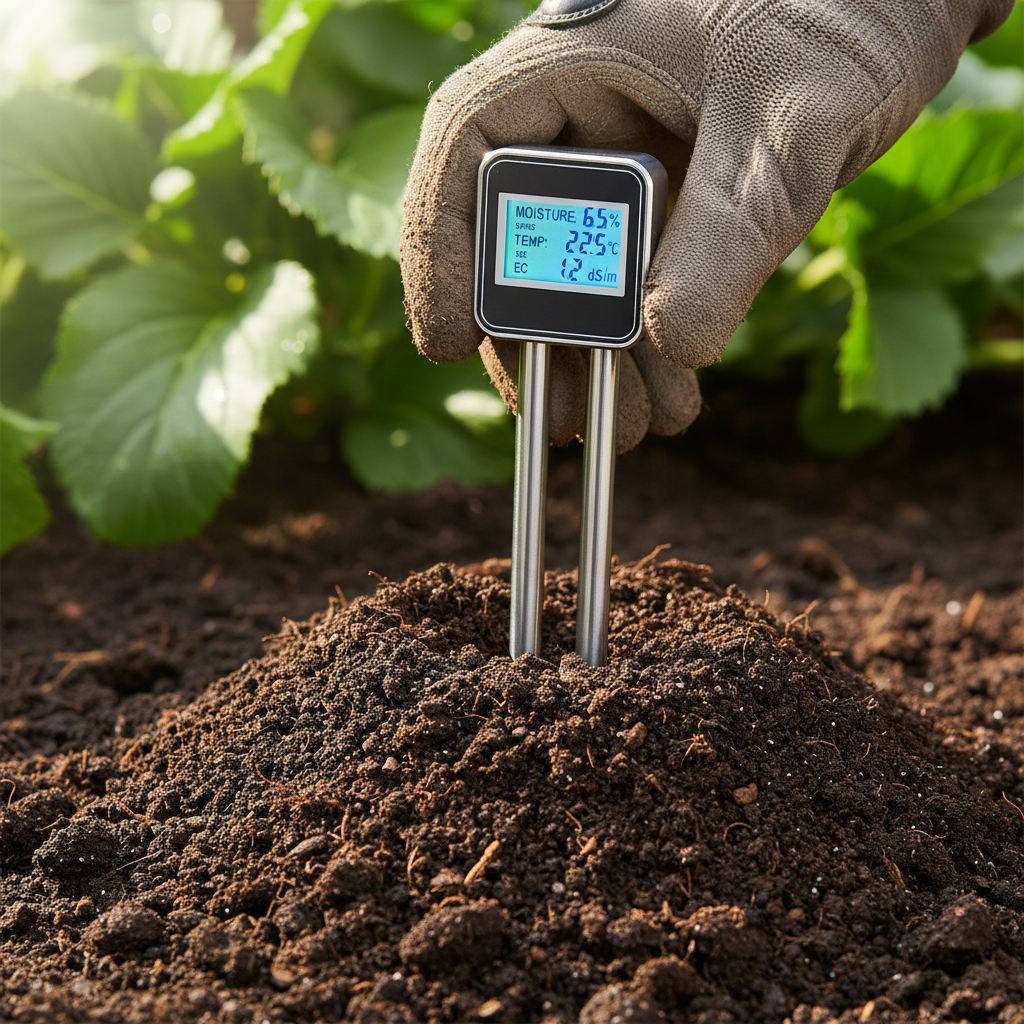
In-field sensors give you root-zone truth. Soil moisture probes, weather stations, leaf wetness sensors, flow meters, and nutrient probes measure what is happening at specific points in your field. Capacitance probes are fast and cost-effective when properly calibrated; time-domain reflectometry tends to be more accurate with less site-specific calibration. The limitation is spatial: a probe at the field edge tells you nothing about the clay lens 200 meters in.
Satellites provide the wide view. USDA’s Cropland Data Layer delivers annual crop-specific rasters at roughly 30 m resolution, covering the contiguous US since 2008. Commercial satellites add optical, radar, thermal, and hyperspectral bands. Coverage is broad. Resolution is limited (typically 10-30 m for accessible optical imagery), and clouds block passes. Satellites tell you where to look. They rarely tell you what to do.
UAVs fill the middle ground. Resolution can reach 0.1 to 5 cm per pixel, enough to identify individual plants, disease patches, or drainage problems. Operating costs run $500 to $2,000 per square kilometer, and you need a pilot, a processing pipeline, and cooperative weather. UAVs are inspection tools, not continuous monitors.
Machine telemetry records what actually happened. Planting rate, spray volume, fertilizer application, yield per pass. This layer closes the loop between intent and execution. Without it, you compare a prescription to an outcome with no record of whether the prescription was followed.
Weather stations supply causal context. Evapotranspiration models, frost alerts, disease-risk calculations, and spray-drift predictions all depend on local microclimate data. A regional airport weather feed is not a substitute for a station in your vineyard.
The integration challenge is where most programs stall. AgGateway’s ADAPT toolkit and PAIL standard address interoperability between hardware and software vendors. But most farms still deal with proprietary formats, manual exports, and dashboards that do not talk to each other. Choosing sensors with open APIs and documented data formats is a prerequisite for a system that outlasts any single product.
Five Use Cases With Measurable Returns
1. Irrigation scheduling. This is usually the fastest payback. Root-zone moisture data, combined with weather and evapotranspiration, replaces calendar-based irrigation with demand-based scheduling. Clemson University research found that soil moisture sensors can increase average net income by almost 20%, though outcomes depend on crop, region, and baseline practice. The operational key is placing probes at representative depths and soil types, then setting thresholds that leave room for rainfall instead of irrigating to saturation.
2. Variable-rate fertilizer. Soil maps, yield maps, and crop imagery let you vary nitrogen, phosphorus, or potassium rates within a single field. A 2026 review of 54 field studies found fertilizer reductions in 12 of 14 variable-rate papers, with average corn reductions of 4 to 7%. Some sensor-based cases reported 57 to 81% lower nitrogen losses. But the evidence base is heterogeneous. An ADAS trial across 11 UK commercial farms over five years found only about 0.05 t/ha of additional wheat yield and roughly £10/ha in extra profit. More spatial resolution does not automatically create more value. The management recommendation has to be different enough, accurate enough, and actionable enough to matter.
3. Targeted spraying. Camera-based systems distinguish crops from weeds in real time and apply herbicide only where needed. John Deere’s See & Spray reported a 2.0 bushel-per-acre soybean yield advantage over broadcast treatment in third-party trials across seven states, along with a 2 to 5% chemical reduction through ExactApply. These are company-reported results under trial conditions, not universal guarantees. Still, the direction is clear: pixel-level targeting outperforms blanket application when the system can distinguish what matters.
4. Water quality and nitrate management. Here, environmental monitoring extends below the root zone and beyond the field boundary. USGS found that 12% of domestic-supply wells in agricultural areas exceeded the EPA nitrate standard of 10 mg/L. A Delaware comparison showed nitrate climbing from 13.1 to 18.3 mg/L after a field shifted from hay to corn-soybean rotation. The complication: groundwater can take decades to reflect changes in surface management. Effective monitoring combines application records, soil nitrate testing, drainage samples, and well testing over years. A single season proves nothing.
5. Methane and emissions verification. Satellite-based methane detection is moving from research to operation. GHGSat reports satellite sensitivity around 100 kg/h at approximately 25 m resolution. Carbon Mapper’s Tanager-1 satellite, launched in August 2024, has reported detections including a 1,200 kg/h methane plume from a Karachi landfill. On-farm methane and fuel combustion count as scope 1 emissions, the ones an operation directly owns and can act on, while supply-chain impacts fall under scope 3 emissions. For agriculture specifically, rice is a critical target: global rice-methane estimates still range from 10 to 280 Tg per year, with regional uncertainty driven by water management practices. Measurement is advancing. Verification and certification remain separate, harder, and more expensive steps.
What Breaks: TCO, Connectivity, and Vendor Lock-In
Vendor brochures show the sensor in a clean field with full signal bars. The reality is muddier.
Sensor failure is routine, not exceptional. Research on agricultural IoT faults identifies power supply failure, drift, bias, stuck values, and spikes as common failure modes. Machine-learning fault detection can reach high accuracy in benchmarks, but outdoor conditions shift. A model trained on spring data may miss autumn failures entirely. A single power event can take down a whole sensor network at once.
Total cost of ownership goes well beyond the hardware price. You pay for the sensor, the gateway, the connectivity subscription, the cloud platform, calibration visits, physical maintenance in corrosive or high-vibration environments, replacements, and the human hours to interpret data and act on it. A $200 soil probe that costs $800 per year to maintain and connect is a $4,200 asset over five years. If nobody changes a decision because of its readings, that is $4,200 wasted.
Connectivity is the silent dependency. Sensor nodes communicate via cellular, LoRaWAN, Wi-Fi, Zigbee, or satellite backhaul. Rural areas often lack reliable coverage. Edge processing can reduce dependence on real-time cloud sync. A well-designed system records data locally during outages and timestamps every reading. But if your platform requires live connectivity for frost alerts, a three-hour gap means the alert arrives after the damage.
Vendor lock-in is an economic risk, not a legal footnote. Research on digital agricultural platforms shows that incompatible data formats consolidate market power and limit farmer choice. If you cannot export your soil moisture history, yield maps, or sensor configurations in a standard format, switching vendors means starting from zero. Farmer data principles emphasize ownership, consent, transparency, portability, and security. Ask about these before signing, not after.
The training gap is the most underestimated cost. A dashboard full of soil tension readings, NDVI maps, and evapotranspiration curves is worthless if the irrigation manager cannot interpret them. Or does not trust them enough to change a schedule. Implementation should include field-team training, written decision thresholds (not just visualizations), and a feedback loop where the team reports what worked and what failed.
Climate Claims Need More Than a Dashboard
Environmental monitoring increasingly intersects with climate commitments, carbon markets, and regulatory compliance. The opportunity is real. So is the gap between a measurement and a verified claim.
Measurement, reporting, verification, and certification are four distinct steps. A soil moisture sensor measures. A platform reports. An auditor verifies. A standard certifies. Conflating any two creates risk for everyone involved.
USDA’s Climate-Smart Agriculture program has invested more than $3 billion across roughly 140 pilot projects, covering over 60,000 farms and 25 million acres. The program projects more than 60 million metric tons of CO2-equivalent in lifetime climate benefits. Those are program-level estimates, not proof that every participating practice delivers the same result at every site. The pilot structure matters precisely because verification protocols are still maturing.
In Europe, automated satellite monitoring supported area-based agricultural payments across more than 3 million hectares in 2024, covering over 90% of EU agricultural land. But payment eligibility, environmental compliance, carbon credits, and biodiversity claims each carry different evidence standards, and evolving ESG reporting requirements alongside emerging sustainability reporting standards add another layer. A single monitoring layer rarely satisfies all of them.
For soil carbon, direct measurement, digital soil mapping, and uncertainty estimation remain necessary to substantiate change claims. A modeled estimate is a starting point, not a verified offset. Permanence, additionality, baseline, and audit requirements sit on top of the measurement itself.
If your monitoring program needs to support a climate or sustainability claim, design the measurement, reporting, and verification chain before deploying sensors. Retrofitting environmental compliance monitoring onto a system built purely for operations rarely works cleanly.
How to Build a Monitoring Program That Lasts
The strongest agricultural monitoring programs I have worked with share a pattern. They start small, prove value on one decision, and scale only after the team trusts the data and the process around it.
Start with a decision, not a device. “We want to reduce irrigation water use by 15%” is a program goal. “We want soil moisture sensors” is a shopping list. The decision determines which measurements matter, where to place them, how often to read them, and what threshold triggers action.
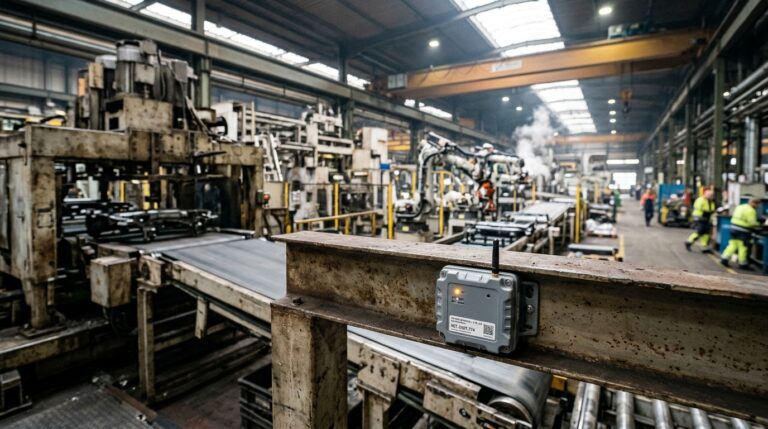
Choose hardware for the actual environment. Farm conditions are not lab conditions. Dust, mud, UV exposure, equipment vibration, rodent damage, flooding risk, and temperature extremes are normal. Sensors rated for outdoor industrial use with long battery life and ruggedized housings pay for themselves in reduced replacements within the first year. When the application involves temperature-sensitive monitoring or environmental compliance, purpose-built environmental trackers outperform repurposed consumer devices on accuracy, durability, and total cost.
Demand open data formats and export rights. Before signing any platform contract, confirm that you can export raw sensor data, calibration logs, and historical records in a standard format. Check whether API access or data export costs extra. Your measurement history should move with you if you change vendors. This is not paranoia. It is basic procurement hygiene.
Validate before you scale. Deploy in a representative zone. Compare sensor readings against laboratory samples or manual observations for at least one full crop cycle. Document the gap between sensor output and ground truth. The same 2026 review that found benefits in 83% of precision agriculture studies also found zero environmental benefit in 17%. Most trials lasted only about 2.5 years. Multi-season validation is not optional if you intend to justify capital expenditure or climate claims.
Build human capacity alongside the sensor network. Assign a clear owner for each data stream. Write thresholds for action: irrigate when soil tension exceeds a defined value at root depth; scout when NDVI drops below a target in a management zone. Review sensor performance monthly. Recalibrate or replace drifting units. The technology is a tool. The program is the people, processes, and decisions built around it.
Plan for failure. Sensors will fail. Connectivity will drop. Dashboards will display stale data. Design the system so failures are visible: timestamps on every reading, data-quality flags, gap alerts. Make sure the team knows the fallback procedure. Silent failure, where a stuck sensor feeds a confident-looking number to a trusting operator, is worse than a sensor that honestly reports “offline.”
FAO has documented that infrastructure gaps, connectivity cost, weak institutions, and digital literacy remain real barriers, particularly for smaller operations. Starting with one high-value decision, using open or public data where possible, and measuring payback before adding devices is the approach that works across farm sizes.
Frequently Asked Questions
What is environmental monitoring for agriculture?
It is the measurement and interpretation of conditions that affect farm productivity, resource use, and environmental impact. This covers soil moisture and nutrients, weather, water quality, crop health, pest pressure, chemical applications, greenhouse gas emissions, and land cover. The goal is better-timed decisions about water, fertilizer, spraying, and field operations.
Which sensors should I deploy first?
Start with the measurement tied to your highest-cost or highest-risk decision. For most irrigated operations, soil moisture probes paired with a field weather station deliver the fastest payback. For nutrient-intensive crops, soil testing combined with variable-rate controllers may matter more. Avoid buying sensors for problems you have not yet quantified.
Are satellite images better than field sensors?
Neither replaces the other. Satellites cover large areas at 10 to 30 m resolution for classification, change detection, and regional prioritization. Field sensors provide root-zone, real-time measurements. UAVs offer centimeter-scale resolution for targeted scouting at higher operating cost. The best programs layer two or three of these based on the specific decision they need to support.
Does monitoring automatically reduce water or fertilizer use?
No. It creates the possibility of reductions when someone changes an operation based on the data. A 2026 review found fertilizer reductions in 12 of 14 variable-rate studies, but a five-year UK commercial trial found only modest profit gains. Baseline practice, crop type, weather, and team adherence to data-driven recommendations all shape the result.
Can environmental monitoring prove a carbon or sustainability claim?
It supplies evidence, but proof depends on the claim standard. Measurement, reporting, verification, and certification are separate steps. A modeled soil-carbon estimate is not a verified offset without direct sampling, permanence assessment, additionality criteria, and third-party audit. Design the full verification chain before deploying sensors if credits or regulatory compliance are the objective.
What are the biggest technical risks?
Sensor drift, power failure, connectivity gaps, poor probe placement, calibration error, model bias, and vendor lock-in via proprietary data formats. The most dangerous failure mode is silent: a stuck sensor feeding stale data to a confident-looking dashboard. Require timestamps, quality flags, and documented fallback procedures from any system you deploy.
If environmental monitoring is on your roadmap and you want a system that integrates cleanly with your existing operations, reach out to our team. We help agricultural and industrial operations select, deploy, and integrate environmental tracking hardware built for the conditions your equipment actually faces. info@datanetiot.com






 +1 508 292 2210

6 Responses