

Most teams get the equipment utilization formula right. They get the denominator wrong.
The math is a single division. The operating definition behind that division is where fleets quietly diverge, two sites reporting “78% utilization” while measuring completely different things. One counts engine-on hours. The other counts productive work. A third uses calendar time. Same formula, three answers, zero comparability.
This article gives you the equipment utilization formula, then does what most guides skip: it pins down which denominator fits which question, shows how the choice changes your number, and walks through benchmarks that actually apply to your asset class. If you manage equipment across multiple sites or geographies, the denominator is the first decision, not the last.
The Formula in 10 Seconds
Equipment utilization (%) = (operating hours during the period / available or planned hours during the same period) × 100
A loader records 32 working hours in a 40-hour planned week. Utilization: 80%.
Simple. The complexity hides in two words: “operating” and “available.” What counts as operating? Engine running? Bucket moving? And available to whom, the calendar, the schedule, or the customer? The answer to those questions changes the rate by 15 to 30 percentage points on the same machine, same week. That spread is not a rounding error. It is the difference between buying three new excavators and redeploying the ones you already own.
So before optimizing the number, you need to agree on what the number measures.
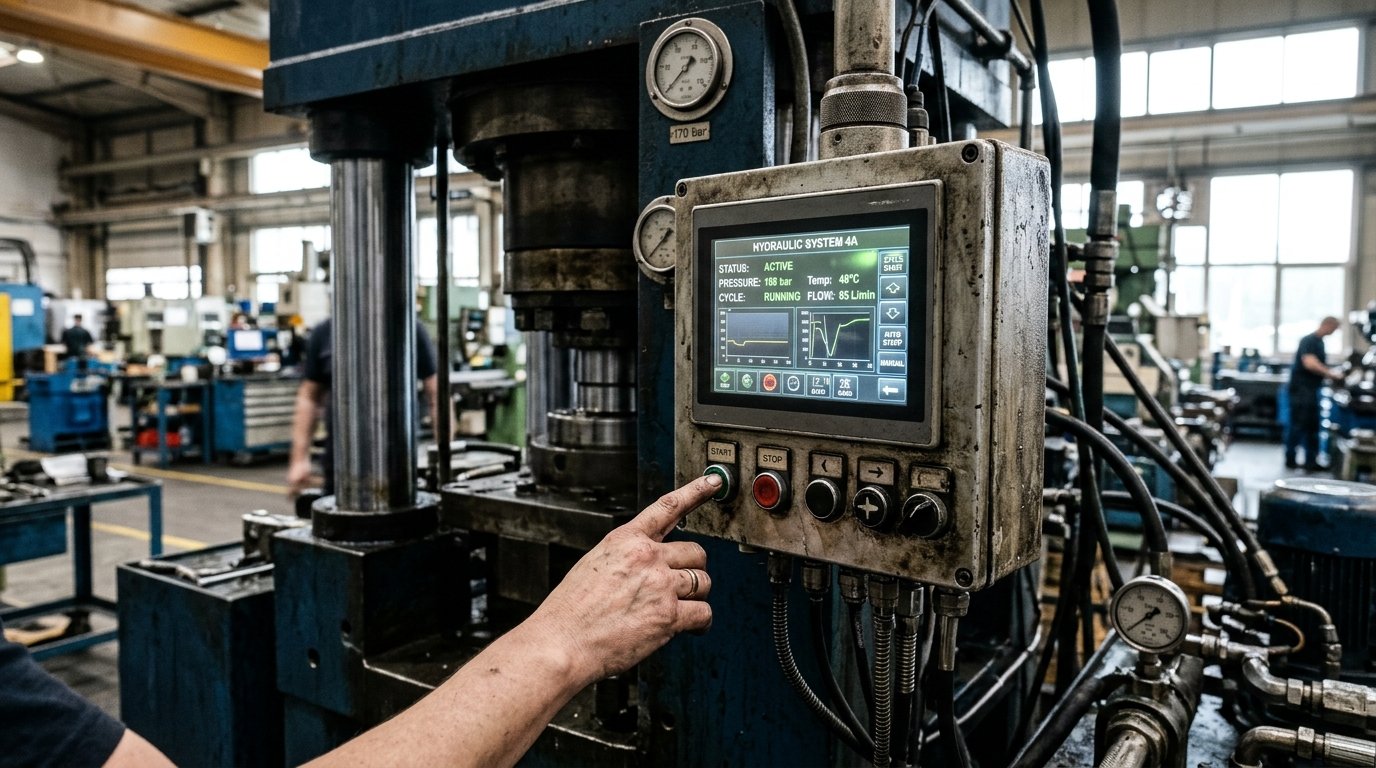
One Formula, Three Denominators
The utilization formula is not one definition. It is a family of definitions that share the same arithmetic but answer different management questions. Here are the three you will encounter most:
| Metric | Numerator | Denominator | Question it answers |
|---|---|---|---|
| Planned-hours utilization | Working hours | Scheduled / planned hours | How much of the work window did this asset actually work? |
| Available-time utilization | Operating hours | Total time the asset could be used | How often was this asset operating while it was physically available? |
| Operating utilization | Operating hours | Time the asset was required to operate | When operations needed this machine, was it running? |
The Global Mining Guidelines Group distinguishes asset utilization from operating utilization precisely because the denominators serve different decisions. Asset utilization compares operating time against total available time. Operating utilization compares it against the time the asset was required to operate. A machine sitting idle on a weekend with no scheduled work scores zero in the first definition and is simply excluded from the second.
Neither is wrong. But mixing them in a fleet report is.
The practical rule: publish the numerator, denominator, time window, and downtime classification alongside every utilization KPI. If a colleague cannot reconstruct your number from those four pieces, the KPI is decorative.
Once the denominator is locked, the next question is whether the numerator actually reflects productive work, or just an engine that happens to be on.
Engine Hours Are Not Productive Hours
A machine with 50 engine-on hours in a week sounds busy. But if 30 of those hours are idling (engine running, no load, no movement), productive utilization is 40%, not the 100% your telematics dashboard might suggest.
This is not a hypothetical gap. A 2026 industry survey of 600 commercial-fleet respondents found that roughly half estimated unnecessary idling accounted for more than 25% of total engine-on time across powered equipment categories. That idle share does not show up in a basic hours-based formula unless you explicitly separate working states from non-working states.
The fix is a two-layer report:
- Layer 1: Engine utilization. Engine-on hours / planned hours. This tells you how often the asset was powered.
- Layer 2: Productive utilization. Hours performing useful work / planned hours. This tells you how often the asset earned its keep.
The delta between the two layers is your idle opportunity. On a fleet of 200 machines, that delta often represents tens of thousands of dollars in fuel burned with zero output, plus accelerated wear on components that do not care whether the engine was under load or not.
Knowing the formula is one thing. Knowing what number to compare it against is another, and that is where most benchmark conversations go sideways.
Benchmarks That Mean Something (And Federal Numbers That Don’t)
Two benchmarks circulate constantly. One is useful. The other is misapplied so often it deserves a warning label.
The useful benchmark: heavy equipment comparators
The 2026 Heavy Equipment Comparator reports a 66% median utilization of planned hours among contractor respondents. Upper-range performers hit 80% or higher. Lower-range respondents sit at 44% or below. That spread reflects real differences in asset type, geography, weather windows, and project mix. It is a distribution, not a universal target.
If your fleet of wheeled loaders runs at 55% and the comparator median for similar equipment in your region is 65%, you have a conversation worth having. If your fleet of specialized cranes runs at 55% and you compare it against the same 65%, you are comparing apples to anchor bolts.
The misapplied benchmark: Federal Reserve capacity utilization
The Federal Reserve reported 76.4% total-industry capacity utilization and 76.0% manufacturing capacity utilization for October 2026. These rates compare output indexes with capacity indexes at the national level. They measure how much of the economy’s sustainable production capacity is being used. They do not measure engine hours divided by scheduled hours on any individual piece of equipment.
Citing 76% Fed capacity utilization as a machine-level benchmark is a category error. It tells you something about the macroeconomic cycle. It tells you nothing about whether your excavators are sitting idle on Tuesdays.
What “good” actually looks like
Forget a single magic number. Good utilization depends on the asset, the duty cycle, and the cost of being wrong in either direction:
- Construction heavy equipment (planned hours): 60 to 75% is a healthy operating range for mixed fleets. Above 80% can signal insufficient maintenance windows or spare capacity for peak demand.
- Manufacturing (OEE-based): World-class OEE is often cited around 85%, but OEE multiplies availability, performance, and quality. A simple time-utilization rate cannot be compared to OEE without decomposing the components.
- Rental fleets: Time-on-rent divided by rentable fleet-days is the relevant metric, not engine hours. A rental company cares about customer demand coverage and revenue yield per asset, which is a different optimization than a contractor running owned equipment.
Benchmarks only work when you compare like-for-like: same asset class, same denominator, same downtime rules. Everything else is noise.
But even a perfectly defined formula with the right benchmark falls apart if the data feeding it is unreliable. And in 2026, that remains the bigger problem.
Why 84% of Fleets Have Telematics and Still Guess
Here is the uncomfortable part. The bottleneck is rarely the formula. It is the data.
A 2026 industry survey of 600 commercial-fleet respondents across the US, UK, Australia, and New Zealand found that 84% used some form of telematics, asset tracking, or integrated equipment-management system. That sounds like the industry has solved the data problem. It has not.
From the same research:
- 75% still relied on manual logs as a primary or supplementary tracking method.
- Only 28% had fully implemented digital tracking.
- 74% of operators cited data accessibility as a major utilization barrier.
Translation: most fleets bought the hardware but never closed the loop. The tracker sends a signal. The signal lands in a dashboard. The dashboard does not connect to the dispatch decision. The dispatch decision still happens on a whiteboard, a spreadsheet, or a phone call. The utilization formula runs on whatever somebody remembered to log.
This is why asset visibility, knowing where every piece of equipment is, what state it is in, and whether it has been idle long enough to redeploy, matters more than adding another sensor. The gap is not “we lack data.” The gap is “the data we have does not reach the person making the next decision fast enough.”
Fleets that pushed live data coverage above 75% of their assets were up to 2.6 times more likely to achieve lower engine idle time than fleets with coverage below 25%. That is an association, not proof that coverage alone causes improvement. But it points in a clear direction: partial visibility creates blind spots, and blind spots preserve the status quo.
See how geofence alerts for equipment can automatically flag when assets remain idle outside designated work zones.
So the question shifts from “what formula should we use?” to “how do we build a measurement system we can actually trust?”
Building a Utilization Report That Drives Decisions
A utilization number that sits in a monthly PDF is a report. A utilization number that changes what happens on Monday morning is a management tool. The difference is structure.
Step 1: Define the asset register
Every asset needs a unique ID, a category (excavator, forklift, GSE, container, trailer), a home location, and a planned-hours schedule. If two assets share an ID in different systems, your utilization math is broken before it starts.
Step 2: Lock the time-state definitions
At minimum, classify every hour into one of five states: working, idle (engine on, no productive output), standby (available, not needed), planned maintenance, and unplanned downtime. This is consistent with the GMG time classification framework, which recommends (but does not mandate) standardized state definitions for mobile equipment.
Step 3: Automate the numerator
Manual logs are subjective, delayed, and often inflated. A GPS or cellular tracker that reports location and motion state at regular intervals gives you a timestamped record no one has to remember to fill in. Even a basic asset tracker reporting position and movement every 15 minutes can distinguish “on site and moving” from “on site and stationary for 6 hours” at a resolution that manual logs cannot match.
Step 4: Calculate at the fleet level correctly
Fleet utilization is total working hours across all assets divided by total planned hours across all assets. Do not average individual asset percentages. Averaging gives a small forklift the same weight as a 50-ton crane, which distorts the picture. Sum first, then divide.
Step 5: Segment and compare
Report utilization by asset class, by site, and by time period. A fleet-wide 62% means nothing if your most expensive excavators are at 40% while forklifts carry the average. Segmentation reveals where the redeployment or divestment opportunity actually lives.
Step 6: Set a review cadence
Weekly for high-value mobile assets. Monthly for the full fleet. Quarterly for fleet-sizing decisions. The cadence matters because utilization is a trailing indicator: it tells you what already happened. The faster you review it, the sooner you catch an idle asset that could be earning revenue two sites over.
A word of caution before you chase a higher number: utilization is not a target. It is a diagnostic.
The Trap of Chasing 100%
High utilization sounds like pure upside. More hours, more output, more return on the asset. But the relationship is not linear, and the tail risks are real.
OEE guidance warns that utilization metrics can be misused as targets, leading teams to defer cleaning, inspection, or preventive maintenance to keep the number up. The result is a machine that looks productive on the dashboard and fails catastrophically in the field. The cost of one unplanned breakdown on a critical-path asset often exceeds weeks of incremental utilization gains.
The practical guard rails:
- Pair utilization with availability. If utilization rises but physical availability drops, you are borrowing from the maintenance budget to inflate the production number.
- Track maintenance compliance alongside hours. Every skipped PM interval that coincides with a utilization spike is a red flag, not a celebration.
- Leave headroom for peak demand. A fleet running at 95% has no slack when a project accelerates or an asset goes down. The cost of emergency rental or project delay dwarfs the cost of a machine sitting at 80% utilization with capacity in reserve.
The goal is not the highest number. The goal is the right number for your operating context, defended by data you trust.
Where Asset Tracking Closes the Gap
Everything above depends on one precondition: you know where your equipment is, what state it is in, and how long it has been that way. Without that, the utilization formula runs on estimates.
This is where shipment tracking and asset tracking diverge. Shipment tracking ends at delivery. Asset tracking follows the equipment through its full lifecycle: deployment, idle time, redeployment, maintenance, return, and reuse. For reusable assets like containers, ground-support equipment, trailers, and tooling, the utilization question does not stop when the asset reaches a site. It continues through every hour that asset is or is not earning its keep.
If your container pool, your GSE fleet, or your industrial equipment feels invisible after it leaves the yard, that is not a reporting problem. That is a visibility gap, and it is the gap that asset tracking closes.
At Datanet, we integrate IoT hardware from partners like Digital Matter (Oyster3, Oyster Edge, Remora2) and Thingfox T2 for DO-160 airfreight environments into end-to-end tracking solutions. The devices report location, motion state, and dwell time. The platform turns those signals into the numerator and denominator your utilization formula needs.
If you are running a utilization formula on manual logs and gut feel, talk to our team. The math is easy. The data is the hard part, and that is what we solve.

Frequently Asked Questions
What is the standard equipment utilization formula?
Equipment utilization (%) equals operating or working hours divided by available or planned hours, multiplied by 100. The formula is consistent across industries. What varies is how each organization defines “operating” and “available,” which is why publishing the denominator alongside the KPI is essential for comparability.
What is a good equipment utilization rate?
There is no universal target. The 2026 Heavy Equipment Comparator reports a 66% median of planned hours for contractor equipment, with upper-range respondents above 80% and lower-range below 44%. Compare against your own asset class, region, and duty cycle rather than chasing a single number.
Is equipment utilization the same as OEE?
No. OEE multiplies availability, performance rate, and quality rate. A time-based utilization percentage captures only one dimension: how much of the available time the equipment was operating. OEE adds whether it ran at ideal speed and produced good output. The two metrics answer different questions and should not be used interchangeably.
Can utilization exceed 100%?
Against a planned-hours denominator, yes, if the machine works overtime beyond the schedule. Against a total-available-time denominator where operating hours are a subset, no. A result above 100% usually signals a mismatch between the numerator’s time window and the denominator’s, which means the definitions need reconciliation.
Why do manual logs produce unreliable utilization data?
Manual logs depend on operator memory, are recorded after the fact, and tend to overestimate productive time. Teletrac Navman’s 2026 research found 75% of fleets still used manual logs despite 84% having invested in digital tracking technology. Automated tracking with GPS or cellular devices eliminates recall bias and provides timestamped, continuous records.
How does asset tracking improve equipment utilization?
Asset tracking provides continuous visibility into location, motion state, and dwell time for every piece of equipment. This data feeds the utilization formula with real numbers instead of estimates, identifies idle assets that can be redeployed, and flags machines sitting unused across sites. The result is better fleet-sizing decisions and fewer unnecessary capital expenditures.



 +1 508 292 2210

3 Responses