

In August 2026, global ocean schedule reliability fell to 49.9%. Half of all vessels arrived late, averaging 6.81 days behind schedule. If your supply chain still plans around a carrier’s original ETA, freight container visibility is no longer optional. It’s the line between managing disruptions and absorbing them.
The container monitoring market is on pace to reach $1.82 billion this year. Spend is growing. Whether teams gain actual visibility is another question. Most implementations deliver dots on a map, milestone logs, maybe a predicted ETA. That’s tracking data. Visibility is what happens when that data reaches the right person early enough to change a decision.
This article covers what freight container visibility actually requires, where it consistently breaks down, and how to build a stack that holds up across carriers, ports, and the blind spots in between.
What Freight Container Visibility Actually Means
Container visibility is the ability to know a container’s identity, location, journey milestones, estimated arrival, and (when equipped) cargo condition across every handoff from origin to final destination.
That sounds simple. It isn’t. The Digital Container Shipping Association (DCSA) breaks visibility into five event categories: shipment milestones, transport legs, equipment status, IoT device observations, and reefer measurements. Each category comes from a different source, arrives on a different timeline, and may use different definitions for the same milestone.
A container “discharged” at a terminal, for example, might not be available for pickup for another 48 hours due to customs holds, inspections, or yard congestion. A vessel “arriving” at port may sit at anchor for days. The milestone exists. The decision-relevant context behind it often doesn’t.
This is the core distinction most platform marketing glosses over. Visibility is not a single data feed. It’s a layered architecture that combines multiple sources, normalizes conflicting timestamps, and turns raw events into signals a team can act on. The gap between “I can see the dot” and “I know what to do next” is where most implementations stall.
The Operating Environment Driving Urgency
Three forces have made container visibility a financial imperative rather than a logistics convenience.
Scale. Global container port throughput hit 920 million TEUs in 2024, a 6.9% year-over-year jump. UNCTAD projects containerized trade growth averaging 2.3% annually through 2030. At this volume, even a small information gap across your container pool means thousands of boxes moving without adequate event data. Every blind spot is an operational liability waiting to surface.
Volatility. Red Sea diversions around the Cape of Good Hope added days to transit times. Tariff changes in early 2025 triggered front-loading surges and blank sailings. UNCTAD documented how these shocks compressed schedules, inflated spot rates on Shanghai-to-U.S. routes, and forced carriers to restructure capacity mid-season. Planned routes stopped matching actual routes. Without near-real-time visibility, your logistics team works from a map that no longer reflects the territory.
Cost exposure. Demurrage and detention charges escalate fast when pickup timing slips. The FMC’s 2024 billing rule required invoices to include container-level detail and established a 30-calendar-day billing window, though the “properly issued invoices” provision was later set aside by court. Better event records help audit and dispute these charges. Without timestamps tied to actual milestones, you’re contesting invoices on incomplete evidence.
Combined, these forces mean the question for most logistics and supply chain teams has shifted from “should we invest in container visibility?” to “how much is our current blind spot costing us every quarter?”
Three Data Layers That Make or Break It
Every container visibility system draws from some combination of three data layers. Understanding what each one can and can’t do is the fastest way to avoid the most common procurement mistake: confusing coverage with completeness.
| Data layer | What it observes | Key limitation |
|---|---|---|
| Carrier and terminal events (EDI) | Milestones: loading, discharge, gate-in/out, transshipment, customs status, pickup availability | Timing, format, and completeness vary by carrier, terminal, and trade lane. A milestone may post hours or days after the physical event. |
| Vessel AIS | Ship identity, position, speed, heading. The U.S. Coast Guard classifies AIS as a vessel-tracking and navigation system. | AIS tells you where the ship is, not which container is aboard, where that box sits in a yard, or what condition the cargo is in. |
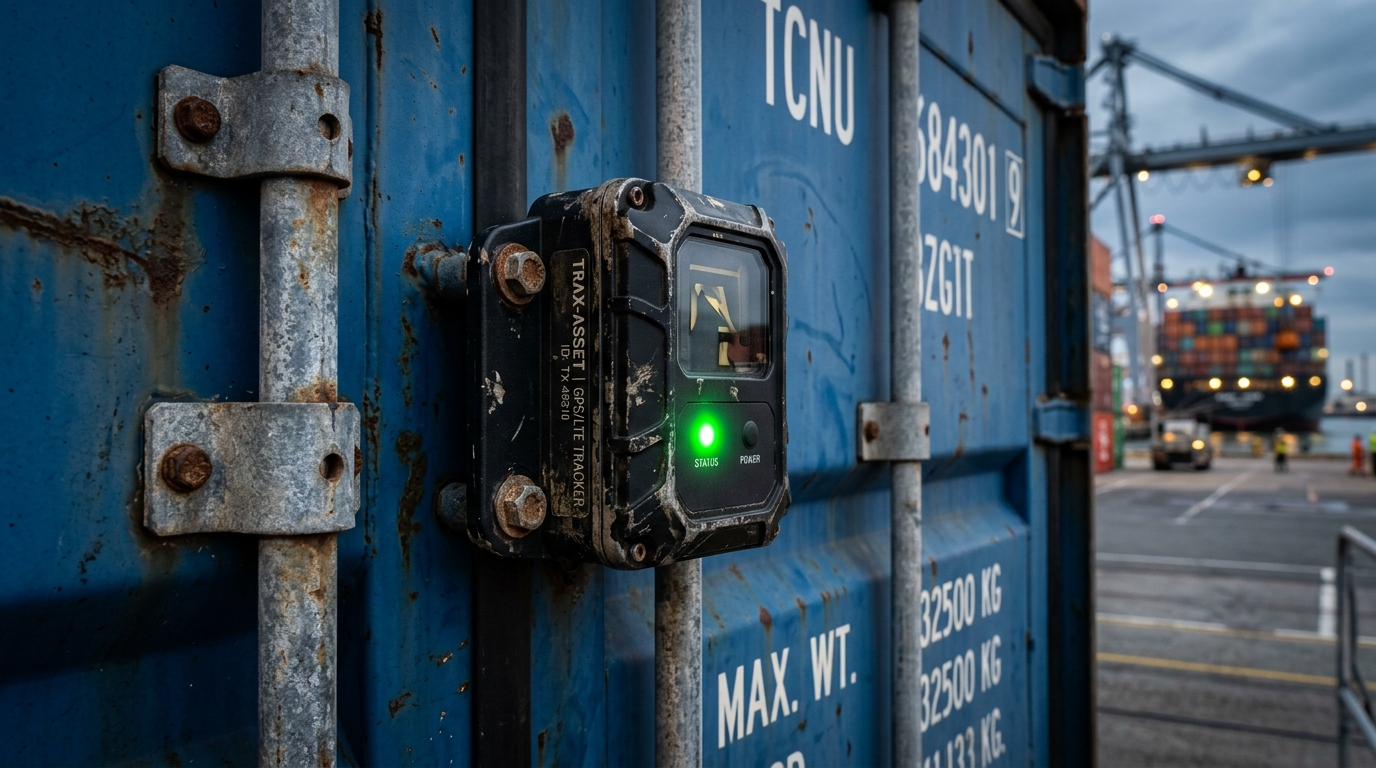
| Container-mounted IoT/GPS | Box-level position. With the right sensors: temperature, humidity, shock, light intrusion, door open/close. | Coverage depends on fleet and carrier equipment. Device health, battery life, connectivity gaps, and integration quality all affect reliability. |
Most multi-carrier logistics visibility platforms aggregate carrier EDI feeds and AIS data, then layer predictive models on top. That approach works reasonably well for estimating vessel arrival at port. It falls short for the decisions that happen after the vessel docks: drayage dispatch, warehouse slot allocation, customs clearance sequencing, and inventory release.
Container-mounted IoT devices fill that gap by reporting from the box itself, independent of the carrier’s event system. Hapag-Lloyd’s rollout illustrates the trajectory. Its May 2024 Live Position launch reported more than two-thirds of its dry-container fleet equipped with tracking devices. By 2025, a company whitepaper put that figure at more than 85%, with GPS updates every 15 minutes and API access for customer systems.
That’s one carrier. Across a multi-carrier container pool, the IoT coverage patchwork gets complicated. Which brings us to where visibility consistently breaks down.
Where Container Visibility Fails
The gap is rarely on the open ocean. AIS coverage on major shipping lanes is dense. Carriers report departure and arrival milestones for their own sailings. The failure surfaces at the seams: where responsibility transfers, where data sources change, and where economic incentives don’t align with transparency.
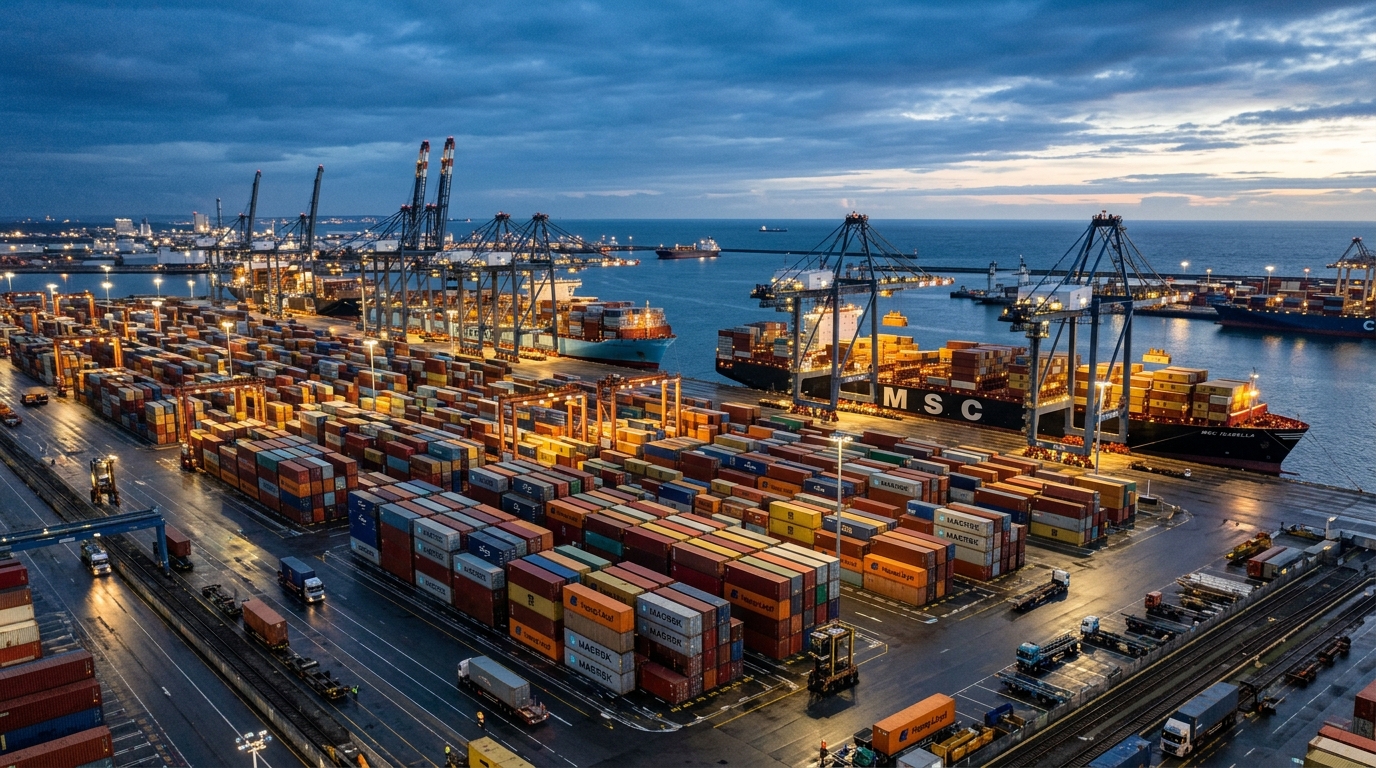
The port handoff. A container discharged from a vessel enters a terminal ecosystem with its own yard management, customs interfaces, and pickup workflows. Some visibility vendors have had to build entirely separate products just to cover discharge events, terminal location, last free day, holds, customs clearance, and pickup availability. The fact that port-level events require dedicated tooling tells you how poorly existing carrier feeds serve that handoff.
Cross-carrier blind spots. If you ship across five carriers, your visibility quality is five different things. Carrier A may have 85% IoT coverage on dry containers. Carrier B may post milestones 12 hours after the physical event. Carrier C may not participate in the aggregation platform you selected. A coverage percentage averaged across your entire book of business hides the lane-level gaps where you have near-zero actionable data.
The inland black hole. Most ocean visibility platforms end at terminal gate-out. What happens between the port and your warehouse, DC, or production facility is often a different system, or no system at all. This is where demurrage-to-detention risk compounds: a container sitting on a chassis at a congested rail yard or outside a warehouse dock, with no event data triggering an alert.
The carrier data conflict. Carrier-reported milestones are useful. They’re also generated by the same party billing you for demurrage. I’m not suggesting carriers falsify data. I am saying that when the entity tracking the event is also the entity charging you for delays related to that event, independent sensor data on the box has clear financial value. A device-level timestamp is your evidence, not theirs.
Network governance. Maersk and IBM discontinued TradeLens in late 2022 after failing to achieve the industry-wide participation needed for commercial viability. The technology worked. The ecosystem didn’t. Any visibility system that depends on universal adoption across competitors faces the same structural challenge. Favor open standards and verify actual partner coverage before committing budget.
These failures share a common thread: they occur where the data architecture lacks redundancy and the operating team has no fallback. The answer isn’t more data sources. It’s better layering.
What Good Container Visibility Looks Like in Practice
The measure of visibility quality is not how many containers appear on your map. It’s how early and how accurately your system surfaces an exception that changes a real operating decision.
A useful test: for each critical shipment, can your team answer these questions without making a phone call or opening a spreadsheet?
- Where is this container right now, and how old is that position data?
- What’s the current estimated arrival, and what’s driving the estimate (vessel AIS, carrier milestone, predictive model, or device GPS)?
- Is the cargo condition within spec?
- What’s the next handoff, and is the receiving party ready?
- If something is off, who gets the alert, and what action does it trigger?
If all five are answerable from a single view with data less than an hour old, you have visibility. If answering any of them requires logging into a carrier portal, calling a terminal, or waiting for a daily report, you have tracking data. Those are not the same thing.
Cold chain as the proof case. Reefer cargo makes this distinction visceral. Maersk’s Captain Peter service exposes temperature, humidity, O2/CO2, GPS location, and power-state data with configurable alerts and API access. Hapag-Lloyd LIVE provides reefer monitoring with tiered packages covering temperature, controlled atmosphere, and relative humidity. Both are carrier-specific services tied to their own equipment. If your reefer shipments span multiple carriers, you need an integration layer that normalizes condition data across sources. Otherwise, you’re toggling between portals during a temperature excursion that’s spoiling high-value pharmaceuticals or perishables.
Security as a visibility outcome. Industry estimates put 2025 cargo theft losses at nearly $725 million, up 60% year over year, with average loss per incident reaching $273,990. A GPS signal on a container doesn’t stop theft. But it shortens response time, improves recovery odds, and generates evidence. The caveat: IoT devices themselves can become attack vectors. CISA flagged vulnerabilities in a specific GPS tracker model that could expose location data if exploited. Vet your hardware vendor’s firmware security, authentication protocols, and patch practices before deployment. A compromised tracker is worse than no tracker.
Building a Visibility Stack That Holds Up
After deploying IoT across freight, aviation MRO, and industrial supply chains for over 15 years, I keep seeing the same pattern in teams that get this right.
Start with the decision, not the data. Don’t ask “how do I get visibility?” Ask “which operating decisions am I making too late, with too little information?” Maybe it’s drayage dispatch (you need terminal discharge and availability events). Maybe it’s inventory positioning (you need predictive ETAs with confidence intervals). Maybe it’s cold-chain compliance (you need condition data with alerting). The decision defines the data requirement. The data requirement defines the stack.
Layer your sources. No single data feed covers the full container journey with adequate precision at every point. Use carrier EDI and AIS for ocean-leg status. Use terminal-level event feeds for port execution. Use container-mounted IoT devices for independent position, condition, and security data, especially at handoff points where carrier feeds go quiet. Standardized APIs from organizations like DCSA reduce the integration work of connecting these layers.
Pilot on real lanes. Vendor coverage percentages are marketing. Your coverage is what matters. Pick 50 containers across your highest-value or highest-risk trade lanes. Run them through the proposed visibility stack for 60 days. Measure event completeness (did every expected milestone fire?), latency (how old was each data point when it reached your team?), ETA accuracy (predicted vs. actual), and exception lead time (how far in advance did you know about a problem?). Those four metrics will tell you more than any vendor demo.
Plan for data gaps. Devices lose connectivity at sea. Carriers delay posting milestones. Terminals change data-sharing policies. Your architecture needs a defined fallback for when the primary data source goes dark. That fallback should be a specific escalation path, not a shrug and a phone call.
Don’t confuse shipment tracking with asset tracking. This is the distinction I keep coming back to across every vertical we work in. Shipment tracking ends at delivery. The carrier tells you the box arrived, and the job is done. But if that container is part of a reusable pool, your visibility requirement extends through the entire return cycle: dwell time at the consignee, empty repositioning, depot return, maintenance, redeployment. That’s asset tracking, and it’s where most ocean visibility platforms stop and most operational waste begins. Cycle time, pool utilization, empty-container positioning: these are the metrics that separate logistics cost control from cost guessing.
If your container pool goes invisible after delivery, that’s exactly the gap independent IoT tracking closes. It’s a conversation we have regularly with logistics and supply chain teams building out this capability. Reach out if it’s relevant to yours.
Frequently Asked Questions
What is freight container visibility?
The ability to track a container’s identity, location, journey milestones, estimated arrival, and cargo condition across every handoff from origin to destination. DCSA defines five event categories (shipment, transport, equipment, IoT, and reefer). Useful visibility turns those events into timely, actionable signals, not just map pins.
Is vessel AIS the same as container tracking?
No. AIS broadcasts a vessel’s identity and position. It shows where the ship is, not which container is aboard, where that box sits in a port yard, or what condition the cargo is in. Container-level GPS devices report from the box itself, independent of vessel data.
Does real-time tracking mean continuous updates?
Not necessarily. Hapag-Lloyd reports GPS updates every 15 minutes for equipped dry containers. Event-based platforms post updates when a carrier or terminal milestone fires, which can lag the physical event by hours. Always ask what “real time” means in context: observation frequency, data source, and the size of the gap.
Can visibility eliminate demurrage and detention charges?
It can reduce them significantly by surfacing discharge events, last-free-day deadlines, holds, and pickup availability early enough to act. It cannot guarantee truck appointments, customs release, or avoidance of every charge. Measure actual impact by comparing container dwell times and paid invoices before and after deployment.
What’s the difference between shipment tracking and asset tracking for containers?
Shipment tracking follows cargo from pickup to delivery. Asset tracking follows the container through its full lifecycle: loaded transit, delivery, dwell at consignee, empty repositioning, depot return, and redeployment. Most ocean visibility platforms cover the first. Container pool efficiency and cycle-time optimization require the second.
How should I evaluate a container visibility vendor?
Run a 60-day pilot on your actual lanes. Measure event completeness, data latency, ETA accuracy, exception lead time, and carrier/terminal coverage for the traffic you move. Vendor-averaged coverage percentages are less useful than tested performance on your specific book of business.





 +1 508 292 2210