

In 2024, global ports handled 920 million TEUs. A 6.9% jump after two sluggish years of barely 0.6% growth each. By the throughput numbers, port logistics had a strong year.
And yet the World Bank’s latest Container Port Performance Index found that average vessel turnaround times actually deteriorated. More boxes moved. Ships waited longer. That contradiction defines port logistics in 2026: volume alone does not equal performance.
Port logistics is the entire operating system connecting an ocean vessel to your inland supply chain. Berth allocation, crane sequencing, yard storage, customs clearance, truck appointments, rail loading, reefer monitoring, empty container repositioning, documentation. Every handoff is a potential failure point. And the cargo volume keeps climbing while infrastructure, labor agreements, cybersecurity posture, and visibility tools scramble to keep pace.
If you manage freight, operate terminals, run a 3PL, or make sourcing decisions that depend on ocean shipments hitting inland deadlines, this is the layer of your supply chain that deserves the most scrutiny and often gets the least visibility. Here’s how it works, where it breaks, and what the data says about where it’s headed.
What Port Logistics Actually Covers
Port logistics is the coordinated movement, storage, documentation, inspection, and release of cargo through a port into inland supply chains. It is not limited to loading and unloading vessels. It spans every handoff from the moment a ship announces its call to the moment freight clears the gate or rail and enters domestic transport.
The sequence runs roughly like this:
- Before a vessel arrives, the carrier submits vessel call data, cargo manifests, dangerous-goods declarations, estimated arrival time, and stowage plans. The port authority coordinates navigation, pilotage, tugs, and berth allocation.
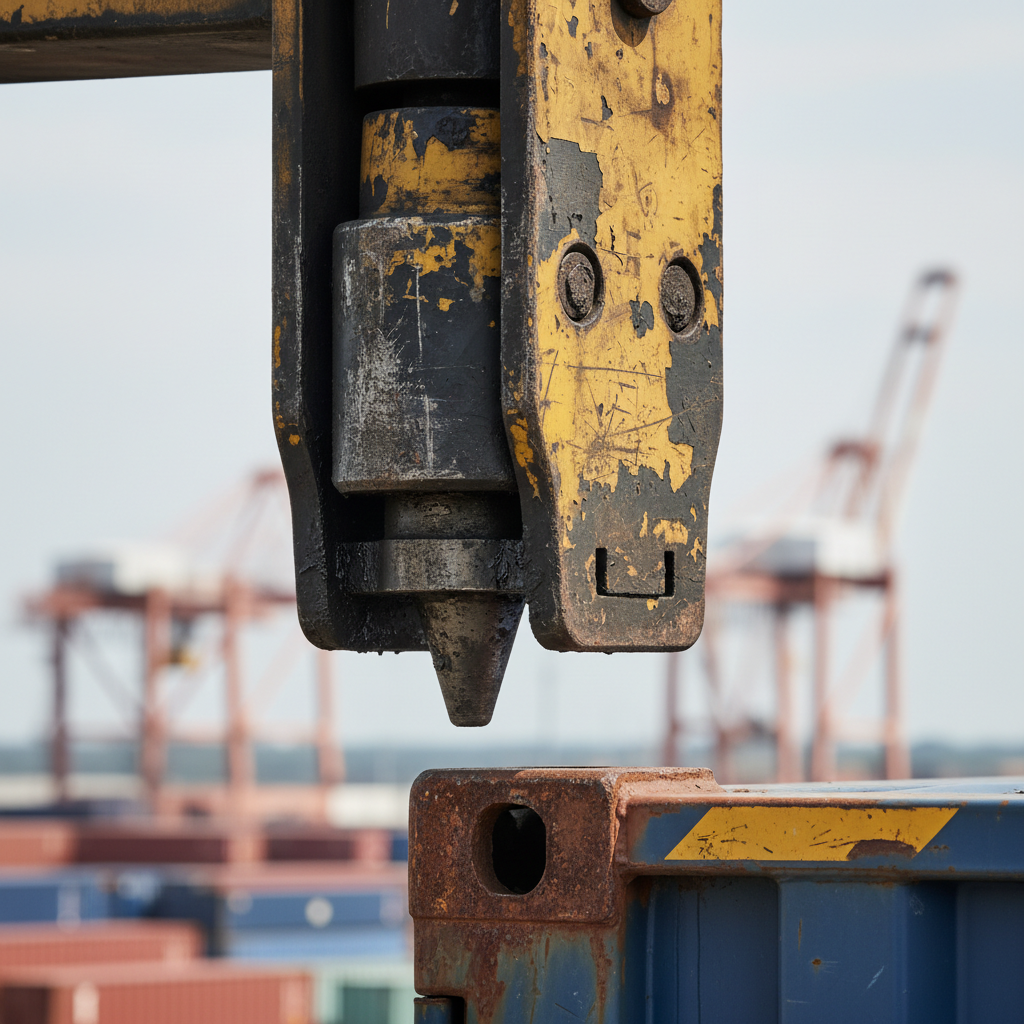
- At the quay, ship-to-shore cranes transfer containers between vessel and terminal. A poor discharge plan creates rehandles downstream, so sequencing matters from the first lift.
- In the yard, rubber-tired gantries, rail-mounted gantries, reach stackers, or straddle carriers place containers in storage blocks. Reefers get plugged into power. Hazmat gets segregated. Empties get stacked separately.
- At the gate, optical character recognition, license plate readers, truck appointment systems, and weighbridges determine whether a truck can enter and where it goes. A missed appointment slot ripples through the entire schedule.
- Customs and inspection authorities verify documentation, run scans, apply phytosanitary holds. This is where regulatory friction lives.
- On the landside, trucking, rail, or barge capacity determines whether a container exits the terminal on schedule or adds another day of dwell time.
Each step creates demand for the next. A single crane move requires a yard slot, a vehicle, power, labor, documentation, and onward transport capacity. When any one link fails, local productivity converts into queue creation. That is the central design principle of port logistics: it is a synchronization problem, not a speed problem.
The Scale Behind the Cargo Flow
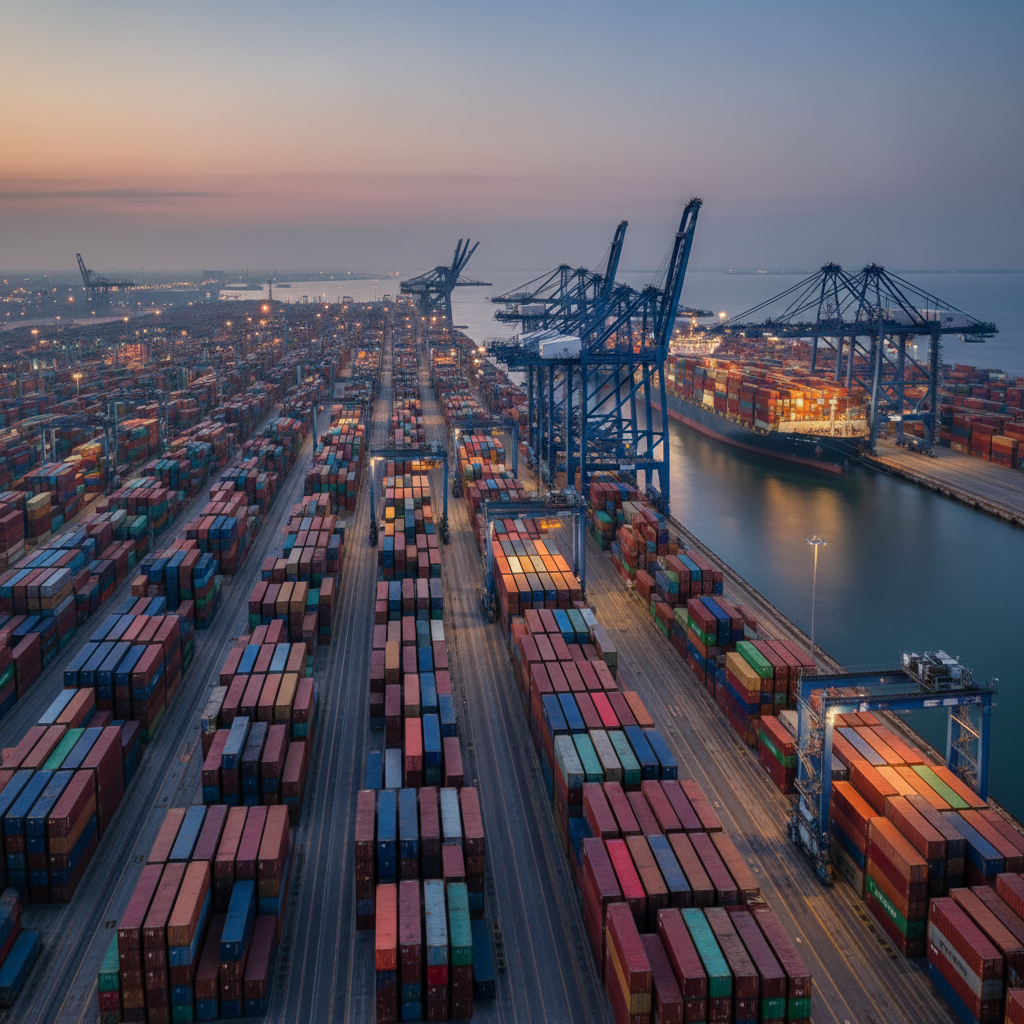
The 100 largest container ports handled 743.6 million TEUs in 2024, an 8.1% increase year over year. That means the top 100 alone account for roughly 80% of global throughput. China represented more than 40% of that traffic.
On the U.S. side, the Port of Long Beach moved 8.79 million TEUs through the first eleven months of 2024, up 20.2% from the same period the year before. San Pedro Bay remains the primary gateway for U.S.-Asia trade.
Looking ahead, UNCTAD projects maritime trade growth averaging about 2% annually through 2030, cooled from the 2.2% recorded in 2024 and the post-pandemic rebound. Growth is there, but it is moderate. The operational challenge has shifted from “build more berths for explosive demand” to “handle more complex, less predictable cargo flows through existing infrastructure.”
| Indicator | Figure | Year |
|---|---|---|
| Global container port throughput | 920 million TEUs | 2024 |
| Year-over-year throughput growth | 6.9% | 2024 |
| Top-100 port combined throughput | 743.6 million TEUs | 2024 |
| Top-100 growth rate | 8.1% | 2024 |
| Maritime trade growth forecast | ~2% annually | 2026-2030 |
| Port automation market estimate | $3.75 billion | 2024 |
One analyst estimate puts the broader port logistics market at $380.55 billion, with a 4.25% CAGR projected through 2032. The port automation segment (terminal systems, equipment, software) is estimated at $3.75 billion, growing at 10.12% CAGR. These numbers use different scope definitions and should not be combined. But the gap between them tells a story: the physical logistics spend dwarfs the technology spend. Most ports are still running on process muscle, not digital infrastructure.
Where Containers Lose Time and Money
Terminal operators watch a handful of interrelated metrics that reveal where cargo stalls: vessel turnaround time, berth occupancy, yard density, container dwell, rehandles, truck turn time, rail dwell, gate appointment compliance, and reefer alarm rates. The catch is that improving one often pressures another.
Speed up crane discharge and you flood the yard. Stack higher for density and retrieval slows while rehandles rise. Process trucks faster through the gate and you create congestion on access roads if appointment scheduling is loose. Efficiency at one node becomes a bottleneck at the next.
Container dwell time is the metric that matters most for cargo owners and freight forwarders. Every day a box sits in a terminal yard adds cost: storage fees, chassis detention, schedule slippage, working capital locked in inventory. Terminals want containers out. Trucking companies need appointments. Railroads need consistent volume. Customs needs documentation. When any party is late, the container dwells.
The World Bank’s CPPI data confirms the tension. Despite record throughput in 2024, vessel turnaround times got worse. More cargo passing through systems that weren’t proportionally faster. That isn’t a crane failure. It is a synchronization failure across dozens of interdependent actors, many of whom cannot see each other’s status in real time.
The Technology Stack Running Modern Ports
Port technology operates in three layers. Confusing them leads to bad investment decisions, especially as maritime logistics technology evolves beyond traditional terminal boundaries.
The first layer is the Terminal Operating System (TOS). This is the execution engine: vessel planning, berth and crane plans, yard inventory, equipment dispatch, truck and rail transactions, gate events, billing, and exceptions. Kaleris N4 and Tideworks Mainsail are two well-known examples. Without a TOS, a terminal runs on spreadsheets and radio calls.
The second layer is the Port Community System (PCS). A PCS does not replace the TOS. It lets shipping lines, terminals, authorities, customs, truckers, and freight forwarders exchange standardized events and documents through one shared platform. Portbase connects more than 7,000 organizations in Dutch port logistics, cutting duplicate data entry and improving predictability even at terminals where cranes are still manually operated.
The third layer is sensors, AI, and digital twins. Rotterdam’s port authority manages over 12,500 hectares and about 89 kilometers of quay walls, using real-time sensor data and AI to monitor infrastructure and detect anomalies. Digital twins let operators simulate berth plans, yard configurations, and infrastructure changes before committing physical resources. Kalmar One adds an automation orchestration layer, connecting equipment from different vendors and interfacing with the TOS to optimize container flow.
All three layers share one limitation: they stop at the terminal boundary. TOS manages the yard. PCS coordinates within the port community. Sensors watch the infrastructure. But the moment a container rolls past the gate, most of this visibility vanishes. The cargo may have shipment tracking. The container, as a physical asset, often does not.
Three Disruptions Reshaping Port Strategy
Geopolitical rerouting
When Red Sea shipping became high-risk in early 2024, UNCTAD estimated that rerouting increased global vessel demand by 3% and container-ship demand by 12%. At the same time, drought reduced Panama Canal daily transits from an average of 36 to 22. Two of the world’s most critical chokepoints constrained simultaneously.
The port-level effect: bunched vessel arrivals, equipment imbalances, empty container shortages at origin and surpluses at destination, and blown schedules cascading into inland networks. Ports with diversified rail connections and dynamic berth planning absorbed the shock better than single-mode gateways. Resilience turns out to be a logistics design choice, not luck.
Cyber as operational risk
In July 2023, a ransomware attack forced the Port of Nagoya to suspend container operations for two days. Japan’s largest port, offline. Not because a crane broke, but because software did. Separately, DP World Australia detected unauthorized network access in November 2023, disrupting operations at multiple terminals.
The U.S. Coast Guard published baseline cybersecurity requirements for the marine transportation system in January 2025. Cybersecurity is becoming regulated port infrastructure, not optional IT overhead. Ports that digitize without network segmentation, manual fallback procedures, and tested recovery plans are efficient only until something goes wrong.
Labor and automation tension
The ILA-USMX master contract for 2024 through 2030 includes a 62% wage increase and full protections against automation. The trade-off made explicit: U.S. East and Gulf Coast ports get labor stability for six years. Terminal operators cannot unilaterally automate their way to productivity gains.
Greenfield automation works where land, capital, and policy align. Singapore’s Tuas Port, designed for 65 million TEUs at targeted completion in the 2040s, is the clearest large-scale example. Brownfield automation requires workforce negotiation, job redesign, training investment, and phased implementation. Technology readiness is not the bottleneck. Institutional readiness is.
Decarbonization as a Logistics Constraint
Sustainability in port logistics is no longer a report chapter. It is an operating constraint with budget implications and infrastructure dependencies.
The IMO’s 2023 GHG strategy sets the framework for reducing shipping emissions, with mandatory technical and operational measures under review. FuelEU Maritime will require shore power connections for relevant container ships at EU ports from 2030 when at berth for more than two hours. In the U.S., the EPA’s Clean Ports Program has awarded 51 grants totaling nearly $3 billion for zero-emission equipment and infrastructure.
The results of early movers are real. Long Beach has achieved a 90% reduction in diesel particulate emissions, 68% in nitrogen oxides, and 98% in sulfur oxides since 2005. But electrification also creates new constraints: grid interconnection, charging uptime, battery management, energy pricing, and equipment compatibility.
Shore power means substations, compatible vessel interfaces, and energy management software. Electric cargo handling equipment means charging infrastructure and grid capacity. These are not bolt-on environmental projects. They are logistics infrastructure that needs to be planned alongside berth scheduling, yard layout, and equipment procurement. Ports that treat decarbonization as a separate initiative from operations will find themselves retrofitting systems they just installed.
The Visibility Gap After the Port Gate
Here’s a question I ask port operators and freight forwarders regularly: you can tell me exactly where a container is while it sits in your yard. Precise block, row, tier, bay. Can you tell me where it is three weeks after it left your gate?
Almost universally, the answer is no. The gap between terminal precision and full supply chain transparency is exactly what a comprehensive logistics visibility platform is designed to bridge.
Port logistics technology is built for the terminal. TOS tracks containers within the yard. PCS coordinates events within the port community. Sensors monitor the infrastructure. But the physical asset (the container itself, the chassis, the ULD, the ground support equipment) often goes dark the moment it exits the gate.
This is where shipment tracking and asset tracking diverge. Shipment tracking follows cargo to its delivery point. Asset tracking follows the physical container through its entire lifecycle: deployment, use, dwell at a customer site, return, repositioning, reuse. For anyone managing a reusable container pool, chassis fleet, or specialized equipment, the difference is measured in operational dollars.
When cycle times are invisible, dwell at customer facilities grows unchecked. Damage goes undetected until the asset finally returns (if it returns). Utilization rates are guessed instead of measured. Procurement decisions are driven by “we don’t have enough” when the real problem is “we can’t see what we have.”
That gap between the terminal gate and the full asset lifecycle is where capital quietly disappears. Port technology gives you yard precision. What follows is often silence. If your container pool or reusable equipment becomes invisible after the port gate, that’s precisely the gap ocean equipment tracking is built to close.
Frequently Asked Questions
What is port logistics?
Port logistics is the coordinated system of moving, storing, inspecting, documenting, and releasing cargo through a port into inland supply chains. It covers vessel arrival, berth planning, crane operations, yard management, gate processing, customs clearance, trucking, and rail connections. The central challenge is synchronization across dozens of interdependent actors and systems.
What is the difference between a port and a terminal?
A port is the broader geographic, regulatory, and infrastructure system. A terminal is an operating facility within it that handles specific cargo types (containers, bulk, vehicles, breakbulk). A single port typically contains multiple terminals with different operators, equipment, and software platforms.
Why do containers lose time at ports?
Container dwell time increases when any link in the chain breaks: customs holds, missing documentation, truck appointment failures, chassis shortages, rail slot unavailability, or yard congestion. The root cause is usually a synchronization failure between parties who cannot see each other’s status in real time, not a shortage of crane speed.
What technology runs a modern port?
Three layers: a Terminal Operating System (TOS) for execution planning and yard management, a Port Community System (PCS) for multi-party information exchange, and a sensor/AI/digital-twin layer for infrastructure intelligence and decision support. Automation equipment spans all three. Most of this technology stops at the terminal boundary.
How does asset tracking differ from shipment tracking in port logistics?
Shipment tracking follows cargo to its delivery point and ends there. Asset tracking follows the physical container, chassis, or equipment through its full lifecycle, including dwell time at customer sites, return trips, repositioning, and reuse. Without asset tracking, reusable equipment pools become invisible after the port gate, inflating cycle times and capital waste.
What is the biggest risk to port logistics today?
No single risk dominates. Geopolitical rerouting, cyberattacks on port systems, labor constraints, and decarbonization mandates all converge simultaneously. The common thread is that ports optimized for steady-state efficiency are now exposed to volatility they weren’t designed for. Resilience requires redundancy, cross-party visibility, and tested fallback capabilities.
Port logistics doesn’t end at the terminal gate, and neither should your visibility. If the assets moving through your supply chain disappear the moment they leave the port, that’s a gap worth closing. Talk to our team or reach us at info@datanetiot.com.


 +1 508 292 2210

2 Responses