

In 2024, 97% of companies disclosed sustainability information. That sounds like progress. But disclosure and reduction are not the same thing. Most sustainability data management programs were built to fill a report, not to change an operation. The result: organizations spend months collecting numbers they never act on. (See also: how to reduce carbon footprint.)
I’ve spent over 15 years deploying IoT solutions across industrial supply chains, aviation, and logistics. I see the gap between collected data and operational change every week. This article is for the sustainability head buried in spreadsheet requests, the CFO who just inherited ESG reporting, and the operations lead wondering why the carbon numbers never match the invoices. I’ll walk through what sustainability data management actually requires, where programs stall, and how to build a system that survives the next regulatory shift without starting over.
What Sustainability Data Management Actually Means
Sustainability data management is the controlled lifecycle of environmental, social, and governance information. Collecting it from source systems. Classifying it against a defined taxonomy. Calculating metrics using documented methods. Validating results. Governing changes. Reporting to stakeholders. And, the part most organizations skip, feeding insights back into operations so something actually changes.
It is not a dashboard. It is not an annual PDF. It is not a carbon calculator that produces a number you cannot trace back to its origin.
The market confusion does not help. Grand View Research values the sustainability management software market at $3.7 billion in 2025, projecting 17.6% CAGR through 2033. But that figure bundles carbon accounting tools, enterprise ESG suites, ERP add-ons, and consulting-led compliance programs into one category. Technavio frames it differently, estimating a $1.82 billion incremental increase at 14.9% CAGR through 2030. The numbers diverge because the definitions do. A company shopping for a “sustainability data solution” might be buying anything from a Scope 1 calculator to a full governance platform.
What matters more than market size is the architecture underneath. A useful sustainability data system has five layers:
| Layer | What it does | What breaks without it |
|---|---|---|
| Source ingestion | Connects utility bills, fuel records, travel systems, procurement, sensors, supplier surveys, HR data | Manual collection creates gaps, delays, and transcription errors |
| Semantic model | Maps activities to entities, sites, scopes, categories, and reporting frameworks | The same fuel purchase gets classified differently by two teams |
| Calculation engine | Converts activity data to emissions or metrics using versioned factors and methods | A changed emission factor restates your entire inventory with no audit trail |
| Governance | Detects exceptions, enforces approvals, logs changes, assigns ownership | Nobody can explain who approved the number in the annual report |
| Action layer | Connects approved metrics to reduction targets, procurement decisions, capital plans | The report gets filed. Nothing changes. |
Most organizations have the first two layers partially in place. The fifth, the action layer, is where the value lives. It is also the one most programs never reach.
Why Most Programs Stall After the First Report
There is a pattern I see repeatedly across industrial and logistics clients. A company assembles its first sustainability report, usually under regulatory or investor pressure. The process takes six to nine months. A small team sends hundreds of data requests across departments. Finance provides energy spend. Facilities sends utility bills. Procurement forwards supplier lists. HR contributes headcounts. Travel shares booking records.
The report gets published. Everyone exhales.
Then nothing happens.
The data collected was good enough to populate a framework template. It was not structured to answer operational questions like: “What is our carbon intensity per route?” or “Which supplier category drives the most Scope 3 exposure?” or “If we switch this logistics corridor, what is the emissions delta?” Those questions need a different data architecture than the one built for annual disclosure.
This is the “Day 2” problem. The report is Day 1. Day 2 is when someone asks: “Now what do we actually do with this?”
The usual answer: rebuild the spreadsheet next year.
Research published in The Accounting Review found that mandatory carbon reporting was associated with declines in three forms of greenwashing: excessive length, over-optimism, and vague commitments. Structured, reviewable data constrains vague claims. That is encouraging. But it also highlights the gap: most programs are designed to survive an audit, not to drive a reduction.
The fix is not more software. It is designing the data model for decisions from the start, not retrofitting it after the disclosure deadline passes.
Where the Numbers Actually Come From
The quality of any sustainability metric is limited by the quality of its source data. And most source data is worse than people assume.
In my work deploying tracking and sensing solutions, I see three distinct tiers of sustainability data, ranked by reliability and decision-usefulness:
The first tier is primary measured data, generated by meters, sensors, telematics, and direct operational records. A fuel flow sensor on a generator. A GPS tracker logging vehicle routes and idle time. An environmental sensor recording temperature and energy consumption in a warehouse. This data is timestamped, granular, and traceable. It is also the hardest to collect at scale.
The second tier is primary reported data from invoices, utility bills, supplier declarations, and travel booking systems. It is real but often delayed, aggregated, and inconsistent in units or periods. A utility bill covers a billing cycle that may not align with your reporting period. A supplier declaration may use a different system boundary than your inventory requires.
The third tier is estimated data, filling gaps with spend-based proxies, industry averages, or modeled assumptions. It is the fastest to produce and the least useful for decisions. Telling a logistics manager that their Scope 3 estimate increased because diesel prices rose (not because they moved more freight) does not help them optimize a single route.
The practical goal: move as much data as possible from Tier 3 to Tier 1 over time. Not all at once. Not everywhere. Start with the categories that drive the largest emissions and the largest operational spend.
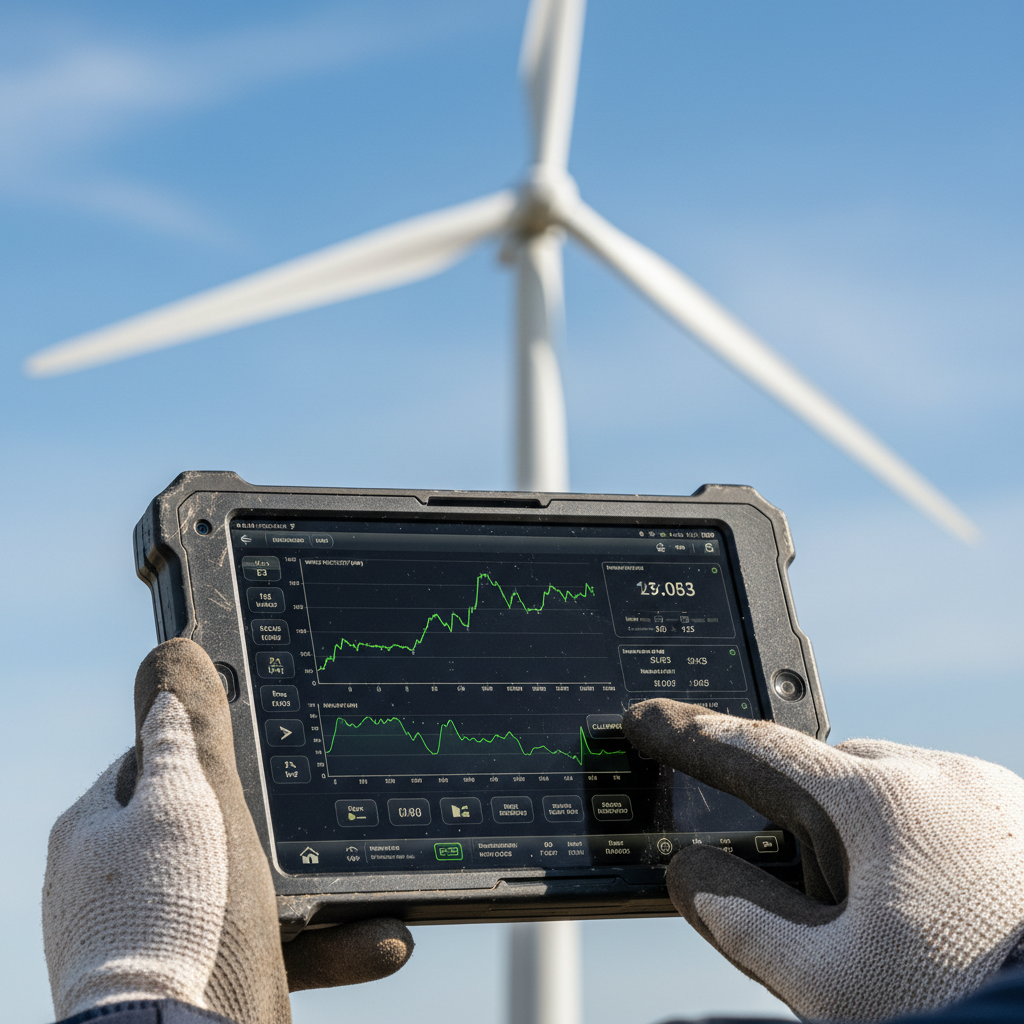
This is where operational technology makes a measurable difference. IoT sensors, asset trackers, and telematics systems generate continuous primary data streams that feed both operational management and sustainability metrics from the same source. A fleet tracker logging route distance, fuel events, and idle time does not just help dispatch. It produces Scope 1 activity data that requires no manual entry, no estimation, and no end-of-quarter scramble.
One problem that is underreported: data conflicts between sources. When your IoT sensor says a reefer container ran its cooling unit for 47 hours and the invoice says 52, which number goes into the sustainability report? The answer depends on your governance rules, your measurement hierarchy, and your tolerance for unexplained variance. But you need a system that surfaces the conflict instead of burying one source in a spreadsheet nobody reviews.
Scope 3 Is a Supply Chain Problem, Not a Reporting Exercise
The GHG Protocol’s Scope 3 Standard covers 15 upstream and downstream categories and is designed to help organizations assess their entire value chain. For most companies, Scope 3 represents the majority of total emissions. It is also the category where data quality is worst, control is lowest, and improvement potential is highest.
The difficulty is not primarily technical. It is organizational. The data sits with suppliers, logistics providers, customers, and end-of-life handlers who have no obligation to share it, no standardized format to share it in, and often no system to produce it.
Two recent cases illustrate the spectrum of maturity:
Watershed reports that Royal Mail developed a draft carbon footprint covering more than 3,000 suppliers and vendors in two months after partnering in early 2025. Royal Mail’s stated target is a 25% Scope 3 reduction by 2030. The speed benchmark is noteworthy. But the harder question is what follows: how many suppliers respond with primary data versus estimates, and which procurement decisions change as a result.
Unilever reports 181 suppliers participating in its 2024 Supplier Climate Programme, with value-chain reduction targets of 30.3% for FLAG emissions and 42% for energy and industrial emissions by 2030. Supplier count matters less than the data contract: what fields, units, boundaries, evidence, and response cadence does each supplier commit to?
A supplier portal without clear specifications just digitizes inconsistency. The minimum viable Scope 3 program needs:
- A prioritized supplier list ranked by emissions contribution, not alphabetical order
- Defined data fields, units, system boundaries, and documented estimation fallbacks
- A response workflow with escalation paths and exception handling
- Clear separation between measured, reported, and estimated values in the data model
- A feedback loop connecting supplier data to procurement scoring and reduction decisions
The infrastructure for supplier data exchange is forming. The PACT initiative from WBCSD is building scalable, verifiable product-carbon-data exchange aligned with ISO and GHG Protocol approaches. CDP reported a 98% supplier response rate in its 2024 supply-chain program. These are plumbing signals. The question for your organization is whether internal systems can consume and act on what suppliers eventually share.
Designing for Regulatory Whiplash
If you built your sustainability data system around a single regulation, the past 18 months have been uncomfortable.
In Europe, the first CSRD reports covered FY2024 under ESRS, while later waves were postponed. Then in July 2026, the European Commission adopted revised ESRS that cut mandatory datapoints by more than 60%. If you need to track how these phases still apply to your organization, the full CSRD timeline lays out every remaining deadline, understanding when CSRD reporting is required helps confirm which wave you fall into, and if you operate across the Channel, it is worth checking whether the CSRD applies to the UK. Meanwhile in the US, the SEC proposed rescinding its 2024 climate-disclosure rules outright in May 2026.
Two major jurisdictions. Opposite directions. Same reporting year.
The lesson is not that regulation does not matter. Customer requirements, lender covenants, investor questions, and employee expectations persist regardless of what the SEC decides, and even smaller firms wonder whether the CSRD applies to private companies. The lesson is that your data model cannot be hard-coded to any single framework.
The ISSB organizes disclosure around four pillars: governance, strategy, risk management, and metrics and targets, with IFRS S2 applied alongside S1. ESRS adds double materiality and a broader social dimension. GRI structures impact reporting by topic. Each framework asks different questions from overlapping underlying data.
IFRS Foundation and EFRAG published joint interoperability guidance recommending that companies collect, govern, and control useful data once, then reuse it across reporting regimes. The right principle. In practice, it demands:
- A canonical data model with stable entity identifiers, activity types, and calculation methods
- Explicit, maintained mappings from your internal taxonomy to each framework
- Versioned emission factors and formulas so a restatement preserves the prior version
- Coexisting materiality assessments (financial for ISSB, double materiality for ESRS)
- A reporting calendar by legal entity, fiscal year, and jurisdiction
An organization that treats sustainability data as a governed evidence base with configurable views will spend weeks adapting to a regulatory change. One that hard-coded CSRD requirements into a single workbook will spend months rebuilding.
AI in Sustainability Data: Faster Answers, Fragile Assumptions
A Thomson Reuters survey found that nearly 90% of organizations expect AI to materially affect sustainability reporting. In the same survey, 42% cited data volume and 50% cited data quality as major challenges.
Those two findings belong together.
AI is genuinely useful at the messy edges of sustainability data: extracting values from utility invoices and supplier PDFs, classifying procurement spend into emission categories, matching supplier records across systems, detecting outliers in facility data, identifying coverage gaps, and drafting disclosure narrative from approved metrics. These are real productivity gains. I have seen data-cleaning tasks that used to take a full night reduced to minutes when the right extraction tools were applied.
The risk is that AI makes bad assumptions look precise. A model that auto-classifies procurement spend into Scope 3 categories can process thousands of line items in minutes. If the classification logic assigns a high-emission factor to a low-emission category (or vice versa), you now have a precisely wrong footprint that nobody questions because it came from the system.
Automation without provenance produces faster uncertainty.
The practical rule: AI proposes, humans approve. Every model-generated classification should be reviewable and reversible. Every emission factor selection should be traceable to a documented source and version. Every gap-filled estimate should be flagged as an estimate in the data model, never buried in a calculated total that looks like measured data.
This is not an argument against AI. It is an argument for keeping the evidence chain intact. A model that helps a data owner find, classify, and validate records 5x faster is a force multiplier. A model that autonomously publishes metrics without human review is a greenwashing risk waiting for an auditor.
What Mature Sustainability Data Management Looks Like
Maturity is not measured by the number of ESG indicators in your platform. It is measured by whether the data changes how money is spent, how suppliers are selected, and how operations run.
A useful maturity progression works across three horizons:
In the near term, stabilize the foundation. Assign data ownership by source. Establish collection workflows with defined cadence and exception handling. Map calculation methods and emission factors to documented, versioned references. Build audit trails. Get Scope 1 and 2 numbers to a quality level that survives external assurance. 75% of companies obtained assurance on at least some sustainability disclosures in 2024, so if your data cannot withstand that scrutiny, this is where to invest first.
Over the medium term, extend the boundary. Add Scope 3 supplier and product-level data through structured engagement programs. Deploy AI for extraction, classification, and exception management with human approval gates. Build scenario analysis to test reduction pathways before committing capital. Replace estimated data with primary data where the emissions impact justifies the collection cost.
This is where primary operational data from IoT devices, environmental sensors, and asset tracking systems becomes a strategic input, not just an operational tool. A temperature and humidity logger on a cold-chain shipment does not only protect product quality. It generates verifiable energy and emissions data for that segment of your supply chain. Similar principles apply across sectors requiring precise environmental monitoring, from aquaculture data management to logistics. A GPS tracker on reusable transport assets provides cycle times, dwell times, and utilization rates that directly affect your logistics footprint. The sensor does not know it is feeding a sustainability report. The data architecture just needs to route that information to both operational and sustainability workflows.
In the longer term, connect metrics to capital. Link approved sustainability data to procurement scoring, capital allocation, product design, and customer offerings. When a carbon metric influences which supplier gets the contract or which facility gets the retrofit budget, sustainability data management has become an operating capability, not a reporting function.
Schneider Electric reports enabling customers to save or avoid 862 million tonnes of CO2 by end of 2025, alongside a 56% operational CO2 reduction among its top 1,000 suppliers. The relevant lesson is not the headline number. It is the organizational design: sustainability KPIs embedded in supplier programs, customer value propositions, and business unit scorecards. Data flows because it is connected to decisions that matter to people beyond the sustainability team.
A word on claims, though. “Enabled” savings and “avoided” emissions are not the same as reducing a company’s own inventory. SBTi’s proposed V2 position holds that carbon credits may complement, but not substitute for, operational and supply-chain decarbonization. Your data model should force every KPI to declare its numerator, denominator, baseline, boundary, attribution rule, and assurance status. The easiest way to erode credibility is to net different types of impact into a single number that looks better than the underlying operations warrant.

Frequently Asked Questions
What is sustainability data management?
It is the controlled lifecycle of environmental, social, and governance information: collecting from source systems, classifying against defined taxonomies, calculating metrics using documented and versioned methods, validating results, governing changes, reporting to frameworks like GHG Protocol, GRI, ISSB, and ESRS, and feeding insights back into operational decisions. It is broader than carbon accounting and deeper than ESG reporting.
How is sustainability data management different from ESG reporting?
ESG reporting is an output: a document or filing for stakeholders. Sustainability data management is the underlying system that determines whether reported numbers have defined boundaries, traceable sources, documented calculation methods, assigned owners, and review histories. Rising assurance requirements make this distinction increasingly consequential.
Why is Scope 3 data so difficult to manage?
The GHG Protocol Scope 3 Standard covers 15 categories of value-chain emissions where data resides with suppliers, logistics providers, customers, and end-of-life handlers. These parties use different systems, units, boundaries, and reporting cadences. Moving from spend-based estimates to primary supplier data requires structured data contracts, standardized fields, and active procurement engagement.
What role does IoT play in sustainability data collection?
IoT devices (environmental sensors, GPS trackers, telematics, energy meters) generate primary measured data: fuel consumption, energy use, temperature conditions, route distances, idle times, and equipment utilization. This data is timestamped, granular, and traceable, making it far more decision-useful than invoice-based estimates. It also serves dual purposes, feeding operational management and sustainability metrics from a single source.
Can AI automate sustainability data management?
AI accelerates extraction, classification, gap detection, anomaly flagging, and narrative drafting. It cannot independently determine organizational boundaries, materiality judgments, factor selections, or whether a published claim is misleading. Responsible implementation means AI proposes and a human approves, with source documents, method choices, and confidence indicators retained at every step.
How should companies handle diverging regulations like CSRD and SEC changes?
Build a jurisdiction-neutral data model with stable identifiers, versioned calculation methods, and explicit framework mappings. Maintain separate materiality lenses (financial materiality for ISSB, double materiality for ESRS). Use configurable reporting views. This lets you adapt to regulatory changes in weeks, while organizations locked into a single framework spend months rebuilding.
If your sustainability reports still lean on spend-based estimates where primary sensor data could exist, that is a gap worth closing. Our environmental tracking and asset tracking devices generate the kind of source data that sustainability programs need and operations teams already use. Talk to our team: datanetiot.com/contact-us or info@datanetiot.com.








 +1 508 292 2210

3 Responses