

Energy-related CO2 emissions hit a record 37.8 gigatons in 2024. Total greenhouse gases, excluding land-use changes, reached 53.2 GtCO2e that same year. Every company with a supply chain, a fleet, or a building carries a measurable piece of those numbers. Carbon accounting is the discipline that quantifies that piece. (See also: how to reduce carbon footprint.)
Not a badge. Not a press-release metric. A controlled system for measuring, classifying, and reporting the greenhouse gases your operations and value chain put into the atmosphere, built on the same principles that govern financial books: relevance, completeness, consistency, transparency, and accuracy.
This guide covers the full picture: what carbon accounting actually means, how the math works, which regulations apply in 2026, and where programs collapse when the underlying data is unreliable. If you’re a sustainability lead building an inventory that needs to survive audit, a finance executive navigating new disclosure requirements, or an operations manager whose data feeds the whole system, this is written for you.
What Carbon Accounting Actually Means
The GHG Protocol Corporate Standard, the most widely adopted framework, exists to produce “a true and fair account” of an organization’s emissions, reduce inventory costs over time, and support strategies that actually cut greenhouse gases.
“Carbon” is shorthand. The system covers seven gases from the Kyoto Protocol: CO2, methane, nitrous oxide, HFCs, PFCs, SF6, and NF3. Each converts to a CO2 equivalent (CO2e) using global warming potential values, so everything rolls up into one comparable unit.
A common mistake: treating “carbon accounting” and “carbon footprint” as the same thing. The footprint is the number (see what is carbon footprint for a deeper look). Carbon accounting is the system that produces it: boundaries, methods, emission factors, evidence chains, change controls, and audit trails. The distinction matters because two companies can report the same footprint using different boundaries and assumptions. Without the accounting detail, nobody can tell whether those numbers mean the same thing.
In practice, carbon accounting splits into four approaches that serve different purposes and should never be collapsed into a single net-zero figure:
| Approach | Boundary | Main output | Decision use |
|---|---|---|---|
| Corporate GHG inventory | Organization + value chain | Annual Scope 1, 2, 3 CO2e | Targets, risk management, disclosure |
| Product carbon footprint | Product life cycle | CO2e per unit or function | Design, procurement, labeling |
| Financed emissions | Loans, investments, portfolios | Attributed portfolio emissions | Capital allocation, engagement |
| Credit / removal accounting | Project baseline vs. intervention | Claimed reductions or removals | Residual emissions, climate finance |
Mixing them creates problems. A company’s gross inventory records what it emits. A credit records what someone else claims to have reduced. Reporting a net number that blends both obscures whether the business is actually changing or just paying to look like it is.
Scopes 1, 2, and 3: The Building Blocks
The GHG Protocol organizes emissions into three scopes. Think of them as concentric circles radiating outward from what a company directly controls.
| Scope | What it covers | Typical evidence | Key risk |
|---|---|---|---|
| Scope 1 | Direct emissions from owned or controlled sources (vehicles, combustion, processes, refrigerants) | Fuel bills, meter data, process records | Missing sites, leased-asset treatment |
| Scope 2 | Purchased electricity, steam, heat, and cooling | Utility invoices, energy contracts, RECs | Location-based vs. market-based interpretation |
| Scope 3 | All other indirect emissions across 15 upstream and downstream categories | Supplier data, procurement, logistics, use-phase models | Double counting, estimation gaps, supplier coverage |
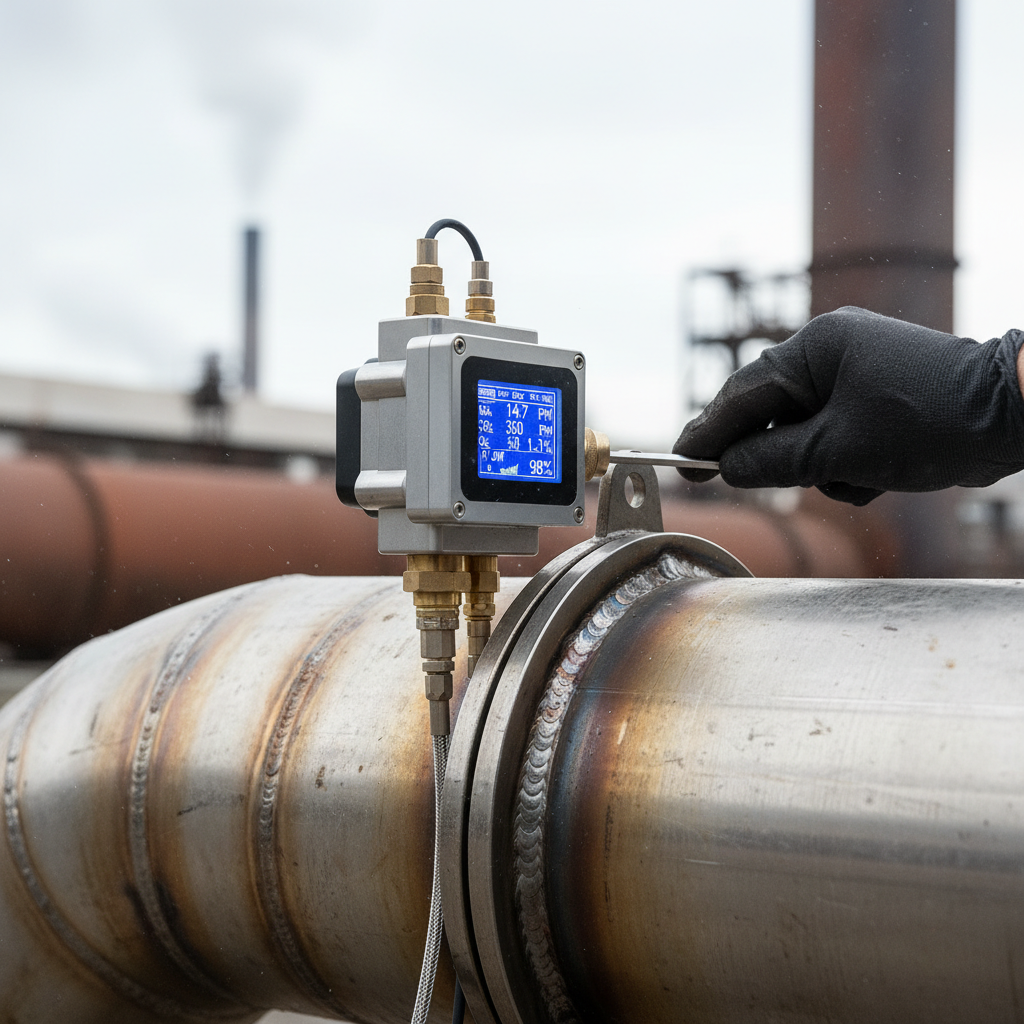
Scope 1 and 2 sit within the company’s operational perimeter. Most organizations can measure them with reasonable accuracy using utility invoices, fuel records, and process data.
Scope 3 is where both the volume and the difficulty live. CDP’s 2023 analysis showed that supply-chain Scope 3 emissions were 26 times higher than operational emissions across disclosing companies. Yet only 15% of those companies had set a Scope 3 target. That gap between measurement and action is where most programs stall.
The 15 Scope 3 categories span purchased goods and services, capital goods, fuel- and energy-related activities, upstream and downstream transport, waste, business travel, employee commuting, leased assets, processing and use of sold products, end-of-life treatment, franchises, and investments. No company measures all 15 with high precision. The practical goal is to screen every category, identify which ones are material, and invest in better data where decisions depend on it.
Before setting scope boundaries, organizations must also set organizational boundaries. The GHG Protocol offers three approaches: equity share (proportional ownership), financial control, and operational control. The choice determines which entities and assets enter the inventory. It must be applied consistently across subsidiaries, not mixed to produce a more favorable number.
How the Calculation Works
The core equation is straightforward:
Activity data × Emission factor = CO2e
Activity data is the physical or economic quantity: liters of diesel burned, kilowatt-hours consumed, tons of material purchased, dollars of procurement spend. Emission factors translate that activity into greenhouse-gas equivalents. The quality of both inputs determines whether the output means anything.
For Scope 1, data typically comes from fuel receipts and meters. For Scope 2, from utility invoices and energy contracts. Scope 3 is where methodology choices matter most, because the data crosses organizational boundaries and supplier cooperation varies wildly.
The GHG Protocol defines four methods for Scope 3 Category 1 (purchased goods and services), and the logic extends across other categories:
| Method | Input | Strength | Limitation |
|---|---|---|---|
| Supplier-specific | Product cradle-to-gate data from the supplier | Highest specificity | Coverage burden, comparability |
| Hybrid | Supplier data + secondary factors for gaps | Balances coverage and detail | Requires documented gap treatment |
| Average-data | Mass or units × industry-average factors | Simple to implement | Not specific to your supplier |
| Spend-based | Currency spend × economic emission factors | Fastest screening | Sensitive to price, inflation, sector averages |
These form a maturity ladder, not a good-versus-bad ranking. Most companies start spend-based because procurement data already exists. That’s a reasonable first step. The problem is staying there permanently: spend-based figures tell you where the money goes, not necessarily where the emissions concentrate. As the program matures, you shift toward activity-based and supplier-specific data for the categories that drive the most tonnage.
A counterpoint worth keeping in mind: more precise methods don’t automatically produce better decisions. A supplier-specific figure is only useful if the methodology behind it is documented, comparable, and consistent with the five core inventory principles. A well-documented estimate with known uncertainty can be more decision-useful than a precise-looking number built on hidden assumptions.
The 2026 Regulatory Landscape
Carbon accounting used to be voluntary for most companies. That era is ending, though unevenly.
| Regulation | Status in 2026 | What it requires |
|---|---|---|
| IFRS S2 | Effective for periods beginning Jan 1, 2024 | Climate disclosures including Scope 1, 2, and material Scope 3 |
| EU CSRD / ESRS | First reporters applied for FY2024 reports, published in 2025 | Structured sustainability disclosures, value-chain data, targets |
| California SB 253 | Program under development by CARB | Climate-data accountability for companies operating in California |
| SEC Climate Rule | Stayed April 2024; rescission proposed May 2026 | Originally required GHG and climate-risk disclosure; now in regulatory limbo |
| ISSA 5000 | Effective for periods beginning Dec 15, 2026 | General requirements for sustainability assurance engagements |
| IFRS S2 Amendments | Issued Dec 2025; effective Jan 1, 2027 | Updated Scope 3 Category 15, sector classification, GWP values |
The pattern: jurisdictions converge on mandatory climate disclosure, but timing and scope differ significantly. The EU is furthest ahead. The U.S. federal picture is politically fractured (the SEC retreating while California and investor-driven frameworks push forward). IFRS S2 provides a global baseline where adopted. Assurance requirements under ISSA 5000 raise the data-quality bar starting late 2026, which is why disciplined greenhouse gas reporting matters more than ever.
The practical move: build one controlled data model that serves multiple reporting frameworks. The underlying emissions data is the same. Only the output formats differ. Effective sustainability data management means maintaining separate spreadsheets for CDP, CSRD, IFRS, customer requests, and internal planning is how errors compound and consistency breaks.
Where Carbon Accounting Breaks Down
Three scopes, four methods, five principles. The framework sounds clean. In practice, most programs produce numbers somewhere between “directionally useful” and “actively misleading.”
The data quality bottleneck
BCG estimated a 30% to 40% margin of error in manual carbon accounting processes. That’s not surprising when you consider the inputs: scattered fuel invoices, procurement records across multiple ERPs, logistics data buried in freight-forwarder emails, utility bills arriving quarterly at best. The calculation itself is arithmetic. The hard part is getting clean, timely, complete activity data into the equation.
For Scope 3, the problem multiplies. You need data from suppliers who may have no sustainability program at all. Even a company with Unilever’s resources engaged 291 suppliers covering roughly 42% of its Scope 3 in 2024. That’s meaningful progress. But 58% of the footprint still rests on estimates. For mid-sized companies without that supply-chain leverage, coverage is thinner.
Absolute vs. intensity: the trap nobody warns you about
Walmart’s latest reporting shows a tension that catches executives off guard. Estimated Scope 3 emissions rose from 609.82 MMT CO2e in 2022 to 636.57 MMT in 2024, while intensity dropped from 1.00 to 0.94 MMT per billion dollars of net sales. More efficient per revenue dollar. More emissions in absolute terms because revenue grew.
Track only intensity, and you can declare progress while the atmospheric burden increases. Track only absolute, and you penalize growth that might displace higher-emission alternatives. A useful system reports both, alongside the activity drivers (revenue, units, tons shipped) that explain the movement.
Growth vs. reduction: the Microsoft paradox
Microsoft committed to cutting Scope 3 by more than half from its 2020 baseline by 2030. At the same time, its reported value-chain emissions increased 26% as data-center construction, hardware procurement, and cloud infrastructure expanded. The target isn’t invalid. But it illustrates what happens when carbon accounting sits in a sustainability silo instead of being wired into capital planning and procurement decisions.
The credit credibility gap
Carbon accounting and carbon credits are different instruments that keep getting merged in corporate communications. An inventory records what you emit. A credit claims someone else reduced emissions on your behalf. The inventory should always report gross emissions; credits belong in a separate ledger.
A 2024 assessment published in Nature Communications reviewed 65 studies across roughly 19% of credits issued in the analyzed project types. Across 972 million issued credits, the researchers estimated 812 million were likely not associated with real emissions reductions. Avoided-deforestation projects showed 24.7% average over-crediting. In 106 improved forest-management projects, no statistically significant reductions were found at all.
Not every credit is worthless. But presenting credit purchases as reductions inside a corporate inventory is a category error that sound carbon accounting should make structurally impossible.
The Standards That Matter
Start with the GHG Protocol Corporate Standard for your organizational inventory. It’s the most widely adopted framework and the common language that CDP, IFRS S2, and most customer questionnaires reference.
When your value chain is material (it almost always is), add the Scope 3 Standard, which structures the 15 categories and provides calculation guidance. The Scope 2 Guidance standardizes purchased-energy accounting, including rules for contractual instruments like RECs. It’s currently under revision: the first public consultation ran from October 2025 through January 2026, making Scope 2 methodology a live design issue for software and assurance teams.
If customers, regulators, or auditors require ISO certification, ISO 14064-1 provides the equivalent organization-level quantification framework. The GHG Protocol and ISO recently announced a strategic partnership to align their standards, which should reduce friction between the two systems over time.
For product-level work, the GHG Protocol Product Standard and ISO 14067 cover life-cycle carbon footprints. If your program involves labeling, design comparisons, or customer-facing claims, you need one or both.
Financial institutions measuring portfolio emissions should reference PCAF’s Global GHG Accounting Standard, now in its third edition.
Coming in January 2027: the Land Sector and Removals Standard, which sets explicit rules for land-based emissions, removals, and related claims. If your company makes removal claims or operates in agriculture, forestry, or food, this one changes the game.
Don’t try to implement every standard at once. Build the corporate inventory first. Layer on Scope 3, product, and sector-specific standards as obligations and program maturity expand.
From Spreadsheets to Systems
A small inventory (one site, few suppliers, limited disclosure requirements) can work with controlled spreadsheets. “Controlled” means version-tracked emission factors, documented assumptions, separated input and calculation layers, and approval trails. Most organizations outgrow this fast.
The software market reflects the shift. Fortune Business Insights estimates $22.51 billion in 2025, growing to $136.44 billion by 2034 at 22.2% CAGR. Grand View Research uses different category boundaries and reports $16.92 billion in 2023, reaching $67.58 billion by 2030. The numbers differ because “carbon accounting software” means different things to different analysts. The growth direction is unambiguous.
When evaluating platforms, focus on six capabilities rather than dashboard polish:
- Can you trace a reported number back to its source document, factor version, and approval? That’s data lineage, and it’s non-negotiable for assurance.
- Does the platform version-control emission factors, flag when they change, and let you override with supplier-specific data?
- Can it collect, validate, and integrate supplier data at scale, or does Scope 3 still depend on emailed spreadsheets?
- Does it connect to your ERP, procurement, utility, and logistics systems? Manual CSV uploads at quarter-end defeat the purpose of automation.
- Can an external auditor walk the evidence trail without asking your team to reconstruct it from memory?
- Can the same data model produce outputs for CDP, CSRD, IFRS S2, customer requests, and internal planning?
Here’s the piece most software evaluations skip: the best platform in the world produces unreliable numbers if the activity data feeding it is wrong. For transport emissions, you need accurate distance, mode, load, and route data. For energy, granular consumption readings beat annual estimates. For asset-intensive operations, you need to know where equipment actually moves, how long it sits idle, and whether return legs and empty runs are captured or invisible.
That last point deserves attention. Shipment tracking tells you a container arrived. Asset tracking tells you the full cycle: origin, transit, dwell, return, reuse. In carbon accounting terms, shipment tracking captures one leg. Asset tracking captures the activity data for every leg, including the return movements, repositioning trips, and idle periods that most programs ignore because operational visibility ends at delivery. Those invisible movements carry real emissions that real inventories miss.
What Changes From Here
Several shifts are reshaping carbon accounting through 2027 and beyond.
Standards are converging. The GHG Protocol Scope 2 revision, the Land Sector and Removals Standard (effective January 2027), and the GHG Protocol/ISO partnership all push toward tighter alignment between frameworks. Companies maintaining flexible data models will adapt faster than those locked into one reporting template.
Assurance is becoming continuous. With ISSA 5000 taking effect for periods beginning December 15, 2026, and 73% of S&P 500 companies already obtaining some form of sustainability assurance, the question shifts from “do we need assurance?” to “can our system produce audit-ready evidence without a year-end scramble?” Capturing evidence as transactions happen, rather than reconstructing it after the fact, becomes the operating standard.
AI is entering the workflow, but not replacing the accounting. The valuable applications are factor matching, document extraction, anomaly detection, and supplier follow-up. The dangerous application is an unreviewed net-zero answer that treats a language model’s output as a calculation. Deterministic math and human approval must stay visible in the audit trail.
Claim discipline is tightening. Credit-quality controversies, the Oxford Principles revision, and the Land Sector Standard all point toward a future where companies must disclose gross emissions, reductions, removals, and credits as separate line items. A low net number that masks rising gross emissions or questionable credits will not survive scrutiny from investors, auditors, or informed customers.
And the disclosure ecosystem keeps expanding. More than 22,100 companies disclosed through CDP in 2025. Supplier disclosure requests are proliferating. If you haven’t received one yet, you will. Preparing before the request arrives costs less than scrambling after.
Carbon accounting creates value when it changes what an organization buys, designs, builds, and operates. The number itself is just the starting point. What matters is the data quality behind it, the controls that make it auditable, and the operational decisions it actually informs. Done well, it becomes one of the sustainable business practices that hold up to scrutiny and a core part of any credible corporate sustainability strategy. If the physical layer of your operations (fleet movements, asset cycles, energy consumption, container logistics) feeds estimates instead of measurements, the gap between reported emissions and reality is wider than any software can fix.
That physical data layer is what we build at Datanet IoT Solutions. Our asset tracking devices and environmental sensors generate the activity data carbon accounting depends on. These industrial IoT solutions close the gap between operational reality and reported emissions. If your emissions reporting still runs on carrier estimates and quarterly invoices, let’s talk about closing that gap.
Frequently Asked Questions
What is carbon accounting?
Carbon accounting is the standardized measurement, classification, and reporting of greenhouse-gas emissions tied to an organization, product, project, or financial portfolio. The GHG Protocol Corporate Standard is the most widely used framework, designed to produce a “true and fair account” of emissions and support reduction strategies. It covers seven greenhouse gases, all converted to CO2 equivalents for comparability.
What is the difference between Scope 1, 2, and 3?
Scope 1 covers direct emissions from sources a company owns or controls (vehicles, furnaces, refrigerants). Scope 2 covers purchased electricity, steam, heat, and cooling. Scope 3 covers all other indirect emissions across 15 value-chain categories, from purchased goods and transport to product use and end-of-life treatment. Scope 3 typically dwarfs Scopes 1 and 2 combined.
Is carbon accounting mandatory?
It depends on jurisdiction and company size. The EU’s CSRD requires structured reporting from large companies starting with fiscal year 2024. IFRS S2 applies where adopted. California’s SB 253 creates state-level obligations. The SEC’s federal rule was proposed for rescission in May 2026. Even where not legally required, supply-chain pressure from customer questionnaires and CDP requests makes it functionally mandatory for many suppliers.
Is buying carbon credits the same as reducing emissions?
No. A credit claims a reduction or removal from a project outside your operations. Your inventory should still report gross emissions. A 2024 Nature Communications study estimated that roughly 812 million of 972 million analyzed credits were likely not linked to real reductions. Credits may play a role for residual emissions, but they don’t replace operational cuts.
How accurate is Scope 3 data?
Accuracy varies by method and category. Spend-based estimates are fastest but most sensitive to price fluctuations and sector averages. Supplier-specific data offers higher specificity but requires cooperation and comparable methodologies. Most mature programs combine methods: screening broadly with spend data, then investing in primary data for the largest sources. Disclosing the method and coverage alongside the number is more honest than implying precision that doesn’t exist.
Do I need carbon accounting software?
Not necessarily at the start. A well-controlled spreadsheet can handle a small inventory. Software becomes valuable when you need version-controlled emission factors, supplier data collection at scale, ERP integrations, multi-framework reporting, and an audit trail that doesn’t depend on one analyst’s memory. Evaluate platforms by data lineage, factor governance, and assurance readiness, not by dashboard aesthetics.








 +1 508 292 2210

4 Responses