

The environmental monitoring market reached $18.68 billion in 2025. Sensor costs keep dropping. Satellites now revisit hourly. And yet, most organizations deploying continuous environmental tracking still can’t answer one question: did the data change a decision? (See also: challenges of tracking assets in aerospace operations.)
That disconnect is where budgets disappear. I’ve spent over 15 years deploying IoT tracking solutions across aerospace, freight, and industrial operations. The pattern repeats regardless of vertical: temperature in an airfreight ULD, methane at a wellhead, humidity in a pharmaceutical warehouse. If the measurement chain breaks at any layer, you collect data nobody trusts and nobody acts on.
Continuous environmental tracking is not a sensor purchase. It is an evidence-and-decision system. Here’s what that means in practice, and where most implementations fall short.
What Continuous Environmental Tracking Actually Means
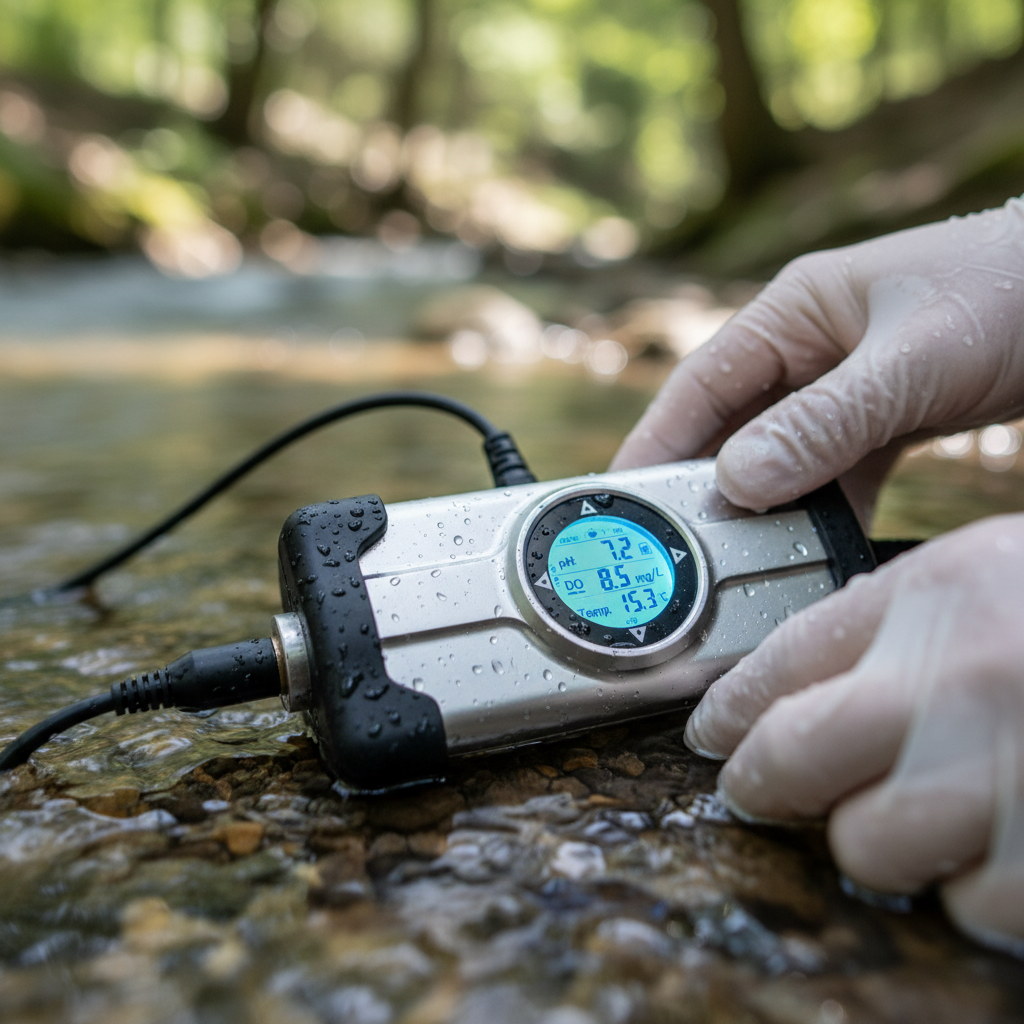
Continuous environmental tracking is the repeated or uninterrupted measurement of environmental conditions (air quality, temperature, humidity, water chemistry, soil composition, emissions, noise) connected to data transmission, quality control, analysis, and a response. The “continuous” part describes the observation-and-delivery pattern, not a single product or technology.
Three distinctions matter:
- Continuous monitoring means the sensor measures at regular intervals (seconds, minutes, or hours) and transmits automatically. No programmed gaps in coverage.
- Periodic monitoring means someone collects a sample or takes a reading on a schedule (weekly, monthly, quarterly). Gaps are built into the design.
- Intermittent monitoring means readings happen only when triggered by an event, threshold, or manual request.
The MarketsandMarkets 2025 report identifies continuous monitoring as the largest sampling-method segment, driven by real-time pollution data needs and tightening regulations. That tells you where the market is heading, and it explains why the term now spans everything from industrial CEMS stacks to palm-sized IoT sensors riding inside a shipping container.
The Numbers Behind the Urgency
Why is continuous environmental tracking growing at roughly 5.4% to 5.7% CAGR across analyst estimates? Five forces are converging, and each one creates buyer demand that didn’t exist a decade ago.
Health burden. The State of Global Air 2024 report documented 8.1 million deaths from air pollution in 2021, including over 700,000 children under five. WHO estimates that 99% of the global population breathes air exceeding guideline limits. Dense, trustworthy environmental data is public health infrastructure now, not a research curiosity.
Regulatory acceleration. The EU methane regulation requires source-level quantification and annual third-party verification, with importer reporting live since 2025 and stronger MRV conditions for new import contracts kicking in January 2027. EPA rules for Continuous Emission Monitoring Systems (CEMS) already mandate traceable measurement chains for many industrial facilities. Compliance is shifting from periodic inspections and modeled inventories toward continuous evidence.
Disaster response. The 2025 Canadian wildfire smoke episode proved the point. NOAA combined satellite imagery, NWS models, and EPA ground observations to issue health warnings as smoke moved into the Upper Midwest. No single data source was enough.
Climate accountability. GHGSat’s dedicated methane satellites now image individual facilities at roughly 25 m x 25 m resolution, pinpointing emission sources that annual inventories would never catch. Direct observation is replacing estimation.
Sustainability and supply-chain reporting. Finance, insurance, and procurement teams increasingly need environmental evidence for ESG disclosures, carbon accounting, and risk assessment. That evidence must be continuous, traceable, and defensible, not a one-time audit.
Seven Layers Between a Sensor and a Decision
This is where most deployments fail. Organizations buy the sensor and skip the rest. A continuous environmental tracking system has seven layers. A gap at any layer breaks the chain.
| Layer | What it does | Where it breaks |
|---|---|---|
| 1. Measurement | Gas analyzers, particulate counters, temperature/humidity sensors, water sondes, acoustic devices | Drift, fouling, cross-sensitivity, miscalibration |
| 2. Position and context | GNSS coordinates, site metadata, calibration records, land use, meteorology | Missing metadata makes valid readings uninterpretable |
| 3. Connectivity | Cellular, LoRaWAN, satellite telemetry, Wi-Fi, edge storage | Outages, bandwidth limits, dead zones at altitude or sea |
| 4. Quality assurance | Calibration, reference-instrument collocation, flags, maintenance schedules | Skipped QA turns data into noise |
| 5. Data platform | Time-series database, geospatial catalog, API, dashboard, alert engine | Vendor lock-in, incompatible schemas, no export path |
| 6. Analytics | Statistical baselines, anomaly detection, dispersion models, machine learning | Model error mistaken for measurement certainty |
| 7. Decision and response | AQI alert, compliance report, leak repair, route change, equipment intervention | No accountable owner. Data stays on a dashboard nobody checks. |
I see the same failure across sectors. An airline installs environmental sensors on ULD containers to monitor temperature during airfreight transit. The hardware works fine. But nobody defined what happens when a reading breaches a threshold at 35,000 feet. No escalation path, no responsible party, no documented response. Six layers of infrastructure producing a seventh layer of nothing.
The question to ask before any deployment: who receives the alert, and what are they authorized to do?
Where Continuous Tracking Changes the Outcome
Continuous environmental tracking only justifies its cost when it changes an outcome. Five areas where the evidence is clearest.
Air quality and wildfire smoke
NASA’s TEMPO mission delivers hourly daytime air-quality observations across North America, resolving details down to a few square miles with under-three-hour data delivery. During the 2025 wildfire season, TEMPO identified thick smoke entering the Dakotas while rural ground networks were sparse. NOAA’s forecasters fused satellite data, models, and surface observations to issue actionable health warnings the same day.
The lesson: satellites reveal regional plumes, ground instruments validate near-surface conditions. The combination creates intelligence. Either one alone leaves dangerous blind spots.
Water quality and nutrient management
USGS super-gage stations in Indiana and Kentucky continuously measure streamflow, water chemistry, nitrate, and phosphate, transmitting hourly by satellite. Laboratory samples cross-check the instruments. This hybrid approach catches short-lived pollution events and seasonal patterns that monthly grab samples miss entirely.
Methane detection and industrial compliance
The shift from annual estimates to continuous observation is reshaping emissions management. GHGSat satellites locate methane from individual facilities. The EU regulation mandates source quantification and independent verification. GHGSat’s DATA.AIR aerial solution received EPA approval in February 2025 as an advanced detection technology for regulatory compliance. The cycle is becoming closed: detect, quantify, repair, verify, repeat.
Supply chain and asset-level environmental monitoring
This is where my team works every day. Pharma cold chains, aerospace cargo, perishable goods, sensitive electronics: all need continuous proof that environmental conditions stayed within spec during transit and storage. This combines environmental monitoring with asset tracking to protect high-value shipments. A temperature excursion in an airfreight container can destroy $200,000 in biologics. A humidity spike in an MRO warehouse can compromise avionics components worth six figures.
The technology stack differs from atmospheric monitoring, but the seven-layer architecture is identical. You need a sensor that survives the operating environment (vibration, altitude, temperature swings), connectivity that works across borders, a platform that logs data with timestamps and geolocation, and a decision protocol for excursions. Skip any layer and the compliance record has a hole.
Biodiversity and ecosystem monitoring
Environmental DNA (eDNA) is extending continuous tracking into biology. A study on the River Conwy sampled 14 sites across 19 timepoints, detecting seasonal fish migrations and tracing DNA transport up to 5,000 meters downstream. The method detects species that visual surveys miss. But it also illustrates why uncertainty matters: a DNA signal downstream does not automatically equal a local population count without hydrological context and transport models.
Three Myths That Inflate Budgets and Erode Trust
After years in this field, I keep hearing the same assumptions from teams early in their environmental tracking deployments.
More sensors means better data
Not if the sensors aren’t calibrated against a reference. EPA’s collocation guidance exists precisely because low-cost sensors can drift in accuracy. Peer-reviewed assessments of air sensors confirm they supplement reference networks but cannot replace them without documented validation. Twenty uncalibrated sensors give you twenty unreliable readings, not a picture of reality.
The better approach: anchor your network with a few reference-grade instruments and use lower-cost nodes to map spatial patterns and hotspots. Calibrate the fleet against the anchor. Document everything.
Satellites replace ground instruments
NOAA says satellite observations fill gaps where ground sensors are sparse. Fill gaps. Not replace. A satellite estimates column-integrated or modeled near-surface concentrations from orbit. It does not measure what you breathe at street level. It does not verify conditions inside a shipping container or a warehouse. Ground instruments, mobile sensors, and satellite data are complementary layers. Deploying only one creates blind spots at every scale the others cover.
Continuous and real-time mean the same thing
They don’t. Continuous describes sampling frequency: the sensor measures without programmed gaps. Real-time describes delivery latency: data reaches the user within seconds or minutes. A USGS super-gage measures continuously but transmits hourly. A sensor on an airfreight pallet may log every 60 seconds but only upload when the aircraft lands and reconnects to a cellular network.
When specifying a system, define both: how often does the sensor sample, and what is the maximum acceptable delay before data reaches the person who acts on it?
Building an Architecture That Survives Contact with Reality
Four principles from deployments that delivered measurable ROI.
Start with the decision, not the sensor. Define what action follows a deviation before selecting hardware. If a temperature breach in transit triggers a shipment rejection, the sensor, connectivity, alert threshold, and escalation path must all exist before the cargo moves. If an emissions reading triggers a compliance report, the measurement must meet the regulatory standard. Work backwards from the response.
Insist on documented QA/QC. EPA requires a Quality Assurance Project Plan (QAPP) for data used in its programs: data-quality objectives, acceptance criteria, implementation checks, and a final usability review. The principle applies everywhere. If your environmental tracking system doesn’t have an equivalent document, your data has no documented basis for trust.
Choose open standards. The OGC SensorThings API provides an open, geospatially enabled way to connect heterogeneous IoT devices and applications. Open export, standard time formats, documented metadata schemas: these protect you from vendor lock-in and let you compare data across sites, instruments, and years. Ask every vendor one question: can I export my raw data in a standard format, with full metadata, at any time?
Budget for maintenance, not just installation. Sensors foul. Batteries drain. Calibration drifts. Connectivity fails. Firmware needs updates. A deployment that looks perfect on day one and fails on day 90 is not a monitoring system. It is a proof of concept that expired. Plan at least 20% of hardware cost annually for field maintenance, recalibration, and replacement.
Three Measurable Outcomes When Tracking Works
When continuous environmental tracking is built correctly, the results are consistent across sectors:
- Compliance gaps close before they become violations. Continuous data catches excursions in near-real-time. Operators intervene, document the response, and demonstrate corrective action. Periodic monitoring, by contrast, only reveals a violation after the damage is done.
- Asset losses from environmental exposure drop. In cold chain and pharma logistics, continuous temperature and humidity records provide the evidence to reject compromised shipments before they reach patients or production lines. In aerospace MRO, humidity monitoring prevents corrosion on components worth six figures.
- Operational decisions get faster and more defensible. A wildfire smoke alert based on fused satellite and ground data lets a city issue health advisories within hours. A methane detection triggers a repair crew the same day. A nutrient spike in a watershed triggers an upstream investigation before downstream damage accumulates.
The common thread: continuous tracking converts reactive discovery into proactive response. The ROI comes not from the data itself, but from the decisions it enables and the losses it prevents.
Frequently Asked Questions
What is continuous environmental tracking?
It is the repeated or uninterrupted measurement of environmental conditions (air quality, temperature, humidity, water chemistry, emissions, noise, biodiversity indicators) connected to data transmission, quality control, analysis, and a decision or response. “Continuous” describes the sampling and delivery pattern, not a single device or software product.
Is continuous monitoring the same as real-time monitoring?
No. Continuous refers to sampling frequency: the sensor measures without programmed gaps. Real-time refers to delivery latency: data reaches the user within seconds or minutes. A system can be continuous but not real-time (for example, logging every minute, uploading every hour). When specifying a system, define both sampling interval and maximum acceptable data delivery delay.
Can low-cost sensors replace regulatory-grade instruments?
Not without documented validation. Low-cost sensors add spatial density and hotspot detection, but they require calibration against reference instruments. EPA recommends collocation testing to evaluate accuracy. For formal compliance determinations, reference-grade instruments remain necessary in most regulatory frameworks.
How big is the environmental monitoring market?
Analyst estimates vary by scope. The Business Research Company reported $18.68 billion in 2025, projecting $24.36 billion by 2030 at 5.4% CAGR. Grand View Research estimated $14.4 billion in 2024 with a 5.7% CAGR. For deeper analysis of these environmental monitoring market dynamics, the directional signal is consistent: steady mid-single-digit growth driven by regulation, health data, climate accountability, and sustainability reporting.
What is a CEMS and when is it required?
A Continuous Emission Monitoring System (CEMS) is the complete equipment and calculation chain used to determine pollutant concentration or emissions rate at an industrial source. EPA rules may require CEMS for continuous compliance or exceedance determinations. The system must follow reference methods, performance specifications, and documented QA procedures.
How do you validate environmental tracking data?
Start with a documented quality plan (equivalent to an EPA QAPP) that defines data-quality objectives, acceptance criteria, calibration schedules, implementation checks, and a final usability review. Add reference-instrument collocation, laboratory verification where applicable, complete metadata, and missing-data flags. A trustworthy system reports its uncertainty. A suspect one hides it.
If your environmental tracking architecture has gaps, or you’re evaluating environmental tracking devices for supply chain, cold chain, or industrial operations, we build end-to-end solutions from sensor selection through platform integration. Talk to our team, or reach out directly at info@datanetiot.com.








 +1 508 292 2210

4 Responses