

Most industrial environmental monitoring programs can tell you what a sensor read at 2:14 PM on a Tuesday. Fewer can prove that reading to a regulator, explain it to a community, or connect it to the work order that actually fixed the problem.
That gap between measurement and evidence is where real money disappears. The global environmental monitoring market reached $14.4 billion in 2024 and is projected to cross $20.1 billion by 2030 at a 5.7% CAGR. Spending is clearly not the bottleneck. Whether the data survives scrutiny is.
After 15+ years integrating IoT systems across aviation, maritime, logistics, and heavy industry, here’s the pattern I keep seeing: the sensor is never the hard part. The hard part is building a system where every reading has a clear origin, a calibration record, a quality flag, and a defined action that follows it. That line separates industrial environmental monitoring that works from dashboards nobody trusts.
What Industrial Environmental Monitoring Actually Covers
The phrase gets used to describe everything from a $50 temperature logger to a $2 million continuous emission monitoring system. That ambiguity causes real problems at procurement time.
Here’s a working definition: industrial environmental monitoring is the systematic measurement, recording, and interpretation of environmental conditions and industrial releases. That includes stack emissions, fugitive gases, ambient air, fenceline air quality, wastewater, stormwater, soil, noise, temperature, humidity, and equipment conditions.
The EPA’s own CEMS definition is useful because it reveals the actual scope. A CEMS isn’t just an analyzer: it includes the sampling system, the conversion logic, and the software that produces results in the units of the applicable limit. That’s not a product category. It’s an evidence chain.
A defensible monitoring system has six layers:
- Source and medium. Stack gas, fugitive leak, ambient air, wastewater, stormwater, soil, noise, temperature, humidity, vibration.
- Measurement device. Analyzer, optical instrument, electrochemical cell, particulate sensor, water probe, flow meter, sampling train, drone, satellite.
- Sample handling and reference method. Extraction, dilution, filtration, calibration gas, laboratory method, co-location with a reference instrument.
- Control and data acquisition. Local controller, timestamps, status codes, calibration events, quality flags.
- Connectivity and analytics. Wired networks, cellular, satellite, LoRaWAN, edge processing, cloud storage, anomaly detection.
- Evidence and action. Permit report, maintenance work order, corrective action, community disclosure, verified reduction.
Most purchasing decisions focus on layers 1 and 2: pick a sensor, install it. Programs that actually hold up under audit invest equally in layers 3 through 6.
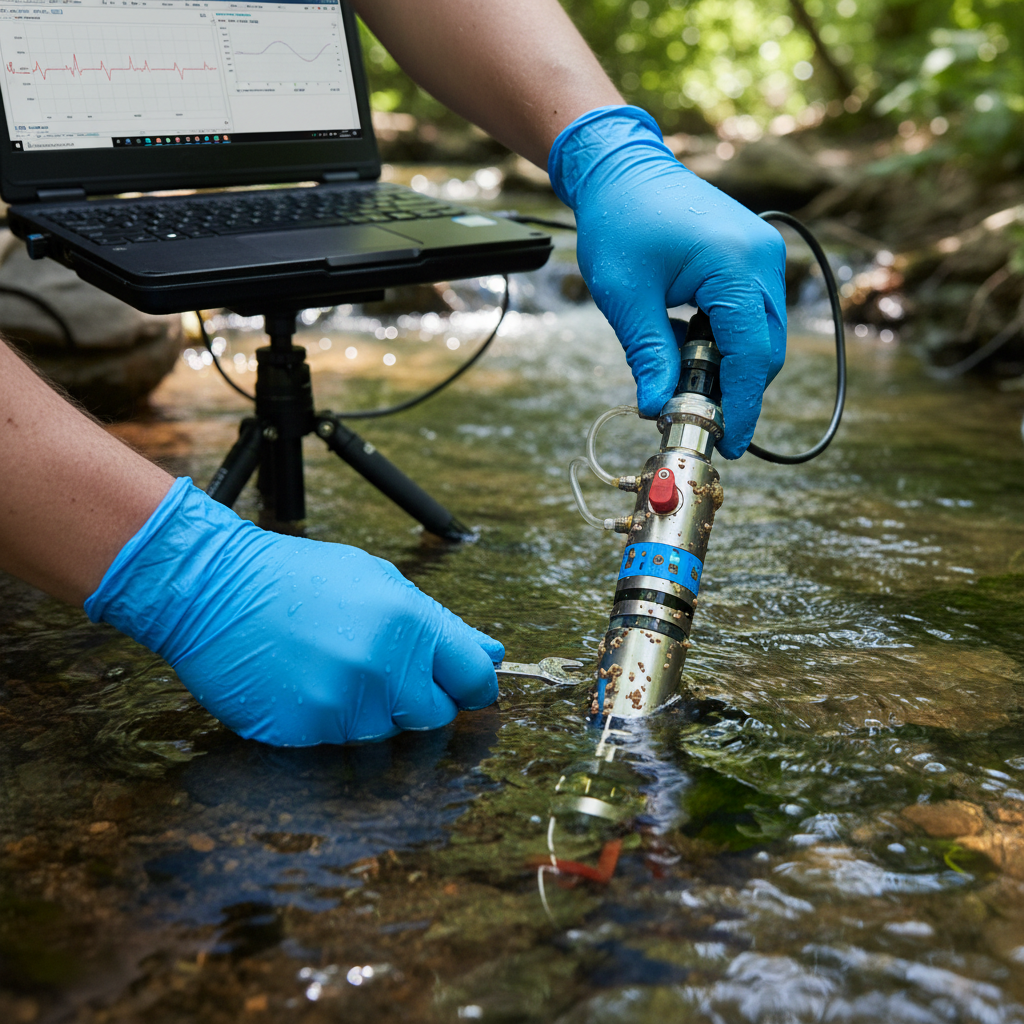
The Regulatory Pressure Behind Every Sensor
Understanding why you’re monitoring matters as much as understanding how. Regulations don’t just require data. They specify how data must be collected, validated, stored, and reported.
In the US, two frameworks dominate:
Air emissions (EPA/CEMS). EPA may require continuous emission monitoring for compliance or exceedance determinations under specific rules. Each CEMS must meet performance specifications and reference methods, with quarterly audits required under Appendix F (no closer than two months apart). The 2024 oil-and-gas methane rule added requirements for VOC and methane control, and a 2025 interim final rule extended several compliance deadlines. The goalposts move. Your monitoring system shouldn’t break when they do.
Water discharges (NPDES). The National Pollutant Discharge Elimination System establishes discharge limits and conditions across more than 50 industrial and commercial categories. Discharge Monitoring Reports must now be submitted electronically in most cases. Online sensors help with process control, but permitted parameters often require validated laboratory methods with proper chain of custody.
Internationally, the EU’s Industrial Emissions Portal Regulation is reshaping transparency expectations. Adopted in April 2024, the framework covers approximately 60,000 large industrial facilities and will publish emissions, resource use, and contextual information for public access. First data under the new law (covering 2027 operations) is scheduled for publication in 2028.
The direction is clear: environmental data is becoming public infrastructure. If your monitoring program can’t produce data that withstands comparison by regulators, investors, and communities, you have a liability, not a system.
Five Monitoring Categories and What Each One Proves
Not every monitoring approach answers the same question. Choosing the wrong one for your regulatory or operational context creates false confidence, which is more dangerous than no monitoring at all.
| Category | Best question answered | Evidence strength | Main limitation |
|---|---|---|---|
| CEMS (stack/source) | What did this specific source emit, continuously? | Strongest for defined compliance | Doesn’t capture fugitive or off-site impacts |
| Ambient and fenceline | What’s present in the air around the facility? | Spatial context and early warning | Attribution can be ambiguous |
| Industrial water | Is the discharge or process water within limits? | Continuous trend + lab confirmation | Matrix interference, fouling, proxy limitations |
| Remote sensing (satellite, aircraft) | Which assets or regions need attention first? | Portfolio-scale screening | Detection limits, revisit timing, weather |
| IoT condition monitoring | Are conditions protecting assets and workers? | Continuous, dense, operational | Not regulatory-grade without validation |
CEMS: The compliance backbone
When the question is “What left this stack, at what rate, and did it comply?”, CEMS is the answer. The CEMS market alone is projected at $4.5 billion by 2035, with compliance monitoring representing 47% of application demand and power generation accounting for nearly 32% of end-use.
A CEMS is an engineered system, not a sensor. It includes analyzers, sample conditioning, flow and temperature measurements, and the software that converts raw signals into reportable units. Siemens, Emerson, Thermo Fisher, ABB, and HORIBA all position their CEMS as complete measurement solutions for that reason.
Ambient and fenceline: The perimeter evidence layer
EPA’s enforcement alert on benzene fenceline monitoring at petroleum refineries illustrates the point well: perimeter measurements verify that hazardous-air-pollutant limits aren’t being exceeded at the facility boundary.
But a perimeter concentration doesn’t automatically identify which process, unit, or upwind source caused it. The strongest refinery programs combine source CEMS, fenceline sensors, meteorology, and leak-detection-and-repair records. One layer alone always leaves gaps.
Industrial water
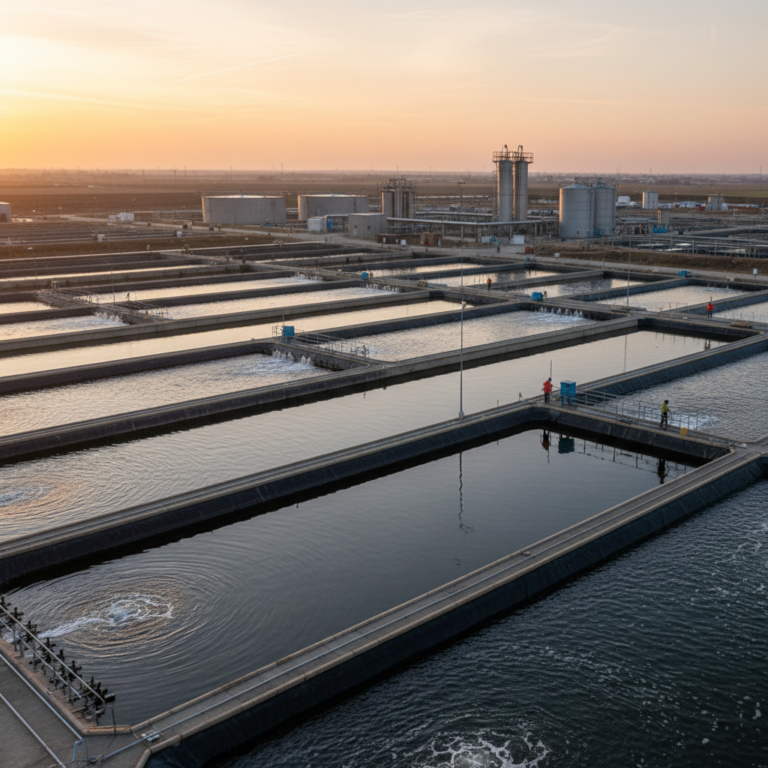
Water programs typically combine flow, pH, conductivity, dissolved oxygen, turbidity, and organic-load proxies like COD or TOC. Online probes deliver speed for process control. But complex matrices cause fouling, interference, and drift. For PFAS, metals, and many organic compounds, validated laboratory methods remain the legal standard.
The design principle: continuous where action needs to be fast, periodic where specificity matters.
Remote sensing
Satellite methane monitoring has moved from research curiosity to operational tool. GHGSat’s data showed that facilities emitted methane only about 16% of the time they were observed. That finding alone explains why one-time inspections miss episodic emissions.
A 2025 systematic review of 77 studies on satellite methane monitoring confirmed that source-rate quantification remains challenging. Satellites screen and prioritize. Ground, mobile, and aircraft methods confirm, quantify, and verify repairs.
IoT condition monitoring
Not all environmental monitoring is about regulatory compliance. Temperature, humidity, vibration, shock, and location data protect products, equipment, and workers across industrial supply chains. Cold-chain integrity, warehouse climate control, ground support equipment conditions, and transport environment monitoring all fall under this umbrella.
Dense, low-power IoT sensor networks create the most operational value in this layer. They won’t replace a CEMS or satisfy an NPDES permit. But they will tell you if a container sat in 45°C heat for 18 hours, if a critical spare part was stored outside humidity spec, or if a reusable asset disappeared after delivery. Cargo monitoring at sea exemplifies how environmental tracking protects high-value assets in challenging conditions. That’s environmental data driving day-to-day decisions.
Why Sensor Specs Don’t Survive Field Conditions
Low-cost air sensors have democratized environmental monitoring. They’ve also created a dangerous confidence gap.
EPA’s assessment is blunt: low-cost sensors can produce questionable data, systematic bias, humidity-related errors, drift, and missing data from malfunctions, power failures, or weather interference. The agency’s sensor guidance is voluntary, non-regulatory, and explicitly not EPA certification or endorsement. Federal Reference Methods and Federal Equivalent Methods remain the gold standard.
None of this makes low-cost sensors useless. It means they serve a different role. The architecture that works is hybrid:
- A small number of reference-grade instruments anchoring accuracy.
- A larger network of calibrated sensors providing spatial density and anomaly detection.
- Mobile instruments for investigation and plume tracking.
- Meteorological data for context.
- Analytics that flag drift, gaps, and confidence intervals, not just readings.
Discovery improves without lowering the evidentiary bar. But only if you’re honest about what each sensor tier can and cannot prove. A sensor rated for ±2% accuracy in a lab and deployed in a humid, dusty, vibration-heavy plant doesn’t give you ±2%. It gives you a number that looks precise. Collocation testing, regular calibration, and published uncertainty estimates are the fix.
From Raw Signal to Defensible Evidence: The Data Layer
This is where most industrial environmental monitoring programs quietly fail. Not at the sensor. At the chain between measurement and action.
A sensor produces a voltage, a resistance change, an optical absorption value. That raw signal passes through calibration curves, temperature compensation, quality checks, timestamp synchronization, and conversion logic before it becomes a number on a dashboard. Every step is a potential failure point, and every failure degrades evidence quality.
Edge processing and connectivity
Edge logic (processing at or near the sensor) serves three functions. It suppresses obvious bad readings before they pollute your dataset. It buffers data during network outages so nothing is lost. And it triggers local responses that can’t wait for a cloud round trip.
Connectivity options depend on the environment. Wired industrial networks for permanent installations. Cellular for mobile or remote assets. LoRaWAN for dense, low-power sensor fields. Satellite backhaul for truly remote locations. Each choice affects latency, cost, reliability, and cybersecurity exposure.
Platform integration
Cloud platforms combine sensor streams with production data, weather, GIS, permit calendars, and maintenance systems. This integration is where environmental monitoring becomes operational intelligence: a temperature exceedance triggers a work order, not just an email nobody opens.
But integration creates risk. Environmental data locked inside a proprietary platform with no export path and no audit trail is a liability in a regulatory proceeding. What matters: exportable raw data, immutable audit logs, model versioning, clear data ownership, and defined responsibilities for alerts and reports.
Cybersecurity
CISA has warned that simultaneous loss of GPS across multiple receivers can indicate signal interference. For environmental systems that rely on location, timestamps, or satellite positioning, the implication is serious. Resilient designs retain raw measurements, quality flags, local clocks, and alternate communication paths.
A monitoring system that goes dark during a connectivity event is worse than no system at all. It creates a gap in the evidence record that invites questions.
Three Failures Industrial Monitoring Programs Keep Making
Confusing coverage with completeness
GHGSat’s finding that facilities emitted methane only about 16% of the time they were observed isn’t just a methane statistic. It’s a lesson about episodic events. A satellite that revisits every few days, a sensor that samples every 15 minutes, or an inspection that happens once a quarter will all miss events that fall between observations. More coverage helps. But non-detection is not proof of non-emission. Knowing what your system can’t see is as important as knowing what it can.
Stopping at detection
This is the most common failure and the most expensive. A monitoring system that generates alerts without a defined response workflow is a noise generator. The alert goes to an inbox. The inbox gets ignored. Six months later, an inspection finds the same problem that has been alarming continuously.
Every monitoring program should separate five stages: detection, attribution, quantification, response, and verified outcome. A system that stops at detection delivers half a solution at full cost.
Treating all data as equal
A reference-grade CEMS data point, a calibrated IoT sensor reading, a low-cost ambient sensor estimate, and a satellite-derived emission rate are not interchangeable. Each has a different uncertainty, a different legal standing, and a different use case. Programs that blend these without quality flags and uncertainty estimates produce dashboards that look comprehensive but can’t defend a single number under challenge.
Where Industrial Environmental Monitoring Is Heading
Three trends are converging in 2026 that will reshape how facilities build and operate these systems.
Detection-to-action methane systems. The next phase isn’t more satellite images. It’s integrating detection, work orders, repair, and verification into a single workflow. The IEA reports that methane detection has improved markedly through better use of satellite arrays and new devices. The differentiator going forward is response latency: how quickly a plume becomes a verified repair, not how quickly it becomes a colorful map.
Public data as default. The EU’s IEPR covering 60,000 facilities, US electronic discharge reporting, and investor ESG demands all point the same way. Environmental data won’t just be reviewed by regulators. It will be compared by communities, customers, and shareholders. Unexplained gaps and implausible trends become reputational events.
Persistent contaminants expanding the analytical burden. EPA’s 2024 PFAS progress report describes PFAS as an urgent public-health and environmental threat, with expanded investment in analytical methods and risk assessment. This pushes monitoring programs beyond traditional pH, flow, and BOD into new territory that requires sampling plans distinguishing screening from confirmation and online proxies from compound-specific laboratory methods.
For decision-makers, the recommendation is straightforward: invest first in data lineage, interoperability, and response workflows. New sensors and AI add value only when the organization can validate them and act on their output.
If your environmental monitoring stops at the sensor, or if your IoT data sits in a silo disconnected from maintenance and compliance workflows, that’s the gap worth closing. We build environmental tracking solutions designed to integrate into operational workflows rather than collect isolated data points. If that conversation makes sense for your operation, talk to our team or reach us at info@datanetiot.com.

Frequently Asked Questions
What is industrial environmental monitoring?
It’s the systematic measurement and interpretation of environmental conditions and industrial releases: stack emissions, ambient air, wastewater, soil, noise, temperature, and equipment conditions. A complete system includes sensors, sample handling, data acquisition, connectivity, quality assurance, and defined response actions. The goal is producing evidence that’s accurate, traceable, and actionable.
What’s the difference between CEMS, ambient monitoring, and fenceline monitoring?
CEMS measures a defined source (usually a stack) continuously for compliance. Ambient monitoring measures general conditions in the surrounding environment. Fenceline monitoring places sensors around a facility perimeter to detect releases at the boundary. They answer different questions. A compliant stack reading doesn’t prove there are no fugitive releases, and a perimeter reading doesn’t identify which process caused it.
Are low-cost air sensors accurate enough for regulatory compliance?
Generally, no. EPA warns that low-cost sensors can show systematic bias, drift, humidity effects, and missing data. Federal Reference and Equivalent Methods remain the gold standard. Low-cost sensors are valuable for spatial screening and early warning but should be co-located with reference instruments and calibrated regularly before supporting high-stakes decisions.
Can satellites replace ground sensors for methane monitoring?
No. Satellites provide portfolio-scale screening and detect facility-level plumes, but detection limits, revisit frequency, weather, and attribution challenges remain. A 2025 review of 77 studies confirmed that source-rate quantification is still difficult. Use satellites to screen and prioritize, then ground, mobile, or aircraft methods to confirm, quantify, and verify repairs.
How often should an industrial monitoring system take measurements?
It depends on the permit and method. EPA examples include four equally spaced CEMS data points per hour and readings every 10 seconds for certain methods. Quarterly audits under Appendix F must be spaced at least two months apart. Measurement frequency, calibration intervals, data completeness requirements, and reporting schedules must each be specified separately based on regulatory requirements.
Is industrial environmental data becoming public?
Increasingly, yes. The EU’s IEPR makes emissions and resource data from roughly 60,000 facilities publicly accessible. In the US, programs like TRI, NPDES electronic reporting, and EPA enforcement databases provide varying levels of public access. Organizations should define disclosure, retention, and correction policies before deploying monitoring systems.






 +1 508 292 2210

3 Responses