

NOAA archives over 229 terabytes of environmental data every month from more than 130 observing platforms. Copernicus served over 200 petabytes to users in 2024. The planet is not short on environmental measurements. What it lacks is measurements that hold up when a regulator, a court, or your own internal review asks one question: where did this number come from?
Environmental data collection is the planned measurement of air quality, water chemistry, soil conditions, climate variables, greenhouse gas emissions, biodiversity, and human exposure, combined with the quality chain (metadata, calibration records, QA/QC, documented processing) that makes each reading traceable. Without that chain, you have numbers. You do not have evidence.
After years deploying IoT sensor networks for industrial and environmental clients, I keep seeing the same failure mode: organizations invest in hardware, collect mountains of readings, then discover their data cannot answer the question that started the project. The gap is almost never the sensor. It is the study design upstream and the quality process downstream.
This guide covers the methods that work in 2026, the quality practices that separate defensible evidence from noise, and the technology shift reshaping how organizations collect environmental data at scale.
What Environmental Data Collection Actually Covers
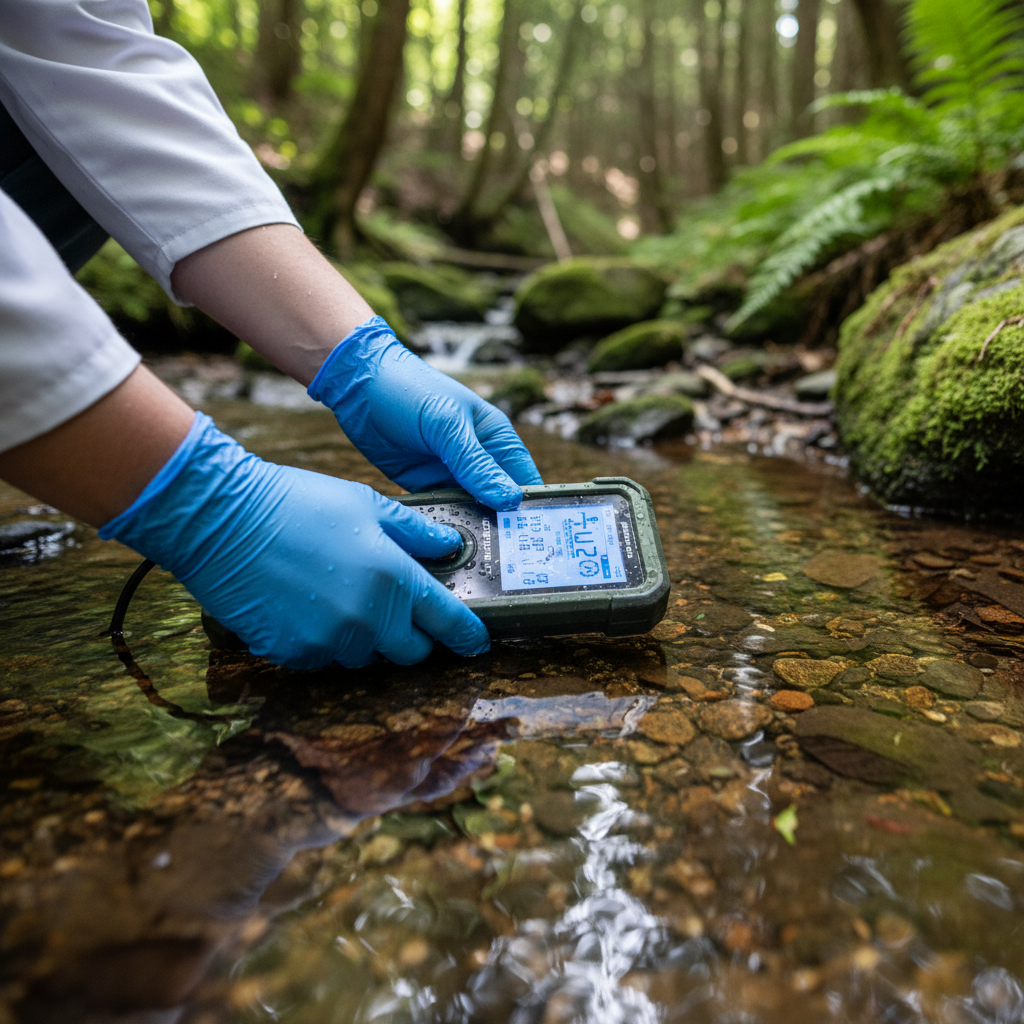
The term spans everything from a water sample taken by hand at a river crossing to a satellite measuring methane over an oil basin. The common thread is intention. Environmental data collection is not incidental observation. It is a structured activity designed to answer a specific question or meet a defined monitoring requirement.
The scope includes:
- Air: pollutant concentrations (PM2.5, ozone, NO2, SO2), greenhouse gases (CO2, methane), volatile organic compounds
- Water: chemistry, temperature, turbidity, dissolved oxygen, contaminants (PFAS, heavy metals, nutrients)
- Soil: composition, contamination, moisture, carbon content
- Climate: temperature, precipitation, humidity, wind, solar radiation
- Biodiversity: species presence, population estimates, habitat condition, invasive species detection
- Emissions: stack monitoring, fugitive leaks, fleet-level GHG reporting
- Human exposure: community air quality, noise, drinking water contaminants
The market reflects this breadth. Grand View Research estimated the environmental monitoring market at $14.4 billion in 2024, projecting $20.1 billion by 2030 at a 5.7% CAGR. A MarketsandMarkets estimate puts 2025 at $16.1 billion and 2030 at $21.1 billion. The numbers differ because scope definitions differ: instruments versus services versus software versus data products. But the direction is consistent. Regulation, ESG mandates, and lower-cost sensing technology are all pushing demand in the same direction.
Five Collection Methods and When Each One Wins
No single method covers every need. The choice depends on detection limits, spatial scale, frequency, legal requirements, and budget.
| Method | What it measures | Strength | Key limitation | Best for |
|---|---|---|---|---|
| Reference-grade instruments | Precise local concentration or condition | Traceable, continuous, legally defensible | Expensive, sparse spatial coverage | Regulatory compliance, calibration baselines |
| Low-cost and IoT sensors | Dense spatial variation, short-term events | More locations, faster deployment, lower cost per point | Bias, drift, weather sensitivity | Hotspot discovery, supplemental networks, continuous monitoring |
| Satellite and airborne remote sensing | Spectral, thermal, radar, or atmospheric signals | Wide area, repeatable, historical record | Indirect inference, cloud interference, resolution limits | Land cover change, methane mapping, disaster response |
| Biological methods (eDNA, acoustic, camera) | Species presence, activity, identity | Non-invasive, rapid, cost-effective for biodiversity | Sampling design complexity, taxonomic reference gaps | Invasive species, restoration monitoring, biosecurity |
| Citizen and community observation | Local conditions, photographs, human observations | Extends geographic reach, builds local capacity | Uneven effort, training needs, quality control | Environmental justice, early warning, education |
A few things worth unpacking here.
Reference instruments remain the legal gold standard for compliance. When EPA requires PFAS monitoring, the measurement needs chain of custody, approved laboratory methods, and defined detection limits. Public water systems must complete initial PFAS monitoring by 2027, followed by ongoing compliance monitoring. No IoT sensor or satellite will substitute for that laboratory process.
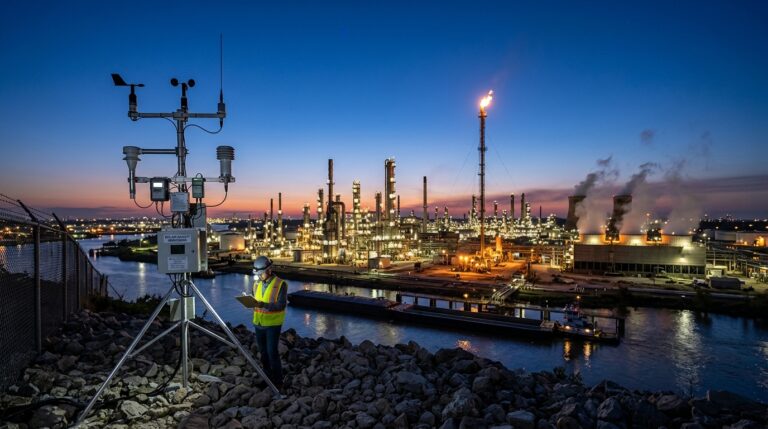
IoT and low-cost sensors fill a different role. They provide density and continuity where reference networks leave gaps. EPA’s enhanced air-sensor guidebook supports planning and collecting measurements using air sensors, and the agency explicitly frames them as supplements, not replacements. A 2024 review confirmed that low-cost air sensors show promise but can suffer from bias, drift, and interference. The practical fix is collocation: run your sensor next to a reference monitor, compare outputs, build a correction model, and publish both raw and corrected values.
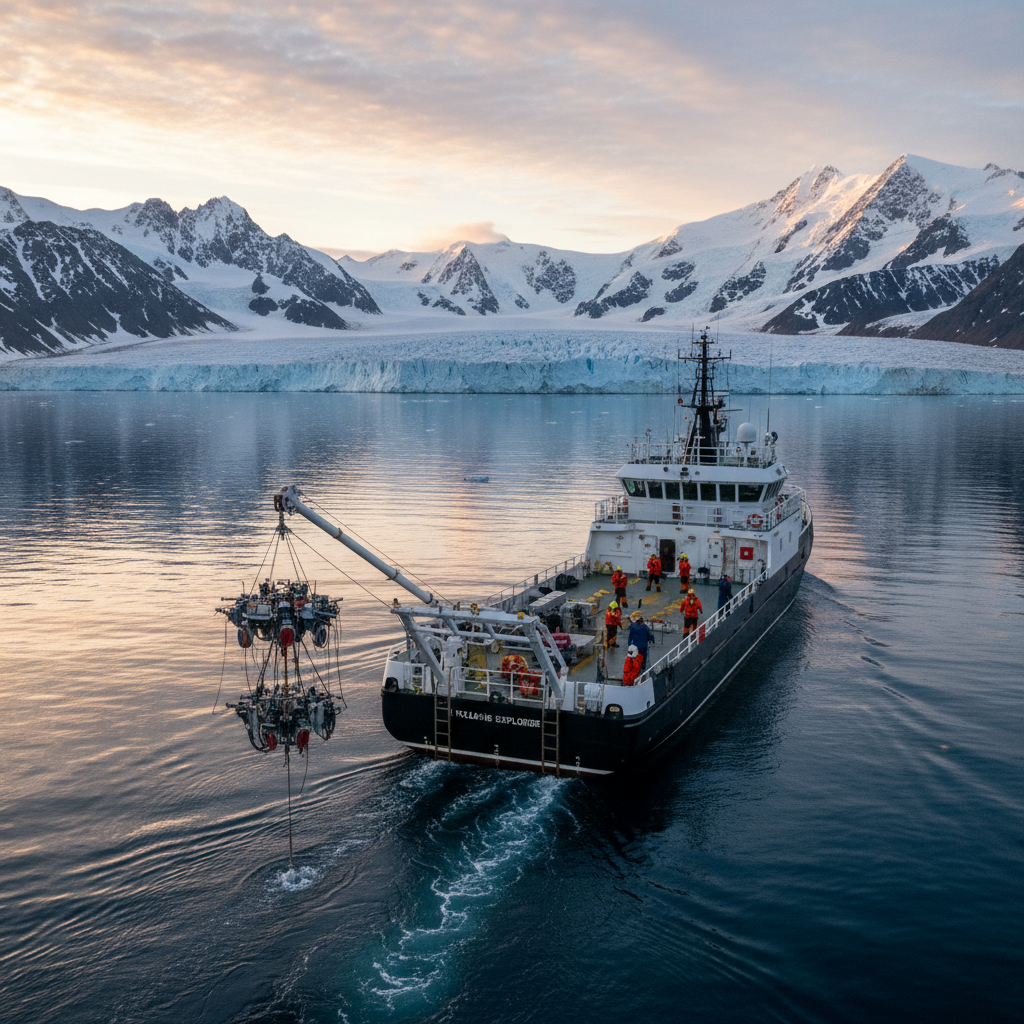
Satellites excel at coverage and repeat observation. Landsat has provided continuous land-surface imagery since 1972. Planet’s constellation captures Earth nearly daily. MethaneSAT reported data over 41 oil and gas basins in 25 countries, covering 50% of global onshore oil and gas production before losing communication with its spacecraft in June 2025. That last point matters. The mission-ending anomaly is a reminder that any serious monitoring program needs redundancy across platforms.
Biological sensing is expanding fast. USGS describes eDNA as transforming how it monitors and restores native species across North America, while CSIRO calls eDNA promising for rapid, cost-effective detection from biosecurity to large-scale monitoring. Standards for sampling protocols and reference libraries are still catching up to the technology.
Community observation addresses environmental justice gaps that sparse regulatory networks miss. EPA invested $1 million in 2024 through UAlbany-led community air-monitoring projects. But success requires shared governance: residents need access to raw data, uncertainty estimates, and a clear pathway from measurement to action, not just a sensor and a dashboard.
The strongest programs combine methods. NSF’s NEON network is a good model: 81 field sites using automated instruments, observational sampling, and airborne remote sensing to produce over 180 open data products. Satellite data finds where change is happening. Ground instruments validate the signal. Laboratory analysis confirms the chemistry. Each method covers a weakness the others cannot.
The Part That Kills Programs: Quality Assurance
I have watched well-funded monitoring programs produce data that could not survive basic scrutiny. Not because the sensors failed, but because nobody documented calibration. Nobody ran blanks. Nobody defined what “acceptable” meant before collecting the first reading.
Quality assurance is designed before collection begins, not retrofitted after. USGS defines a Quality Assurance Plan as the criteria and processes used to ensure and verify that data meet specific data-quality objectives. EPA provides detailed QAPP guidance for environmental data projects. And in 2026, EPA released a citizen-science quality assurance handbook extending structured QA practices to community programs as well.
A defensible QA plan answers these questions before the first sample is taken:
- What decision will this data support?
- What is the target population and sampling frame?
- What detection limits and uncertainty are acceptable?
- What instruments and methods will be used, and how are they calibrated?
- How often are blanks, duplicates, and reference checks performed?
- What flags trigger corrective action?
- Who is responsible for each step?
For sensor networks, EPA’s Air Sensor Toolbox frames collocation as comparing a sensor to a reference monitor to understand measurement accuracy. Skip this step and you are collecting numbers with unknown error. Do it properly and you have a correction model that turns a modest sensor into a legitimate supplemental data source.
The most common QA failures I encounter are not technical. They are organizational. Nobody assigned ownership of the calibration schedule. The field team relocated a sampling point without updating the metadata. A sensor was swapped but the serial number never changed in the system. These small oversights compound. By the time someone needs the data for a compliance report, the provenance gaps make the entire dataset suspect.
How IoT Sensors Changed the Economics
This is the shift that traditional environmental data collection literature tends to underplay.
A decade ago, continuous environmental monitoring meant reference-grade stations costing tens of thousands of dollars per site, plus ongoing maintenance and staffing. That model produced excellent data at very few locations. If the pollution event, the leak, or the habitat change happened between stations, you missed it.
Low-cost IoT sensors did not replace reference instruments. They filled the space between them. A network of 50 cellular-connected environmental sensors can now cover a geographic area that would require 3 to 5 reference stations, at a fraction of the capital cost, with readings every few minutes instead of hourly averages.
The trade-off is real. IoT sensors drift. They respond to temperature and humidity. Their detection limits are higher. But when paired with a handful of reference points for calibration and correction, the combination delivers spatial resolution and temporal continuity that neither approach achieves alone.
What makes this practical in 2026:
Battery technology has matured. Modern LPWAN and cellular devices run three to five years on internal batteries, eliminating the need for wiring or solar infrastructure at remote sites. That single improvement took IoT environmental monitoring from “possible in theory” to “deployable in a week.” For mobile or fleet-based environmental applications, industrial GPS tracking devices extend this capability to asset-level location and condition monitoring.
Cloud platforms have caught up. Google Earth Engine combines a multi-petabyte catalog of satellite imagery and geospatial datasets with cloud-based analysis. Microsoft’s Planetary Computer offers petabytes of analysis-ready environmental data through APIs. Combining your own sensor readings with satellite, weather, and public datasets no longer requires a custom data warehouse.
Interoperability standards exist. EPA identifies OGC standards and Geographic Markup Language as preferred geospatial exchange mechanisms. Sensor networks that output standards-compliant data can integrate into regulatory workflows without manual reformatting. Those that do not create expensive data silos.
The cost equation shifts further when you consider what is not collected. Every day a monitoring gap persists, you accumulate risk: regulatory exposure, missed emission events, undocumented environmental change. IoT sensors do not eliminate that risk. They compress the time and cost to close the most dangerous gaps.
Open Data Sources Worth Checking First
Before deploying a single sensor, check what already exists. Public environmental data archives are vast, often high quality, and free. Collecting data that is already available at better quality from a public source is one of the most expensive mistakes a monitoring program can make.
| Source | Coverage | Scale |
|---|---|---|
| NOAA NCEI | Climate, ocean, atmospheric, geophysical | 229+ TB/month, 130+ platforms |
| Copernicus Data Space | Sentinel satellite products, Earth observation | 78+ PB online, 100M+ products |
| NSF NEON | Ecological observations across US biomes | 81 sites, 180+ open products, 600K+ samples |
| GBIF | Biodiversity occurrence records | 3B records, 100K datasets, 2,400 publishers |
| US Water Quality Portal | Discrete water-quality measurements | 400+ contributing agencies |
| Google Earth Engine | Multi-petabyte satellite and geospatial catalog | Cloud-based analysis at scale |
| Microsoft Planetary Computer | Analysis-ready environmental monitoring data | Petabytes, API access |
These datasets are not plug-and-play. You need to inspect sampling design, parameter definitions, detection limits, temporal coverage, and spatial bias before combining them with your own measurements. A value in milligrams per liter from one agency may use a different analytical method than the same parameter from another. Metadata is not optional reading.
There is also an ethical dimension. GBIF warns that precise locations of sensitive species can expose them to disturbance. When working with open biodiversity or community-sourced data, location generalization and access controls are part of responsible collection, not an afterthought.
Designing a Collection Stack That Holds Together
The word “stack” is deliberate. Environmental data collection is not a single purchase. It is a set of layers that must work together: sensors, communications, storage, quality control, analytics, and reporting. Break one layer and the layers above it produce noise instead of insight.
Here is a practical design sequence.
Start with the decision the data must support. A PFAS compliance obligation requires laboratory-grade chain of custody. A fleet emissions baseline requires continuous measurement. A biodiversity assessment needs species-level detection. The decision determines every downstream choice. Skip it and you end up with a system optimized for the wrong question.
Define the detection threshold. What concentration, change, or event must the system reliably detect? This sets instrument requirements, sampling frequency, and the minimum number of observation points. A threshold that is too ambitious for the budget will produce data gaps. One that is too loose will miss the signal you need.
Select complementary methods. Pair broad coverage (satellite imagery, dense sensor network) with targeted validation (reference instruments, laboratory analysis, field surveys). The combination costs less and performs better than either approach alone. The WRI reported 30 million hectares of global tree-cover loss in 2024 using satellite detection, but conservation agencies still needed local investigation and field verification to act on those findings.
Write the QA plan before deployment. Calibration schedules, collocation protocols, acceptance criteria, corrective actions, and named owners. If this document does not exist before the first reading, the data accumulate quality debt from day one.
Ensure interoperability upfront. Choose data formats, coordinate systems, time-zone conventions, and metadata standards at the beginning. If your sensor data cannot integrate with public datasets, GIS platforms, or regulatory submission systems, you will spend more on reformatting than you spent on collection.
Close the loop. Data that sit in a dashboard without triggering a decision, a report, or an operational action are waste. Build the reporting and escalation workflow as part of the collection design, not something you “figure out later.”
The integration layer is where most programs struggle. Field devices from different vendors speak different protocols. Cloud platforms store data in different schemas. Regulatory systems require specific formats. Organizations that skip integration design end up with data silos that look like monitoring but function like expensive noise.
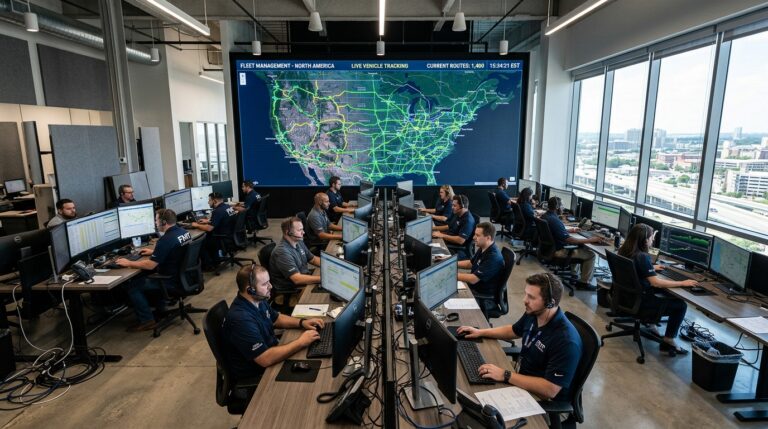
This is the problem we work on at Datanet. Our environmental tracking solutions are designed to fit within end-to-end systems, not sit as standalone gadgets. If your monitoring program needs continuous environmental data that feeds directly into operational or compliance workflows, that is a conversation worth having.
What Is Shifting Right Now
Several trends are compressing the gap between raw measurement and actionable evidence.
Cloud-native environmental data is the default operating model. Copernicus reported up to 2 billion catalog queries per month and 289,000 registered users in 2024. Users increasingly analyze data where it is hosted rather than downloading every file. The differentiator is no longer archive size. It is analysis-ready formats, stable APIs, and reproducible workflows.
Continuous measurement, reporting, and verification (MRV) is replacing periodic self-reported inventories for greenhouse gases. GHGSat combines independent satellite and airborne monitoring for site-level methane data. The EU’s Sentinel-4, described as Europe’s first geostationary air-quality mission designed for hourly monitoring, represents the next generation of atmospheric observation. The direction is clear: annual averages are giving way to near-continuous independent measurement.
AI is becoming a triage layer. Recent reviews describe AI systems using satellite imagery and sensor data to detect biodiversity threats such as illegal logging. AI can rank anomalies, classify images, and prioritize where field teams should go next. It does not remove sensor drift, sampling bias, or the need for human review. The best deployments expose confidence levels and training data. The worst convert opaque classifications into regulatory “facts” without a measurement audit trail.
And the environmental cost of monitoring itself is getting scrutinized. Research has flagged that the energy and water footprints of Earth observation data infrastructure have been overlooked. As collection scales up, the sustainability of the monitoring system becomes a legitimate design variable.
Frequently Asked Questions
What is environmental data collection?
The structured measurement of environmental conditions (air, water, soil, climate, emissions, biodiversity, human exposure) combined with metadata, quality assurance, and documentation that make each value traceable and usable for decisions, compliance, or research. A reading without provenance is a number, not evidence.
Which collection method is best?
There is no universal answer. Reference instruments deliver legally traceable local measurements. IoT sensors add spatial density and continuity. Satellites cover large areas on repeat. eDNA detects species non-invasively. Community observation fills local gaps. The strongest programs combine methods, using broad tools to find where attention is needed and targeted instruments to validate and quantify.
Can low-cost sensors replace regulatory monitors?
Not automatically. EPA frames air sensors as supplements, not replacements, and requires collocation with reference monitors to characterize accuracy. They are valuable for screening, supplemental coverage, and event detection when calibration and uncertainty are documented. Regulatory substitution requires explicit approval and evidence.
Where can I find free environmental data?
Start with NOAA NCEI, Copernicus Data Space, NSF NEON, GBIF (3 billion biodiversity records), the US Water Quality Portal (400+ agencies), Google Earth Engine, and Microsoft Planetary Computer. Always check provenance, temporal coverage, detection limits, and licensing before combining sources with your own measurements.
How do I make environmental data defensible?
Write a Quality Assurance Project Plan before collection begins. Define the decision, acceptable uncertainty, instruments, calibration schedule, blanks, duplicates, acceptance criteria, data flags, and corrective actions. Preserve both raw and corrected values. USGS quality management guidance and EPA QAPP templates are solid starting points.
What is the most common mistake in environmental monitoring programs?
Treating hardware as the solution. The sensor is one component in an evidence chain that includes study design, calibration, metadata, QA/QC, interoperability, and decision workflows. Programs that invest heavily in sensors but skip the quality framework end up with expensive datasets that cannot answer the questions they were built for.






 +1 508 292 2210

2 Responses