

You have sensors deployed. Data is uploading. Dashboards are rendering. And when conditions drift outside acceptable range at 2 AM on a Saturday, nobody responds until Monday. Maybe Tuesday, if it’s buried in a log.
That’s the state of environmental monitoring automation for most organizations in 2026. The market is projected to reach $20.1 billion by 2030, growing at roughly 5.7% annually. Billions going into instruments, software, and cloud platforms. The most common failure mode isn’t a broken sensor. It’s the gap between measurement and response.
I’ve spent over 15 years deploying IoT systems across industrial operations: aviation, maritime, supply chain, cold chain. The pattern is consistent. Organizations that treat monitoring automation as a hardware purchase get data. Organizations that treat it as a workflow design get outcomes.
What Environmental Monitoring Automation Really Means
Strip the jargon and you get a simple definition. Environmental monitoring automation is the use of connected instruments, software, and workflows to measure environmental conditions, validate that data, detect changes, and trigger responses with minimal manual intervention.
The key phrase is “trigger responses.”
Most systems automate the collection. They log temperature every 15 minutes, upload readings to the cloud, generate a chart. That’s automated data collection. Real monitoring automation closes the loop: when a reading crosses a threshold, something happens. An alert fires. A technician gets dispatched. A compliance record is created. A shipment gets flagged. Without that action layer, you have an expensive weather station.
This distinction matters because the term covers more ground than people assume. Search for it and you’ll find cleanroom microbiology systems and pharmaceutical GMP tools. Those are valid use cases. But environmental monitoring automation also covers:
- Continuous emissions monitoring (CEMS) at industrial facilities
- Real-time water quality networks across rivers and groundwater
- Hyperlocal air quality mapping in urban neighborhoods
- Temperature and humidity tracking in supply chains and warehouses
- Methane leak detection via satellites and ground sensors
- Soil and water condition monitoring for agriculture, ecology, and maritime operations
The technology stack is the same across all of them. What changes is the medium being measured, the accuracy class required, the regulatory context, and the action that follows the alert.
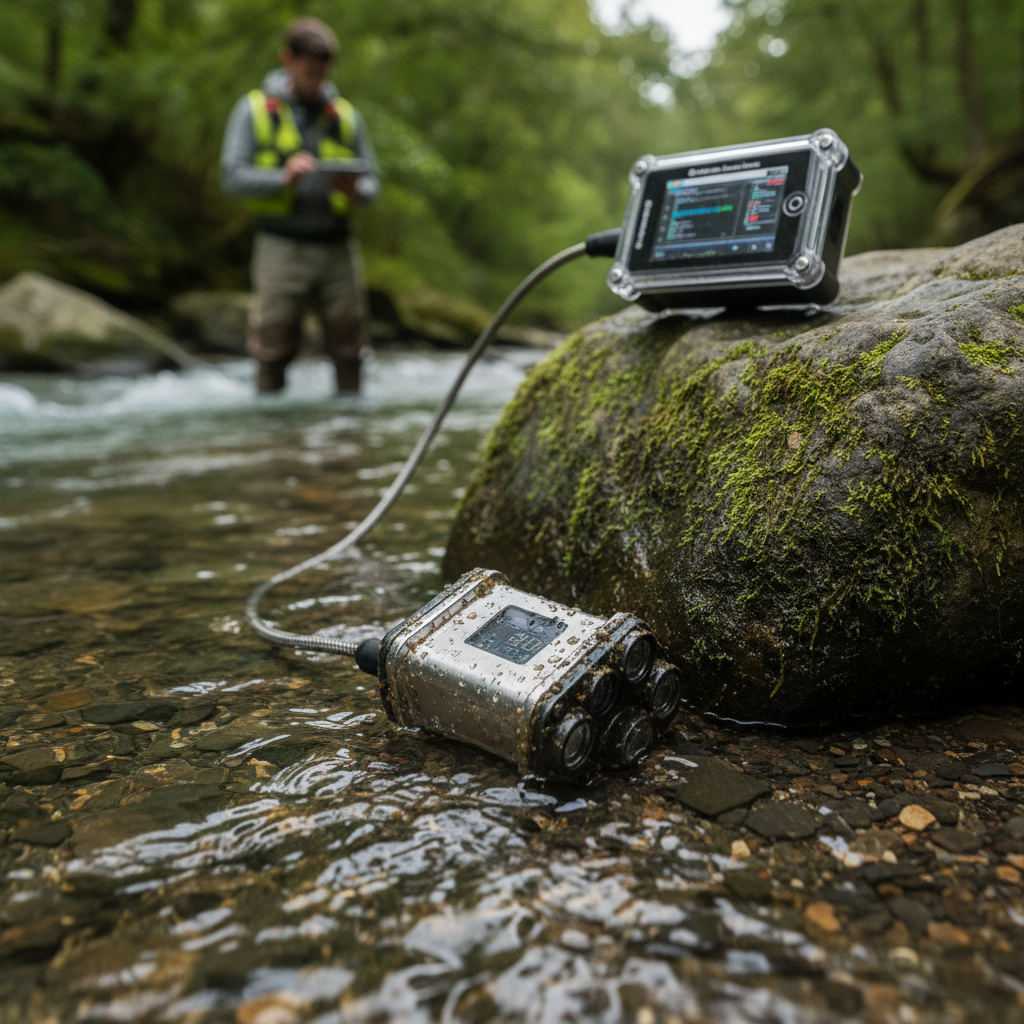
Seven Layers of a Monitoring System (and Where Most Stop)
A complete environmental monitoring automation system has seven layers. Most deployments stop at layer three or four, which explains why so many programs produce dashboards instead of outcomes.
| Layer | Function | Common failure point |
|---|---|---|
| 1. Sensing | Measure the parameter: gas concentration, particle count, temperature, humidity, dissolved oxygen, turbidity, sound | Sensor selected without matching to the required accuracy class |
| 2. Edge processing | Time-stamp, filter, compress, and store data locally | No local buffer, so connectivity loss equals data loss |
| 3. Connectivity | Move data via cellular, LoRa, satellite, or wired links | Single communication path with no fallback |
| 4. Data management | Preserve location, time, unit, method, calibration state, and provenance | Metadata is incomplete, making data unusable for compliance or audit |
| 5. Quality assurance | Detect drift, manage missing data, validate against reference instruments | No collocation, no calibration schedule, no uncertainty labels |
| 6. Analytics | Detect anomalies, forecast trends, classify events, prioritize alerts | AI runs unsupervised on consequential decisions |
| 7. Action and record | Alert an operator, dispatch a team, adjust a process, create a compliance record | Nobody defined who owns the response when the alert fires |
The USGS Water Data for the Nation platform is a useful reference model. It combines automated sensors and manual collection across more than one million monitoring locations, with over 13,500 real-time sites. Automation handles coverage and frequency. Humans handle calibration, laboratory confirmation, and interpretation.
That hybrid approach is deliberate. The organizations I’ve seen succeed with environmental monitoring treat automation as a force multiplier for human judgment, not a replacement for it. And they build the action layer (layer 7) before purchasing the sensing layer (layer 1).
Where Automation Is Delivering Results Right Now
Air quality: block-level data that fixed stations miss
In 2024, Aclima mapped air pollution across Washington, DC at one-second frequency, measuring PM2.5, NO2, ozone, CO, methane, CO2, black carbon, and volatile organic compounds. Data was aggregated into approximately 100-meter hexagons across seven wards.
The result: strong block-level variation that fixed regulatory stations couldn’t see. A New York Avenue segment beside a rail yard showed some of the area’s highest PM2.5 and black carbon concentrations, plausibly linked to road and rail activity. That’s the kind of finding that can redirect truck routes, trigger targeted interventions, or inform school siting decisions.
Mobile monitoring doesn’t replace fixed reference stations. It complements them by revealing spatial gradients. The same principle applies in industrial settings: a handful of fixed sensors might miss the hotspot that a mobile or densely distributed network catches.
Water: automated wells and next-generation robotics
USGS’s Robowell system automates groundwater monitoring by periodically pumping a well, recording water quality properties, and communicating data remotely. Six prototypes operated successfully through all four seasons under varied hydrogeologic conditions and well designs.
What makes Robowell instructive isn’t the hardware. It’s the design principle: automated purge, measurement, and reporting provide frequent context for interpreting laboratory samples taken less often. Automation expands time resolution. Lab work anchors accuracy.
USGS’s Next Generation Water Observing System (NGWOS) is going further, testing robotic platforms with dissolved oxygen, pH, fluorescence, cameras, and autonomous mission algorithms. The technology works. The scaling challenge is maintenance, navigation, and proving that moving sensors produce comparable readings across locations and time.
Methane: from satellites to the Super Emitter Program
For stationary sources, continuous emissions monitoring systems (CEMS) remain the compliance backbone. EPA defines them as the equipment and analyzer-based computation used to determine gas or particulate concentration or emission rate.
For diffuse and fugitive methane, the detection stack has expanded. Carbon Mapper’s Tanager-1 satellite detected 12 Syrian plumes totaling 12,600 kg of methane per hour in its November 2024 data release (still in calibration at the time, so the source labeled results as preliminary). EPA’s oil-and-gas rule now includes a Super Emitter Program incorporating satellite monitoring, aerial surveys, and continuous monitors.
The regulatory framework is catching up to the sensing technology. The open question is whether the action layer (operator notification, repair, verification) can keep pace.
Supply chain and industrial: condition monitoring in motion
Temperature excursions, humidity damage, shock events. These are environmental monitoring problems that happen in transit. A pharmaceutical cold chain, a container of electronics crossing the Pacific, ground support equipment sitting on a tarmac in 45°C heat.
The automation challenge here differs from a fixed monitoring station. Sensors move. Connectivity is intermittent. Power is limited. Much like aquaculture automation and vertical farming automation, the action layer needs to work across organizational boundaries: shipper, carrier, receiver, sometimes the insurer.
IoT-based environmental trackers solve the sensing and connectivity layers well. But the action layer (flagging an excursion in real time, rerouting a shipment, triggering inspection upon arrival) requires integration with operational systems. A dashboard that shows a temperature spike three days after delivery isn’t monitoring automation. It’s forensic archaeology.
Five Ways Monitoring Programs Fail
1. Biased sampling design
The most consequential failure happens before a sensor is powered on. In Flint, Michigan, delayed recognition of high lead levels was partly caused by sampling sites that missed much of the city’s lead-pipe network. Properties on the eastern and western fringes were tested instead of homes near known lead sources.
A dense sensor network with a biased sampling plan just produces biased data faster. Design the sampling plan first. Audit what’s unobserved. Then buy sensors.
2. Screening data treated as regulatory evidence
Low-cost environmental sensors are useful for hotspot identification, local awareness, and short-term exposure alerts. But they have lower accuracy than reference monitors, and that gap shifts with humidity, temperature, aerosol composition, and sensor-to-sensor variability.
EPA recommends side-by-side collocation with reference monitors and mathematical correction before using low-cost sensor data operationally. Skip that step, and you’re making decisions on data that might be off by 30% or more.
3. Calibration neglect
Every sensor drifts. Electrochemical cells degrade. Optical windows foul. Temperature offsets grow. A 2024 review identified environmental interference, inter-sensor variability, and nonstandard correction methods as persistent challenges across low-cost sensor networks.
Automated monitoring without a calibration process (automated or at minimum, rigorously scheduled) isn’t monitoring. It’s generating numbers with declining relationship to reality.
4. No cybersecurity controls
CISA and EPA warn that disruption to a water or wastewater digital ecosystem can affect the community and other critical infrastructure. A compromised sensor can suppress real alarms, generate false ones, or alter treatment decisions.
Minimum controls: asset inventory, signed firmware, unique credentials, encrypted transport, network segmentation, tamper logs, and a tested manual fallback. If your monitoring system can’t operate without the network, your monitoring system has a single point of failure.
5. No documented response workflow
This is the most common failure I encounter. The alert fires. Nobody knows who owns the response. No procedure exists for what happens when humidity exceeds the threshold at 2 AM on a Saturday. No record is created that the event was acknowledged, investigated, and resolved.
The alert itself is worthless without the workflow behind it. Before deploying a single sensor, define: what condition triggers an alert, who receives it, what they do, and how the response is documented. That document is worth more than your sensor spec sheet.
Choosing the Right Architecture
There’s no universal answer. The right monitoring architecture depends on what you’re measuring, what accuracy class you need, what geographic scale you’re covering, what latency you can tolerate, and what action follows the measurement.
| Architecture | Best for | Primary tradeoff |
|---|---|---|
| Fixed reference stations | Long-term regulatory compliance, scientific baselines, legal defensibility | High cost per site, limited spatial density |
| Distributed IoT sensors | Dense facility coverage, supply chain condition tracking, continuous alerting | Calibration management at scale, drift detection, metadata discipline |
| Mobile monitoring | Hyperlocal gradients, hotspot discovery, environmental justice assessments | Snapshot bias, route dependency, limited temporal continuity |
| Satellite observation | Regional screening, facility-scale emissions detection, inaccessible areas | Revisit frequency, cloud interference, calibration uncertainty |
| Autonomous robotics | Dynamic water environments, hazardous areas, flood response | Navigation, power, communications, and proving comparability across locations |
Most effective programs use more than one approach. The discipline is treating each method as a layer in an evidence system, not a standalone answer. Reference instruments anchor accuracy. Distributed IoT expands coverage and frequency. Mobile platforms reveal spatial patterns. AI prioritizes and triages. Humans adjudicate anything consequential.
A well-designed monitoring system delivers three measurable shifts:
- Response time drops from days to minutes because alerts route to specific people with defined procedures
- Compliance records generate automatically, reducing audit preparation from weeks to hours
- False-positive rates decrease through calibrated, collocated sensor networks with drift detection
Where the Market Is Heading in 2026
Three forces are reshaping environmental monitoring automation right now.
New regulations create recurring monitoring demand. EPA’s PFAS rule establishes enforceable limits at 4.0 parts per trillion for PFOA and PFOS, with public water systems required to complete initial monitoring by 2027 and implement treatment by 2029. The methane Super Emitter Program incorporates satellite and aerial detection into enforcement workflows. These aren’t future possibilities. They’re scheduled mandates that are creating procurement activity today.
AI handles triage, not judgment. Machine learning is moving into anomaly detection, image classification, emissions quantification, and ecological monitoring. But methane research still identifies high false-positive rates as a persistent challenge, and a 2025 ecology review confirms that technical experts remain necessary to establish and maintain automated near-real-time workflows. The practical trajectory is machine triage, confidence scoring, and human review for high-stakes decisions. Not full autonomy.
Interoperability becomes a procurement criterion. As organizations layer fixed, mobile, satellite, and IoT approaches, the ability to integrate across vendors and formats becomes more valuable than any single sensor specification. Standards like OGC SensorThings provide a framework, but the real interoperability test is whether your data can flow from sensor to action across systems you didn’t build.
The context is urgent. WMO confirmed 2024 as the warmest year on record at 1.55°C above the pre-industrial baseline. Conditions are changing faster than many monitoring programs were designed to handle. The winning investment isn’t more sensors. It’s the smallest complete system that produces defensible data and triggers a documented response at the scale your operation requires.
Frequently Asked Questions
What is environmental monitoring automation?
It’s the use of connected sensors, software, analytics, and workflows to measure environmental conditions (air, water, temperature, humidity, emissions), validate the data, detect changes, and trigger documented responses with minimal manual intervention. It spans everything from industrial emissions monitoring and water quality networks to supply chain condition tracking.
Does automation eliminate the need for human oversight?
No. Humans design





 +1 508 292 2210

6 Responses