

The spec sheet says the sensor detects PM2.5 down to 1 µg/m³. The field report says your data got rejected because nobody ran a collocated reference comparison in six months.
Environmental monitoring equipment covers every sensor, analyzer, sampler, and data system used to measure conditions in air, water, soil, and emissions. The global market reached roughly $14.4 billion in 2024 and is projected to exceed $20 billion by 2030. That’s a lot of hardware heading into the field. The question worth asking is how much of it produces data anyone can actually defend.
After more than fifteen years deploying IoT monitoring systems across industrial and environmental applications, I keep seeing the same pattern. Organizations buy solid equipment, then watch it underperform because the system around the sensor was never designed. Site selection, calibration cadence, data architecture, quality checks. These aren’t optional accessories. They determine whether you have a monitoring program or an expensive collection of blinking LEDs nobody trusts.
This guide covers what environmental monitoring equipment includes, how the major approaches compare, where programs break between purchase and useful data, and what a defensible monitoring architecture looks like in 2026.
What Environmental Monitoring Equipment Covers
The term spans five domains, each with distinct instruments, protocols, and regulatory drivers.
Air monitoring targets the six criteria pollutants established under the Clean Air Act: PM2.5, PM10, ozone, sulfur dioxide, nitrogen dioxide, carbon monoxide, and lead. It also covers volatile organic compounds and hazardous air pollutants. Equipment ranges from Federal Reference Method analyzers at fixed stations to distributed optical particle counters and electrochemical gas sensors deployed across IoT networks.
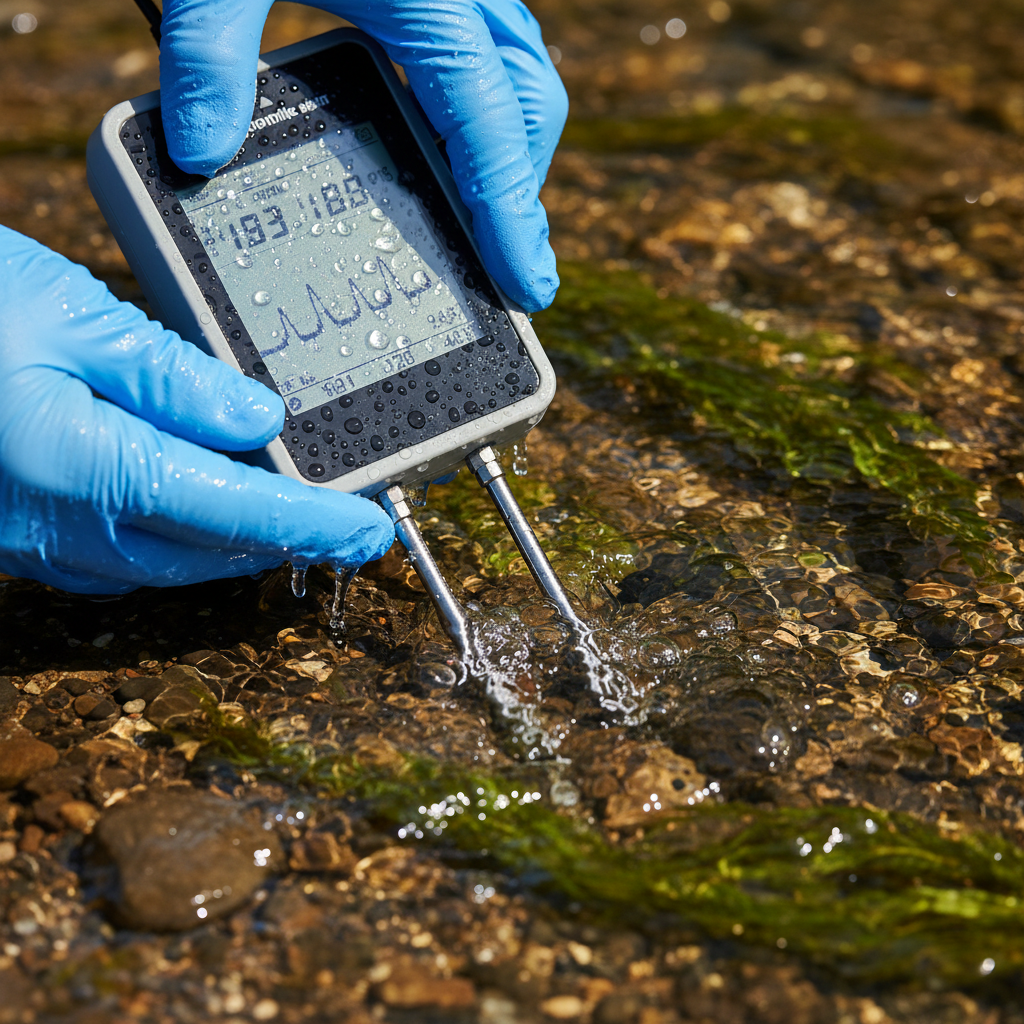
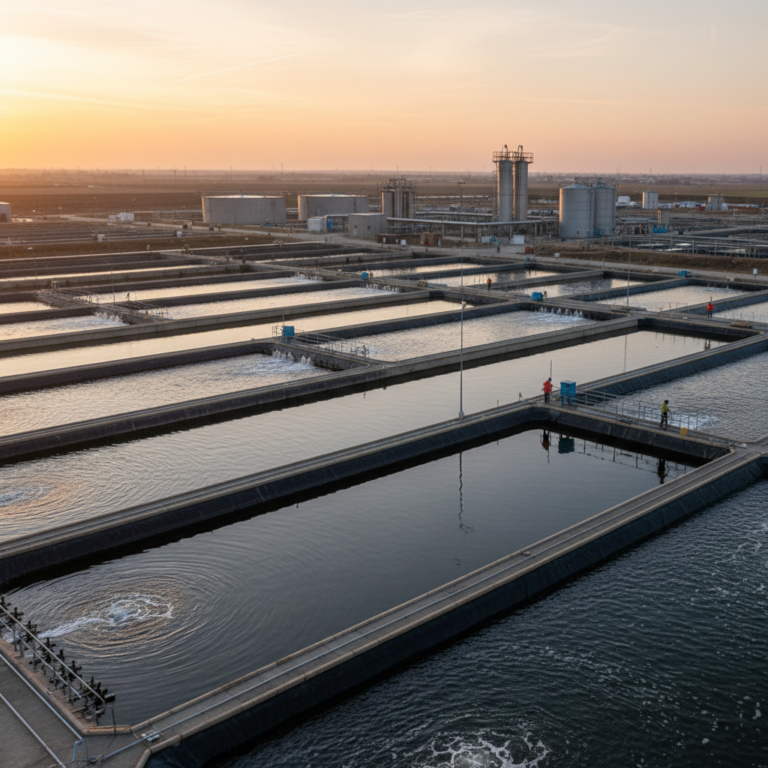
Water monitoring measures pH, temperature, conductivity, dissolved oxygen, turbidity, and specific contaminants. USGS alone operates more than 13,500 real-time monitoring locations with over 135 years of water data from more than one million sites. Instruments include multiparameter sondes, spectrophotometers, turbidimeters, portable field kits, and dedicated water quality monitoring sensors.
Emissions monitoring uses Continuous Emission Monitoring Systems (CEMS) to measure gas or particulate concentration at the source. EPA defines a CEMS as the total equipment needed for sampling, analysis, and data recording. Not a sensor. A system, by regulatory definition.
Soil and groundwater monitoring depends on well networks, field sensors, and laboratory analysis. The USGS National Field Manual covers sampling procedures for surface water and groundwater, field parameters, and specialized analytes.
Weather and surface-condition monitoring provides the context that shapes every other measurement: temperature, humidity, wind speed, visibility. A PM2.5 reading without wind and humidity data is incomplete data. Similar principles apply to cargo monitoring at sea, where environmental context determines whether transported goods remain within specification.
Market projections vary by scope. MarketsandMarkets estimates $16.1 billion for 2025, growing to $21.1 billion by 2030, driven by tighter regulation, IoT adoption, and rising demand for environmental accountability. The U.S. software segment alone is projected to grow above 6% annually through 2033, reflecting a shift where connectivity, dashboards, and analytics now carry as much weight as the physical sensor.
Five Monitoring Approaches and When Each Fits
Environmental monitoring equipment isn’t a single category. It’s at least five, each suited to a different decision context.
| Approach | What it does | Strengths | Trade-offs | Best for |
|---|---|---|---|---|
| Reference-grade analyzer | Validated measurement at a fixed location | Regulatory comparability, strong evidentiary basis | High infrastructure and operating cost | Compliance, formal studies |
| Low-cost / IoT sensor network | Distributed sensing with wireless connectivity | Spatial density, frequent data, lower unit cost | Drift, interference, calibration burden | Supplemental monitoring, screening, network expansion |
| Manual / discrete sampling | Field collection plus lab or field analysis | Flexible timing, chain of custody, specialized analytes | Low temporal continuity, training-dependent | Confirmation, investigation |
| Online process system | Installed measurement integrated with operations | Rapid feedback, alarms, operational control | Cleaning, consumables, maintenance cycles | Water treatment, industrial process control |
| Remote sensing | Satellite or aerial observation | Regional coverage, event detection | Limited local resolution, atmospheric complexity | Regional context, methane screening, trend analysis |
No single approach covers every use case. Reference systems give you defensibility. IoT networks give you density and frequency. Discrete sampling lets you chase specific analytes with chain-of-custody rigor. Process systems keep operations running with real-time alarms. Remote sensing adds geographic scale no ground instrument can match.
The strongest monitoring programs layer multiple approaches, and that layering is where most equipment guides stop short.
A Sensor Is Not a Monitoring System
This is where most environmental monitoring equipment purchases go sideways.
A measurement chain runs from site selection through sampling, sensing, calibration, quality control, storage, transmission, processing, visualization, and reporting. Break any link and data quality degrades, regardless of what the sensor spec promises.
EPA’s CEMS definition makes the point explicitly: a CEMS isn’t a gas analyzer. It’s the complete equipment for sampling, analysis, and data recording. Regulators already think in systems. Buyers should catch up.
Site selection alone can invalidate an entire dataset. During the Flint drinking water crisis, researchers found that sentinel monitoring and voluntary household sampling produced contradictory conclusions about lead levels during the same two-month period. The voluntary program flagged rising contamination and failed the action-level criterion. Sentinel monitoring showed improving water quality. Same water system. Same timeframe. Different sampling frames, opposite conclusions.
A technically precise instrument cannot fix an unrepresentative monitoring design. When evaluating environmental monitoring equipment, the first question shouldn’t be “What does this sensor detect?” It should be “What decision does this data need to support, and is the full chain designed to deliver defensible evidence for that decision?”
That chain includes data architecture. Where does the measurement go after the sensor captures it? How is it timestamped, quality-flagged, stored, and accessed? Defensible environmental data collection depends on these choices. A cloud dashboard that displays uncorrected, uncalibrated data with no revision history isn’t a monitoring system. It’s a liability with nice graphics.
Calibration and Quality Assurance in the Field
Everyone agrees calibration matters. Few organizations budget enough time or money for it.
EPA’s quality assurance guidance for air sensors recommends defining data-quality objectives, calibration procedures, quality-control checks, validation protocols, data management plans, and contingency procedures before deployment. This isn’t guidance reserved for federal programs. It’s the minimum for data you’d want to stand behind in any professional context.
Low-cost sensors make calibration especially difficult. A 2024 review identified sensor-to-sensor variation, drift over time, and environmental interference (temperature, humidity, cross-sensitivity to other gases) as persistent challenges. A calibration model developed at one location in summer may not hold at a different site in winter. Drift and interference need to be in the operating plan, not just the acceptance test.
Detection limits are another area where product labels mislead. EPA defines the method detection limit as a procedure-specific estimate of the minimum concentration a method can reliably distinguish. It’s a property of the method under specific conditions, not a fixed number stamped on hardware. Two identical sensors deployed in different environments will have different effective detection limits. That distinction matters more than most spec sheets acknowledge.
The practical minimum for any serious monitoring program:
- Collocate new sensors with a reference instrument before relying on them.
- Run comparison data over a period that captures relevant environmental variation.
- Document correction factors and apply them consistently.
- Re-check on a schedule that accounts for seasonal shifts and sensor aging.
EPA publishes testing protocols, performance targets, and reporting templates for exactly this purpose. If your QA plan doesn’t reference something similar, the data coming out of your network has an expiration date you just don’t know yet.
How Layered Architectures Beat Single-Technology Bets
The strongest monitoring programs don’t pick one equipment type and scale it. They layer several to cover what no single technology can.
Methane monitoring is the clearest example. EPA’s final rule for oil and gas operations allows satellites, aerial surveys, and continuous ground monitors to identify leaks and super-emitter events. Each fills a different gap. Satellites scan broad areas but can’t resolve a 10 kg/hour leak from a single tank. Ground sensors can detect that leak, but only if placed correctly relative to the plume. A modeled case in West Texas showed detection probability for fixed-duration events ranged from under 30% to over 90%, depending on sensor count and placement. Geometry, not sensitivity, was the deciding factor.
USGS’s National Water Monitoring Network applies the same logic. Over 11,000 streamgaging sites, more than 100 river locations for water quality, and over 2,000 groundwater wells. Automated continuous sensors provide real-time awareness. Manual collection and discrete lab samples provide confirmation. Neither layer alone is sufficient.
NASA’s TEMPO satellite delivers hourly daytime air-quality observations over North America, adding a regional layer no ground network can replicate. But TEMPO can’t tell you what’s happening at breathing height near a construction fence line. Ground sensors can. These are layers, not substitutes.
For industrial and facility operators, the same principle applies at smaller scale. Continuous IoT sensors handle the 24/7 awareness layer: temperature, humidity, air quality, vibration. Manual rounds confirm anomalies. External lab analysis produces the audit-ready records. This layered approach is the foundation of industrial environmental monitoring that actually works. Similar layered architectures support port equipment tracking, where environmental sensors integrate with location monitoring to protect assets in harsh outdoor conditions, and greenhouse environmental monitoring, where the same layering turns readings into ROI. The equipment list can be modest. The architecture, along with environmental monitoring automation, is what converts readings into operational intelligence.
The Real Cost Beyond the Purchase Order
A $500 sensor paired with a $0 calibration budget produces $0 worth of defensible data.
True monitoring cost includes hardware, installation, connectivity, calibration consumables, reference comparisons, maintenance labor, data management, software subscriptions, training, and eventual replacement. The U.S. environmental monitoring software segment alone is projected to grow from $4.1 billion in 2024 to $6.1 billion by 2033, with cloud platforms leading the growth. Software is no longer an add-on. For many programs, it’s becoming the dominant ongoing expense.
This creates a real choice between capital expenditure (buy the hardware, own the maintenance and calibration) and operational expenditure (subscribe to monitoring-as-a-service, shift upkeep to the provider). Neither model wins in every situation. Capex works when you have in-house expertise and a long planning horizon. Opex works when you need speed, predictable budgets, or don’t have specialized staff to maintain instruments.
One cost that rarely makes it onto the procurement spreadsheet: data governance after a vendor change. If your cloud platform shuts down or revises access terms, what happens to years of environmental records that may be tied to compliance obligations, including environmental compliance monitoring records? Any serious RFP should require raw-data access, documented calculation methods, full export capability, and a clear exit plan.
What’s Shifting in 2026
Several regulatory and technology changes are reshaping environmental monitoring equipment decisions right now.
EPA’s revision of the annual primary PM2.5 standard from 12 to 9 µg/m³ (finalized in 2024) tightens the bar and increases demand for denser monitoring coverage. A peer-reviewed analysis argues that the current U.S. ambient air monitoring network is inadequate for this new threshold. The implication: more monitors, better spatial distribution, and stronger QA/QC aren’t optional.
PFAS monitoring is accelerating fast. EPA’s drinking water regulation sets maximum contaminant levels as low as 4.0 parts per trillion for PFOA and PFOS, with initial monitoring and reporting due by 2027. Portable PFAS detection platforms using UV-Vis spectrometers and fluorimeters are emerging as field tools, but they haven’t replaced validated laboratory methods. Treat them as screening instruments for now, not compliance instruments.
EPA has also committed roughly $81 million for monitoring network grants and $2 million for sensor deployment in disadvantaged communities. Funding can jumpstart deployments, but data quality still hinges on siting plans, maintenance commitments, and defined quality objectives.
USGS’s Next Generation Water Observing System is testing autonomous underwater vehicles, new sensor types, and methods to improve spatial and temporal resolution. These are research-stage projects, not products available today. But they signal the direction: more autonomous, more distributed, more data-intensive.
The through-line across all these shifts is the same: build the data system around the sensor, not the other way around. The equipment is only as good as the architecture it plugs into. If your organization monitors environmental conditions for compliance, asset protection, or operational safety, and your current setup feels like scattered readings instead of connected intelligence, that’s the gap worth addressing. Our environmental tracking solutions at Datanet are built around exactly this principle: integrated IoT sensors for temperature, humidity, soil, and water conditions, connected end-to-end with alerting, dashboards, and data export. Reach out if you want to talk system design before hardware specs.
Frequently Asked Questions
Can a low-cost sensor replace a reference-grade analyzer?
Not by default. EPA recommends collocating low-cost sensors with reference monitors, running comparison data, applying correction factors, and validating over time. Low-cost sensors add spatial density and measurement frequency, but they require structured QA/QC to produce data suitable for anything beyond initial screening.
Does continuous monitoring eliminate manual sampling?
No. USGS deliberately combines automated continuous sensors with manual field collection and discrete laboratory analysis. Continuous monitoring catches events and trends. Manual and lab samples confirm them with method-specific, defensible results. They serve different roles in the same monitoring architecture.
What should a monitoring equipment procurement spec include?
Define the decision the data must support first. Then specify target analytes, location, temporal resolution, data-quality requirements, calibration procedures, quality-control protocols, metadata standards, data access and export requirements, maintenance schedules, contingency plans, and reporting format. Separate informational monitoring from regulatory compliance early in the process.
Is a sensor’s detection limit a fixed number?
No. EPA describes the method detection limit as a procedure-specific estimate tied to method, conditions, and sample matrix. The same sensor model deployed in different environments can have different effective detection limits. Evaluate performance under your actual deployment conditions, not the label specification.
Can satellites replace ground-level monitors?
Not for most local decisions. Satellites like NASA’s TEMPO provide regional context and hourly broad-area coverage, but their resolution can’t capture street-level or fence-line conditions. EPA’s methane rule recognizes satellite, aerial, and ground technologies as complementary layers, not interchangeable options.
How often should environmental sensors be recalibrated?
Frequency depends on sensor technology, environmental conditions, and required accuracy. EPA recommends scheduled quality-control checks and periodic collocation with reference instruments. For low-cost air sensors, seasonal recalibration is often necessary because temperature, humidity, and pollutant mixtures alter sensor response. Build the calibration schedule and budget into the operating plan from the start.



 +1 508 292 2210

3 Responses