

Heating accounts for 65% to 85% of annual energy cost in a year-round commercial greenhouse. In a California field evaluation, one indoor farm consumed 18 times the energy per square foot of an orchid greenhouse in the same state. Same crop category. Wildly different energy profiles. The difference was not the sensor count. It was how each operation used its data to manage lighting, HVAC, and irrigation together.
Greenhouse environmental monitoring means continuously measuring the conditions surrounding your crop (temperature, humidity, CO2, light, substrate moisture, airflow, energy) and turning those measurements into decisions that protect yield, cut waste, and prevent catastrophic loss. That second part, turning data into decisions, is where most systems fall short.
I spend most of my time deploying IoT for aviation, logistics, and industrial operations, including cargo monitoring at sea where environmental control is equally critical. The pattern repeats across every vertical: organizations buy sensors, install dashboards, and then discover that visibility alone changes nothing. Greenhouses are no different. This guide covers what to measure, where to place it, which architecture to choose, and where the real return lives. If you manage a commercial greenhouse, a controlled-environment facility, or specify monitoring systems for growers, this is for you.
What Greenhouse Environmental Monitoring Actually Covers
There is an important distinction between monitoring and control. Monitoring observes the crop environment. Control changes it through fans, vents, heaters, screens, lights, pumps, valves, and CO2 injection. Most commercial systems blend both, but confusing the two leads to bad procurement decisions. You can monitor without controlling (a retrofit sensor platform that adds visibility to existing equipment). You cannot control well without monitoring.
A 2025 review of smart greenhouse systems describes the integration of temperature, humidity, CO2, light, soil moisture, IoT automation, and advanced data filtering as the current state of the art. In practice, the measurement stack breaks into five layers:
| Layer | What You Measure | Decisions It Drives |
|---|---|---|
| Air and canopy climate | Temperature, relative humidity, vapor pressure deficit (VPD), CO2, airflow | Heat, vent, fan staging, dehumidify, inject CO2, adjust setpoints |
| Light | PAR (photosynthetically active radiation), DLI (daily light integral), outside solar radiation | Dim or raise supplemental LEDs, open or close shade and thermal screens |
| Root zone and fertigation | Substrate moisture, EC, pH, irrigation flow, drain volume | Start or stop irrigation, adjust nutrient concentration, detect clogged lines |
| Plant and biological state | Leaf temperature, leaf wetness, canopy imagery, disease indicators | Estimate stress, VPD at leaf level, disease risk, growth stage |
| Facility and energy | Electricity, thermal energy, fan speed, pump status, water consumption | Stage equipment, reduce demand peaks, compare zones, validate savings |
For most commercial greenhouses, the minimum viable set is canopy-level temperature and humidity, CO2, PAR or DLI, substrate moisture, irrigation flow, outdoor weather, and energy metering. Add EC and pH for hydroponic or fertigation systems. Add leaf temperature and cameras only when you have a specific decision and a response protocol for those signals.
More sensors without a response owner do not create intelligence. They create noise.
Sensor Placement Changes Everything
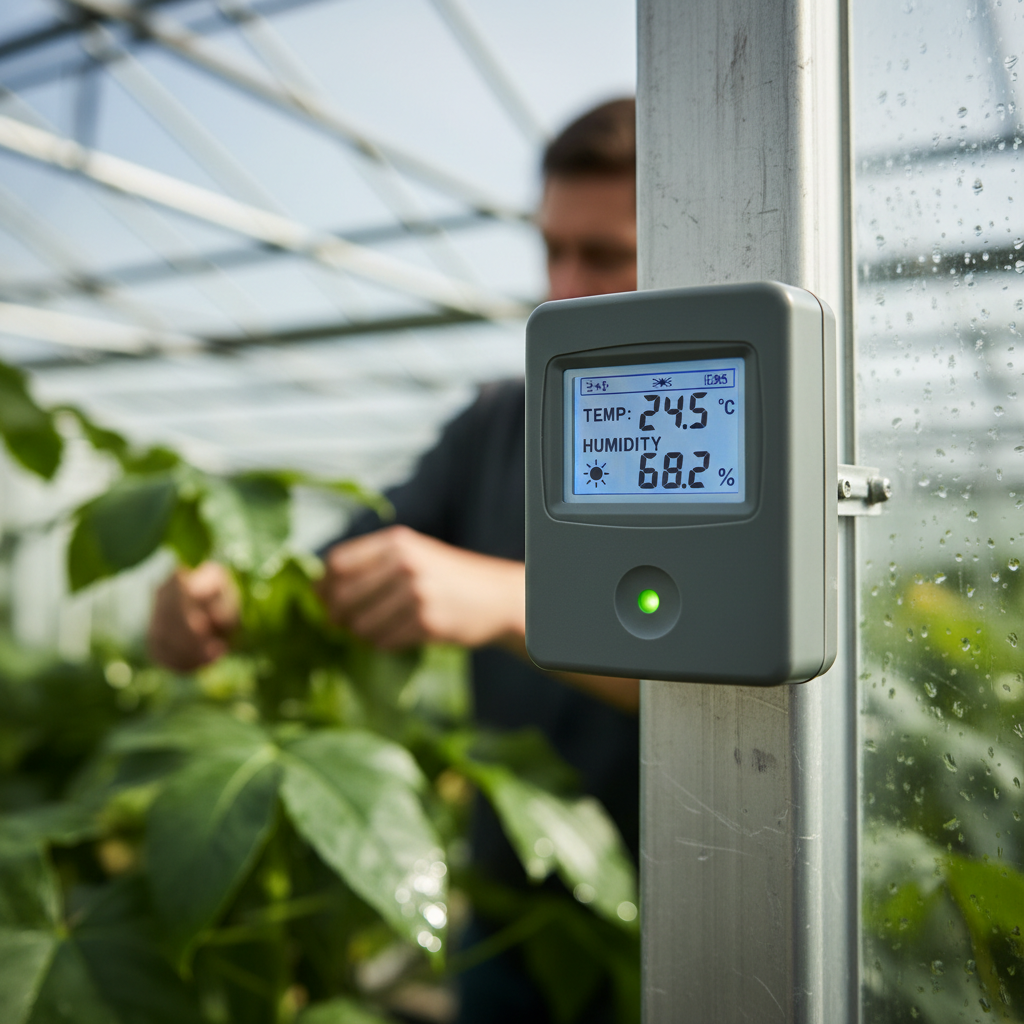
A sensor in the wrong spot makes a sophisticated controller faithfully optimize the wrong microclimate. This is not a theoretical risk. It is the most common cause of “the system says everything is fine but my plants disagree.”
The University of Alaska Fairbanks extension guide is direct about this: place temperature and humidity sensors at canopy height, away from direct influence of heaters, vents, fans, and drafts, shielded from direct sun, and preferably aspirated. Aspiration matters because a sensor in direct sunlight can report temperatures several degrees above actual air temperature. Several degrees is enough to make your controller close vents when they should be open.
Airflow adds another dimension. Ventilation removes moisture-laden air, while horizontal air circulation mixes warm and cool pockets and prevents condensation near the dew point. If your humidity sensor sits in a dead-air pocket behind equipment, it reads a microclimate that exists in a two-square-foot area, not the 10,000-square-foot growing zone you care about. Your control system responds accordingly, and every correction it makes is wrong.
Before debating sensor brands or wireless protocols, draw a floor plan. Mark heat sources, vents, fans, shade patterns, and irrigation zones. Place sensors where the crop actually grows, not where cable runs are convenient. In my experience across industrial IoT, placement audits catch more problems than firmware upgrades ever will.
Architecture: Cloud, Local, or Both
A typical greenhouse monitoring architecture has four layers. Sensors sample the environment. A local gateway or process computer cleans data, applies safety limits, and controls actuators. Cloud software stores histories, runs dashboards, manages alerts, and enables multi-site comparison. An analytics or AI layer forecasts crop, climate, energy, or equipment behavior on top of the stack.
The connectivity layer between sensors and gateway is where protocol decisions live. Common wireless options include ZigBee (low power, mesh networks), LoRa (long range, lower data rate), Wi-Fi (high throughput, higher power), and NB-IoT (cellular, good for remote or distributed sites). Each carries trade-offs in range, power consumption, bandwidth, and infrastructure cost. A NIST greenhouse prototype demonstrated an open, modular approach using IEEE P1451 standards and MQTT messaging. Most commercial climate computers use proprietary protocols instead, which simplifies initial setup but limits interoperability down the road.
The resilience question matters most. If your internet drops at 2 AM in January, does your greenhouse keep heating? Cloud analytics are valuable for benchmarking, trend analysis, and remote oversight. But life-critical loops (heating, ventilation, irrigation, alarms) need local control and manual override. A hybrid architecture gives you both: local safety, cloud intelligence. That is the right answer for almost every commercial greenhouse.
Energy and Water: Where the Money Actually Lives
Most conversations about greenhouse environmental monitoring start with temperature and humidity alerts. The conversations that lead to ROI start with energy and water.
The California ETCC field evaluation visited four controlled-environment operations across different climate zones and compared automated, integrated controls (lighting, HVAC, and irrigation working as one system) against simpler time-switch lighting with no integrated management. One indoor cannabis farm averaged 369,200 kWh per month with 979 kW peak demand. Its electric energy-use intensity was 18 times that of the orchid greenhouse, primarily because of sole-source lighting and more intensive cooling.
That comparison alone shows why monitoring must include energy metering. Without energy data, you cannot see the single largest cost lever in your operation, and you also lose the audit trail that supports greenhouse gas reporting. The same evaluation found that advanced DLI-based lighting controls showed measurable efficiency gains but faced limited commercial adoption because of high upfront costs. Technology exists. Adoption depends on whether the savings model works at your scale.
Water and humidity are coupled, and most growers treat them as separate problems. A 2025 water-systems analysis reports potential greenhouse water savings of 50% to 90% through closed-loop measurement: irrigation, drainage, humidity, and plant demand considered together instead of watering on a fixed timer. But “potential” carries fine print. Some high-efficiency technologies require specific capital, maintenance, and climate conditions. Measure your baseline first. Then target the gap.
AI and Predictive Control: Useful, Not Magic
AI in greenhouse monitoring is real and growing. It is also oversold.
A Taiwan tomato greenhouse study used weather forecasts, internal climate readings, PAR, CO2, and wind data to predict microclimate conditions three hours ahead. The AI model informed decisions about fans, plastic films, and shading nets. PAR forecasting achieved an R² of 0.84. That is meaningful, but it also means the model missed 16% of variance. For a research greenhouse, that is a strong result. For a commercial operation betting a high-value crop on automated shade control, that 16% needs hard safety bounds.
Digital twins (virtual models mirroring a physical greenhouse in real time) are moving from concept to early deployment. One 2025 study reported that distributed lighting control guided by a digital twin reduced electricity consumption by 52.6% and improved canopy light uniformity by 5.8% versus fixed-duration lighting. Promising. But the same researchers note that sensor reliability, data integration, and computational resources remain barriers, and advanced predictive capabilities are still early-stage.
The practical approach for 2026: treat AI as a decision-support layer, not an unsupervised controller. Let the algorithm recommend or stage actions inside hard safety limits for temperature, humidity, light, and irrigation. Keep a human in the loop. Expand autonomy only after the model has demonstrated accuracy against your crop, your facility, and your climate for at least two full growing cycles.
Calibration, Cybersecurity, and the Discipline That Saves Crops
Sensor drift is silent. A CO2 sensor that reads 50 ppm low for three months quietly costs you yield because your controller never injects enough. A pH probe that drifts 0.3 units changes nutrient availability at the root zone. Nobody sends an alert for slow drift.
Calibration schedules vary by sensor type, but the principle is universal: every sensor needs a reference check at a defined interval, and the calibration date must be stored with the data. One practical guide recommends monthly calibration for pH and EC sensors using certified solutions. Temperature and humidity sensors need periodic checks against a reference instrument. CO2 sensors require attention to drift under different ventilation conditions. PAR sensors need a clean optical surface and consistent placement. If your historical crop decision was based on unmarked sensor drift, you drew conclusions from bad data.
Cybersecurity is the other unglamorous requirement that matters more with each connected device. A 2025 study simulated combined denial-of-service attacks and sensor faults in a tomato greenhouse, demonstrating how the combination could mask critical environmental conditions from operators. USDA’s agricultural cybersecurity guidance warns that connected devices in agriculture are vulnerable to data theft, operational disruption, and tampered equipment that can cascade through supply chains.
Practical safeguards: segment your network between IT and operational systems. Use strong authentication and encrypted communications. Require signed firmware updates. Enforce role-based access and audit logs. Maintain offline safety controls for heating, ventilation, and irrigation. Have a clear end-of-life plan for devices no longer receiving patches. Make cybersecurity a vendor selection criterion, not an afterthought you address after the first incident.
The Growth Narrative Has a Footnote
The controlled-environment agriculture market is growing. One commercial estimate values global smart greenhouse systems at $2.1 billion in 2024, projecting $4.2 billion by 2030. Environmental sensors represented nearly 28% of installations. Broader CEA market estimates range from $33 billion to $92 billion depending on what gets counted (greenhouses, vertical farms, equipment, software, services, crops). The trajectory points up.
The footnote: growth in operations and technology spending does not mean growth in profitability.
Bowery Farming ceased operations in November 2024 after raising more than $700 million and reaching a reported $2.3 billion valuation. The causes: rising costs, weakening demand for premium produce, and difficulty securing financing. AppHarvest raised more than $800 million, reported a $32 million net loss before its first greenhouse had been open for a year, and later entered bankruptcy. Plenty filed Chapter 11 in March 2025 and emerged two months later, refocused on a single crop and a single farm.
USDA data shows U.S. CEA operations nearly tripled from 1,015 in 1998 to 2,994 in 2019, and production volume rose 56% in the decade ending 2019. But real CEA crop sales peaked at $769 million in 2014 and declined to $626 million by 2019, partly because dominant crop values fell. More volume, more facilities, lower revenue per unit.
What does this mean for monitoring? Environmental sensors and climate controls improve execution. They reduce variability, cut energy waste, prevent catastrophic loss overnight. They cannot rescue an uneconomic crop choice, an oversized capital structure, or a premium pricing strategy the market will not support. Size the monitoring system to the operation’s economics, not its pitch deck.
How to Build a Monitoring Plan That Pays Back
Start with the crop, not the catalog. Define the physiological targets (temperature range, humidity band, DLI requirement, CO2 concentration, irrigation frequency) for what you are growing. Every sensor you install should map to a target, a threshold, an actuator response, and a person responsible for reviewing exceptions.
Then establish a baseline. You cannot prove savings without knowing where you started. Meter your energy consumption by zone for at least one growing cycle before making efficiency claims. Measure water input and drain volume. Record yield and quality per zone. This baseline becomes the benchmark against which every investment is measured.
Pilot before you scale. Instrument one zone with the full stack (climate, light, root zone, energy). Run a parallel zone with your existing setup. Compare yield, quality, energy per kilogram, and water per kilogram over a complete cycle. If the instrumented zone pays back, you have a business case for expansion. If it does not, you have data that tells you why.
A few principles from deploying IoT across industries that apply directly to greenhouses:
- Every sensor needs a defined location, accuracy specification, calibration schedule, data owner, alarm threshold, and actuator response. If any of those is missing, the sensor is a cost, not a tool.
- Buy the smallest architecture that closes a measured operational gap. A retrofit monitoring platform is enough if you only lack visibility. An integrated process computer is justified when the bottleneck is actuator coordination across climate, irrigation, and energy.
- Require every vendor to disclose sensor accuracy, calibration protocol, API support, local fallback capability, cybersecurity posture, data ownership terms, and evidence of measured performance. A marketing percentage is not a business case.
- Plan for interoperability from day one. Proprietary ecosystems solve the first deployment. Open protocols solve the fifth.
If your greenhouse operation needs environmental monitoring that connects to operational decisions rather than generating dashboards nobody checks, our team designs sensor deployments for exactly that outcome. We provide environmental tracking devices built for industrial and agricultural conditions, with integration support to make them useful from the first week. Talk to us if your monitoring system should do more than send alerts.
Frequently Asked Questions
What should a greenhouse monitor first?
Canopy-level temperature and relative humidity, CO2, PAR or DLI, substrate moisture, irrigation flow, outdoor weather, and energy consumption. Add EC and pH for fertigation systems. Add leaf temperature and cameras only when you have a defined decision and response protocol for that data.
Is environmental monitoring the same as greenhouse climate control?
No. Monitoring collects and displays measurements. Control uses those measurements to command fans, vents, heaters, screens, lights, pumps, valves, or CO2 systems. You can monitor without controlling, but effective climate control requires accurate, continuous monitoring as its foundation.
How often do greenhouse sensors need calibration?
It varies by type. pH and EC probes typically need monthly calibration with certified solutions. Temperature and humidity sensors need periodic reference checks. CO2 sensors require attention to drift. PAR sensors need a clean optical surface. Store calibration dates with the data so historical decisions remain traceable.
Should I choose cloud-based or local monitoring?
Both. Use cloud software for remote access, multi-site benchmarking, and trend analytics. Keep local control for safety-critical loops like heating, ventilation, and irrigation so the greenhouse operates normally during internet outages. Hybrid architecture delivers resilience without sacrificing insight.
Can greenhouse monitoring guarantee higher yields?
No system guarantees yield increases. Monitoring creates the information and control opportunity, but outcomes depend on crop selection, climate, setpoints, equipment condition, operator response, and baseline economics. The measurable value is reduced variability and prevented loss, not a universal yield promise.
What does a greenhouse monitoring system cost?
Cost depends on sensor count, connectivity type, gateways, control outputs, software licensing, installation, and integration with existing equipment. Individual substrate sensors start around $200. The practical approach: price a minimum viable zone, add annual support and replacement probes, and weigh that against the value of avoided crop loss and energy savings at your specific operation.


 +1 508 292 2210

4 Responses