

A vertical farm can install high-efficacy LED fixtures and still burn electricity on photons that never reach a leaf. The fixtures might test beautifully in a lab. The problem starts after installation: canopies close, reflectors collect dust, drivers shift with temperature, and nobody measures what actually arrives at the plant.
LED lighting monitoring for vertical farms is the practice of measuring, recording, and controlling the photons plants receive at the canopy, then connecting that data to energy costs, crop outcomes, and business decisions. A 2025 experimental study found that switching from fixed-hours control to a DLI-responsive system reduced LED energy consumption by at least 43%. Same basil crop. Same LED hardware. Different control logic.
That result came from a small pilot (six pots, 0.2 m²), not a commercial-scale operation. It still matters because it isolates the variable: control intelligence, not fixture specs, drove the savings.
A Timer Is Not a Monitoring System
Most vertical farms commission their lights and set a schedule. LEDs on at 05:00, off at 21:00, intensity fixed at whatever the integrator dialed in. That is scheduling. It tells fixtures what to do. It does not tell the operator what the plant received.
Monitoring adds measurement and closed-loop response. At minimum, it answers four questions every growing day:
- How many photosynthetically active photons hit the canopy each second?
- How many accumulated over the full photoperiod?
- Is light uniform across every tier and zone, or are edges starving while centers saturate?
- How much electricity did the fixtures consume to deliver those photons?
A timer cannot answer any of those. It assumes today’s conditions match the day the schedule was set. They do not. Fixtures degrade over thousands of operating hours. Canopies close and change the reflective geometry. Ambient temperature shifts driver efficiency. In hybrid facilities with skylights or supplemental daylight, natural light varies hourly.
The cost of that blind spot is large. A 2025 benchmarking review found that current lettuce vertical farms consume 10 to 18 kWh per kilogram of crop, with lighting representing roughly 65 to 90% of total energy. At those ratios, even a 15% measurement-driven improvement in lighting efficiency drops straight to the bottom line.
Four Metrics That Define Light Delivery
If your monitoring system does not track all four of these, you have data gaps that translate to crop and cost gaps.
PAR (Photosynthetically Active Radiation) is the wavelength range plants use for photosynthesis. University of Missouri Extension places it at approximately 400 to 700 nm, with additional plant responses in UV and far-red wavelengths. PAR is a range, not an intensity number. You cannot “increase PAR” the way you increase power.
PPFD (Photosynthetic Photon Flux Density) measures how many PAR photons land on one square meter of canopy every second, expressed in µmol/m²/s. This is the instantaneous reading. A fixture datasheet might say 800 µmol/m²/s, but that number was measured at a specific distance, angle, and temperature in a test lab. Move the sensor six inches sideways at installation height and the reading changes.
DLI (Daily Light Integral) accumulates PPFD over an entire day, measured in mol/m²/day. DLI is the total photon budget the plant received. Two farms can run identical PPFD levels and deliver different DLIs if their photoperiods or dimming profiles differ. DLI is what the plant “ate” today, and for many crops it correlates more directly with biomass than any single instantaneous reading.
Then there is uniformity: the metric most farms skip. A sensor at the center of a tier might read 600 µmol/m²/s while the corners read 350. The average looks acceptable on a dashboard. The corners produce smaller, lighter, less marketable heads. Mapping PPFD across the entire canopy surface (corners and center, as Missouri Extension recommends) is what separates monitoring from spot-checking.
System Architecture: Five Layers, Five Failure Points
A complete monitoring system is a stack. Each layer has a job, and each can fail independently.
| Layer | What it does | Common failure mode |
|---|---|---|
| Fixtures and drivers | Convert electricity to photons; respond to dimming signals | Driver overheating, LED channel drift, gradual efficacy loss over thousands of hours |
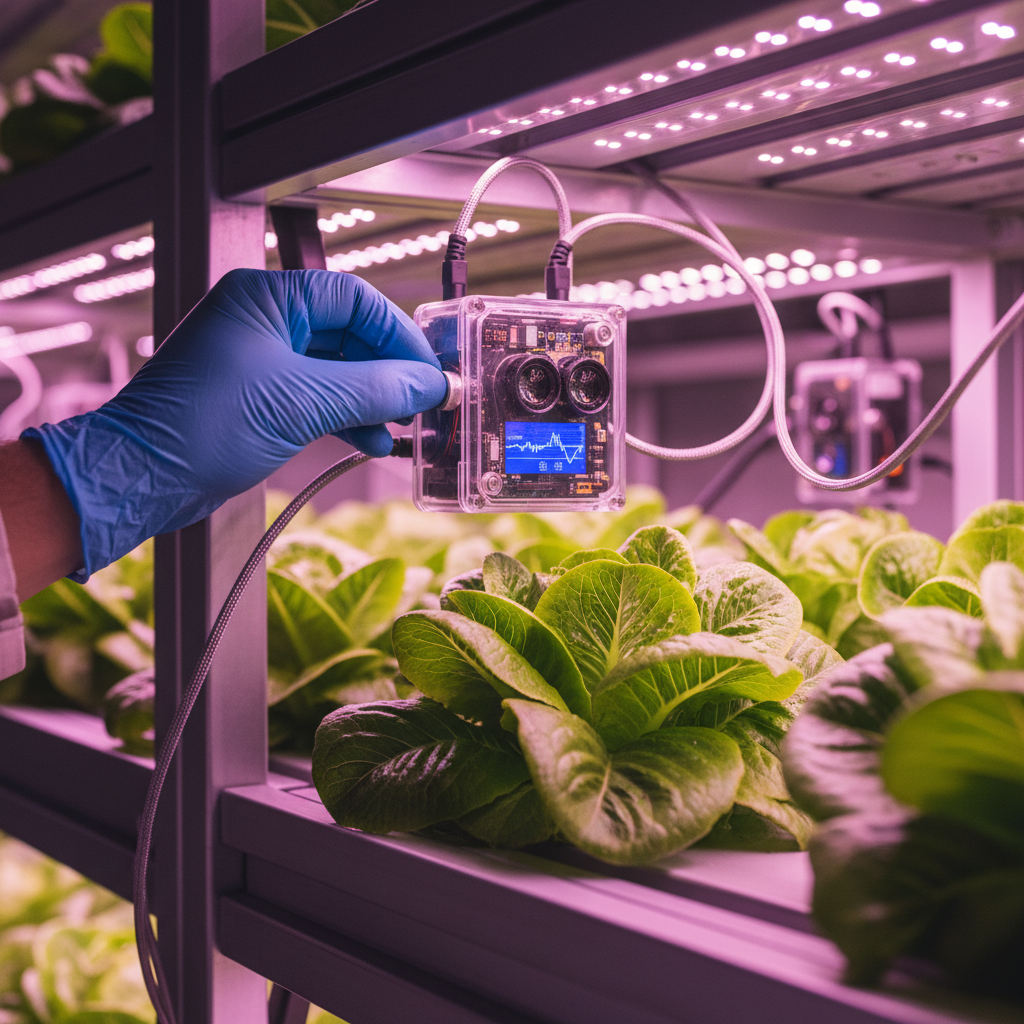
| Canopy sensors | Measure PPFD, spectrum, and uniformity at the actual plant level | Calibration drift in humid/warm environments; placement that doesn’t represent the full tier |
| Edge control | Local PLC or microcontroller sends dimming signals (PWM, 0-10V), processes sensor data, maintains safety | Firmware bugs; single point of failure; no local fallback when cloud connectivity drops |
| Supervisory software | Dashboards, recipes, alarms, historical data, API connections to climate and irrigation | Vendor lock-in; no data export capability; subscription cost creep; recipe-update latency |
| Context data | Temperature, humidity, CO2, irrigation, nutrient EC/pH, camera images, harvest weights | Fragmented systems that don’t share data; manual logging that introduces lag and errors |
The 2025 research prototype shows this stack at pilot scale. Each growing unit used three AS7341 multispectral sensors, three LED strips, and a Raspberry Pi Zero 2 W. A multiplexer, PWM-to-voltage converter, LED driver, Shelly smart switch for power measurement, and Google Cloud connection completed the loop. Total hardware cost came in under 100 euros. That is a research prototype, not a safety-certified commercial system. But it demonstrates the principle: if you can measure photons at the canopy, measure watts at the driver, and connect both to a controller, you have the bones of a monitoring architecture.
Now the part nobody in the vendor literature wants to address. Most commercial farms run fixtures from one manufacturer, sensors from another, climate controls from a third, and irrigation from a fourth. Getting spectral data from the sensor into the lighting controller, then correlating it with temperature and humidity logs from the climate system, often requires custom middleware or manual CSV exports. There is no universal protocol for horticultural monitoring the way BACnet or Modbus serves building automation. Farms that buy the “best” component in each category often end up with five dashboards and no single source of truth about what is happening at the canopy.
Control Strategies That Move the kWh/kg Number
The monitoring layer is only valuable when it drives different decisions than a timer would. Three strategies show measurable impact.
| Strategy | Mechanism | Energy impact | Monitoring requirement |
|---|---|---|---|
| Fixed hours | Lights run on a clock at preset intensity | Baseline: 10-18 kWh/kg for lettuce | None (timer only) |
| DLI-responsive | Controller tracks accumulated PPFD and fills the daily gap | Up to 43% reduction vs. fixed hours (one pilot study) | Canopy PPFD sensors, real-time DLI integration |
| Close-canopy / focused lighting | Fixtures placed closer to plants or aimed at planted area only | Highest efficiency at closest tested separation | Uniformity mapping across the tier |
| Spectrum tuning | Multichannel LEDs adjust blue/red/far-red ratio by growth phase | Variable; primary impact on quality and morphology | Multispectral sensors for recipe verification |
DLI-responsive control
Instead of running lights for a fixed 16-hour photoperiod at constant intensity, the controller tracks accumulated PPFD throughout the day and supplements only the photons the plant still needs to reach a target DLI. The 2025 basil experiment tested three regimes:
- 12.5 mol/m²/day: 1.64 kWh/kg (lowest energy, lowest yield)
- 15.0 mol/m²/day: 4.90 kWh/kg
- 17.5 mol/m²/day: 3.71 kWh/kg, with 36% more biomass than the 12.5 regime
Notice the middle row. The 15 mol/m²/day regime consumed more energy per kilogram than the 17.5 regime. Higher DLI meant more total electricity, but the 36% yield jump at 17.5 more than compensated. The additional photons paid for themselves in additional saleable grams. Without canopy-level monitoring and DLI tracking, that tradeoff is invisible. You see the monthly electricity bill. You do not see the grams-per-kWh curve underneath it.
Close-canopy and focused lighting
Purdue University research tested a different lever: placing photons where the plants are, not where the plants will eventually be. Close-canopy lighting moves fixtures nearer to the leaves, reducing the fraction of photons that hit walls, aisles, and empty tray surfaces. Focused lighting goes further, narrowing beam coverage to match seedling density and expanding it as the canopy fills in.
In Purdue’s experiments, the closest tested fixture-to-plant separation produced the highest energy-use efficiency. The physics are straightforward: halve the distance, roughly quadruple the photon density for the same wattage. But it only works if you monitor uniformity. Move fixtures closer and you amplify hotspots. Without canopy-level PPFD mapping, close-canopy strategies trade one waste problem (photons hitting walls) for another (burning center leaves while edges starve).
Spectrum control
Multichannel LED systems can shift the ratio of blue, red, far-red, and white light by growth phase or cultivar. Blue light tends to compact plant morphology. Red drives photosynthesis. Far-red triggers elongation and flowering responses. The business case extends beyond energy. It is flavor, color intensity, shelf life, and compactness (which determines how many sellable units fit per tray).
Spectral monitoring uses multispectral sensors to verify that the recipe being delivered matches the recipe that was programmed and to catch channel degradation before it shows up in the crop. A red LED channel that drifts 5% over 10,000 hours changes the light recipe silently. If nobody measures it, nobody catches it until a batch of pale, elongated basil reaches the packing line.
Where Monitoring Pays and Where It Cannot Save You
The energy benchmarks are clear on the opportunity. Published data put current lettuce vertical farms at 10 to 18 kWh/kg, with a technical best-practice target of 3.1 to 7.4 kWh/kg. The gap between median performance and best practice is a factor of two to three. Monitoring, adaptive control, close-canopy placement, and better fixtures each close part of it.
But monitoring is not a business model. It is a tool that improves one variable in a multi-variable equation.
Bowery Farming closed its doors after raising more than $700 million and reaching a reported $2.3 billion valuation. Agriculture Dive reported 187 layoffs across facilities in Pennsylvania and Maryland, citing financing difficulty and rising costs. Bowery had automation, brand partnerships, and capital. What Bowery did not have was a contribution margin that covered fully loaded costs at scale.
AeroFarms filed Chapter 11 in June 2023, then reported profitability for two consecutive quarters after restructuring. The turnaround did not come from new fixtures. It came from a restructured cost base and tighter operational discipline.
The lesson is not that LED monitoring failed these companies. It is that photon optimization cannot override electricity prices, rent, labor costs, capital structure, or crop selection. A monitoring system that saves 43% on lighting energy is saving 43% of roughly 65 to 90% of total energy. That is meaningful. It is not sufficient on its own. The farm dashboard that matters shows kWh per kilogram, grams of saleable product per kWh, fully loaded cost per unit, sell-through rate, and cash runway on the same screen.
How to Choose Fixtures, Sensors, and Platforms
Procurement decisions happen across three layers. Conflating them leads to expensive mistakes.
Fixtures
LED efficacy continues to improve, but the published range in the benchmarking literature spans 1.3 to 3.0 µmol/J. The DesignLights Consortium’s Horticultural Technical Requirements V4.0 sets the minimum PPE threshold at 2.5 µmol/J, an 8.7% increase over V3.0. A listed fixture meets that qualification threshold under controlled test conditions. It does not guarantee performance at your facility’s ambient temperature, humidity, dimming level, or operating spectrum.
What to ask any fixture vendor: independent PPFD distribution maps at your planned installation height, thermal derating curves, dimming performance across your target intensity range, lifetime projections at your operating temperature, and the control protocol (PWM, 0-10V, DALI, or proprietary). Also ask what happens to the warranty when the fixture runs at non-standard dimming levels or spectra.
Sensors
A calibrated quantum sensor handles PPFD and DLI. A multispectral sensor adds channel-level spectral verification for multichannel fixtures. Deploy sensors at canopy height, at corners and center of each zone, and re-map after any physical change: fixture replacement, tray repositioning, or reflector cleaning.
The challenge nobody mentions in product brochures: sensors in vertical farms operate in warm, humid, sometimes nutrient-mist environments. Calibration drift under those conditions is not a theoretical risk. It is a maintenance line item. Budget for annual recalibration or periodic verification against a reference sensor. A monitoring system that reads inaccurate PPFD gives false confidence, and false confidence is worse than no data at all.
The control platform
The range runs from a sub-100-euro Raspberry Pi prototype to full-scale farm platforms. Siemens and 80 Acres Farms describe the Loop platform as combining crop software, environmental controls, robotics, edge devices, and a digital twin. On the simpler end, tools like Heliospectra’s helioCORE offer zone-based light control and DLI monitoring without the full farm-management stack.
The questions that separate a good purchase from a costly regret:
- Does the platform support fixtures from multiple manufacturers, or does it lock you into one brand?
- Can you export raw data (PPFD logs, DLI history, kWh, spectrum readings) in an open format?
- What happens when internet connectivity drops? Does the edge controller maintain the active recipe and fail safe, or do lights go dark?
- What are ongoing subscription or license fees, and how do they scale with the number of zones?
- Does it integrate with your climate, irrigation, and crop-management systems via API or standard industrial protocols (Modbus, MQTT, OPC-UA)?
What Is Shifting in 2026
DLI-responsive control is moving from research curiosity to procurement expectation. Farms where energy is 60% or more of operating cost can no longer justify fixed schedules. When electricity prices rise, delivering only the photons the plant needs, and not a joule more, shifts from optimization to survival.
Spectral sensing is merging with plant phenotyping. A 2024 review identifies IoT devices, computer vision, and big-data analysis as pillars of modern farm management. The emerging loop: measure light delivered, measure plant response (height, color, leaf area, weight), revise the recipe. The hard part is causality. A camera can detect stress. It cannot prove the light recipe caused it without synchronized temperature, humidity, CO2, and nutrient data.
Energy flexibility is becoming part of the lighting equation. Farms in markets with time-of-use pricing or on-site renewables can shift non-critical photoperiod hours to off-peak windows. The concept is sound. The risk is that a mathematically optimal schedule can be agronomically wrong if the model ignores heat stress, dark-period requirements, or quality effects. Light flexibility needs plant guardrails, not just electricity tariff data.
At its core, the sensor layer in a vertical farm is an industrial IoT problem: devices that survive warm, humid conditions; edge controllers that fail safely; a data pipeline connecting readings to decisions. Environmental monitoring for agriculture extends beyond lighting to temperature, humidity, CO2, and nutrient conditions. At Datanet, we build IoT monitoring architectures across industries, from environmental tracking in harsh conditions to asset visibility across distributed operations. If you are building or upgrading a sensor network for controlled-environment agriculture (or any environment where the data layer determines outcomes), talk to our team.
Frequently Asked Questions
What does LED lighting monitoring mean in a vertical farm?
It means measuring the photons plants actually receive at the canopy (PPFD, DLI, spectrum, uniformity), recording electrical consumption, and using that data to control fixture output and inform business decisions. A timer schedules lights. Monitoring tells you what the plant got and what it cost to deliver.
What is the difference between PPFD and DLI?
PPFD is the instantaneous photon density at the canopy, measured in µmol/m²/s. DLI is the total accumulated over a full day, measured in mol/m²/day. PPFD is the flow rate; DLI is the daily volume. A low PPFD over a long photoperiod can deliver the same DLI as a high PPFD over fewer hours, but the plant may respond differently to each approach.
How much energy can monitoring realistically save?
One 2025 pilot study reported at least 43% lower LED energy consumption when switching from fixed-hours to DLI-responsive control. Results vary by crop, facility, fixture quality, and how wasteful the baseline was. Well-implemented systems typically deliver 10 to 40% lighting-electricity reductions, with the upper end requiring a particularly inefficient starting point.
Do I need spectral sensors or just quantum sensors?
A calibrated quantum sensor covers PPFD and DLI, which is sufficient for farms running fixed-spectrum white or broad-spectrum LEDs. Multispectral sensors become valuable when running tunable multichannel fixtures, because they detect channel drift and verify recipe accuracy over time.
Is vertical farming still financially viable after high-profile closures?
Some operations are profitable. Others closed despite hundreds of millions in funding. The difference is usually unit economics: electricity price, labor, crop choice, and facility cost. LED monitoring improves operational discipline and reduces waste. It cannot fix a broken cost structure or an unprofitable crop.
Should I build a custom monitoring system or buy a commercial platform?
Both paths work. A Raspberry Pi with multispectral sensors and cloud connectivity can pilot for under 100 euros. A commercial platform adds safety certification, vendor support, zoning, alarms, and integration with climate and irrigation systems. Choose based on scale, uptime requirements, team capabilities, and whether the vendor allows full data export.







 +1 508 292 2210

One Response