

Cultivation alone accounts for 91% of electricity demand and 75% of water consumption in a vertical farm’s lifecycle. That single ratio explains why vertical farming data analytics exists: without a system connecting sensor readings to operational decisions, you are paying premium energy prices for guesswork.
I’ve spent over fifteen years deploying IoT sensor networks across supply chains. Airfreight containers, ocean equipment, ground support fleets. The pattern repeats everywhere: organizations collect data long before they know which decisions that data should change. Vertical farming follows the same script. Sensors on every rack, dashboards nobody acts on, AI pilots that don’t survive contact with a real grow cycle.
The difference is that in a vertical farm, a bad decision doesn’t delay a shipment. It kills a crop.
This is a practical breakdown of what vertical farming data analytics covers, where it earns its keep, where it fails, and how to build the stack so the investment actually protects your margin.
What Vertical Farming Data Analytics Actually Means
Vertical farming data analytics is the practice of collecting, integrating, and analyzing data from sensors, cameras, farm-management records, and equipment controls to improve production decisions in controlled-environment agriculture (CEA). A typical architecture sends sensor data through a gateway to cloud software, where models analyze it and return actionable information to operators.
That definition is clean. Reality is messier. In practice, the term covers five distinct functions, and most farms are stuck on the first two.
| Analytics Layer | Question It Answers | Example in a Vertical Farm |
|---|---|---|
| Descriptive | What happened? | Room 3 averaged 24°C and consumed 412 kWh last week |
| Diagnostic | Why did it happen? | Yield dropped 12% because humidity spiked after a dehumidifier fault |
| Predictive | What will happen? | Based on current growth rates, harvest will be 8% below target by Thursday |
| Prescriptive | What should we do? | Shift lighting to 18/6 cycle in Zone B to close the yield gap |
| Automated | Do it without asking | System adjusts fertigation EC from 1.8 to 2.0 based on leaf color change |
Most vertical farms operate at the descriptive level. They have temperature logs, humidity charts, energy bills. Some reach diagnostic with manual root-cause analysis. Very few have closed the loop from prediction to automated action. The commercial value concentrates in that gap.
For market context: estimates for the global vertical farming market in 2025 range from $5.78 billion to $8.52 billion, depending on which analyst you ask and what they include. That spread tells you something. Even the analysts can’t agree on what counts. What they do agree on is that the software and analytics layer is growing faster than the hardware, because it’s where margin improvement lives.
The Data Stack: From Sensor to Automated Action
The stack has four layers. Skipping any of them creates a bottleneck that no algorithm can fix.
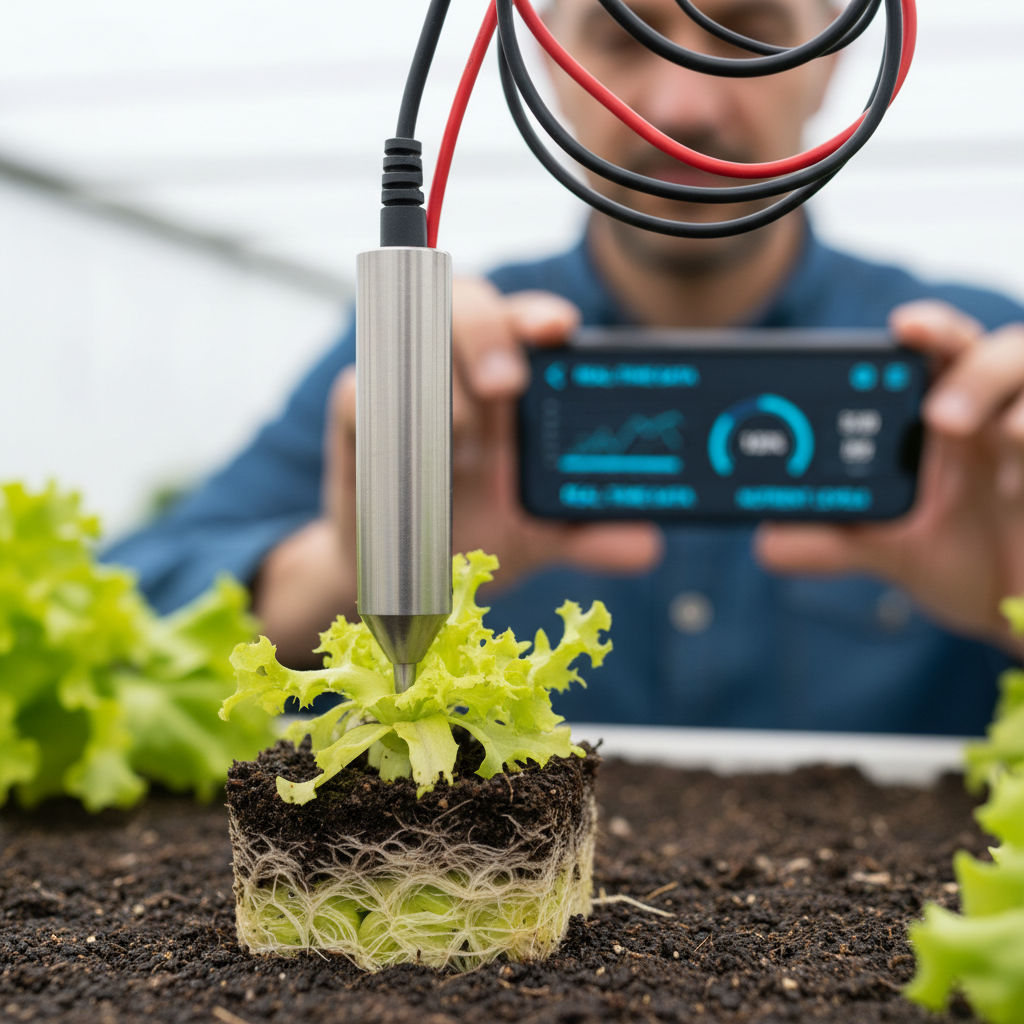
The first layer is physical measurement. Sensors capture temperature, humidity, light intensity and spectrum, CO2, pH, electrical conductivity, water level, nutrient concentration, flow, equipment state, and energy use. In hydroponic systems, pH, EC, humidity, light, and temperature are especially important for crop quality. Cameras add plant-level observations: size, color, morphology, disease symptoms, growth stage, harvest readiness.
The second layer is connectivity. Sensors transmit data to gateways, which aggregate readings from different protocols and can preprocess data at the edge before forwarding to cloud software. This is where most farms hit their first real problem. Humidity in grow rooms degrades wireless signals. Metal racking creates dead zones. A sensor that reports every five minutes in a test lab may lose half its readings in a production environment.
The third layer is context. Raw telemetry without it is noise. Crop variety, seeding date, room, rack, zone, recipe, operator actions, harvest weight, waste, sales demand: all of this must be joined to your sensor data. This principle applies across controlled-environment agriculture systems, from vertical farms to aquaculture data management. Without context, a model can detect a correlation between temperature and yield, but it cannot tell you whether the operator who adjusted the thermostat at 3 AM caused the improvement or the problem.
The fourth layer is analytics and action. Descriptive becomes predictive, then prescriptive, then automated. The value scales with confidence. Descriptive analytics is cheap but passive. Automated control is powerful but requires validated models, fail-safes, and the ability for a human to override at any moment.
Four Places Analytics Protects Margin
Not all analytics are worth the investment. Some generate insights nobody acts on. Others change one decision that pays for the entire platform. Here are the four areas where vertical farming data analytics consistently moves the needle.
Energy optimization
Energy is where margins go to die. In a modular vertical farm study, electricity contributed 42% to 62% of lettuce greenhouse-gas emissions and 38% to 58% for basil. A separate lifecycle assessment found that switching from UK average grid electricity to renewables dropped climate impact from 4.32 to 0.74 kg CO2-equivalent per kilogram of lettuce.
Analytics can coordinate lighting schedules, HVAC, dehumidification, ventilation, and heat recovery to minimize energy per kilogram of output. A 2026 Canadian study modeled an operating indoor hydroponic farm and estimated a 14.34% average energy consumption reduction from optimized ventilation alone. The model also identified at least 600 MJ of daily waste heat available for recovery.
Energy analytics is not a nice-to-have. It is the difference between a viable operation and an expensive science project.
Yield forecasting
Yield forecasting bridges agronomy and revenue. A good forecast combines plant-level observations, crop age, climate execution, historical harvest data, and current orders. It informs labor planning, packaging, transport, inventory, and customer commitments.
The iUNU LUNA and Priva One integration illustrates the current direction: rolling one-to-eight-week forecasts combining climate-execution data with continuous plant-level insights. Earlier visibility reduces harvest peaks and shortages that otherwise arrive too late to adjust.
A buyer should evaluate forecast accuracy by week, crop, zone, and maturity stage. And quantify the cost of both overproduction (waste) and underdelivery (lost contracts). That double-sided cost is the real benchmark, not model accuracy on a test set.
Plant health and disease detection
Computer vision can identify disease symptoms, nutrient stress, growth anomalies, and quality defects before a human scout can inspect every plant. In dense racks, a localized problem can spread quickly or stay hidden behind foliage for days.
The performance numbers look strong in research. One study reported 99% disease-detection accuracy with a DCNN and 98.18% with MobileNet V2 in a hydroponic system, along with power reductions of 82.1% during light regulation. But these are study-specific results under controlled conditions. Lighting variation, camera angle, crop genetics, and disease prevalence in your facility will differ. A model performing well on a balanced research dataset may produce too many false alarms in commercial operation.
The strongest operating model combines automated screening with agronomist review of uncertain or high-impact cases. Full autonomy in disease detection is a goal, not a current reality.
Traceability and operational ERP
Farm ERP connects seed records to rooms, crops, harvests, inventory, orders, and sales. This is the operational backbone that makes analytics auditable: every model output can be traced to a batch, a recipe, a person, an intervention, and a commercial result.
Without traceability, you can’t close the feedback loop. You can’t say “this recipe, in this room, with this light schedule, produced this yield at this quality level for this customer.” And if you can’t say that, your analytics is a hypothesis engine, not a decision system.
At the premium end of the spectrum, Oishii reports that robots analyze 60 billion datapoints annually to harvest indoor-grown berries at peak ripeness. The lesson: analytics generates the highest return where plant-level variation directly affects a premium price. But not every farm operates in that zone, which brings us to the harder question.
What Three Bankruptcies Taught the Industry
If data analytics alone could save a vertical farm, AeroFarms, Plenty, and Bowery would still be operating at full capacity. They are not.
AeroFarms declared bankruptcy in 2023, then reported two profitable quarters by focusing on microgreens, streamlining operations, and selling through Whole Foods and Costco. The turnaround was not about better algorithms. It was about choosing a higher-margin crop and relentlessly cutting energy per plant.
Plenty filed Chapter 11 in March 2025 after raising nearly $1 billion. It emerged in May 2025 with a restructured business. Bowery Farming ceased operations in November 2024, once valued at $2.3 billion.
The pattern is clear. Analytics can optimize an operation, but it cannot fix a crop that costs more to grow than it sells for. It cannot replace adequate capitalization, and it cannot override energy economics that work against you.
The inverse is also instructive. AeroFarms’ turnaround suggests that analytics pointed at the right metrics (energy per plant, margin per SKU, waste per batch) can be the difference between a company that restructures successfully and one that doesn’t come back. Data didn’t save AeroFarms. Data discipline, aimed at the right questions, helped rebuild it.
Architecture Decisions That Change Outcomes
The debates dominating conference panels (edge vs. cloud, deep learning vs. classical ML, build vs. buy) often miss the point. The right answer depends on your facility, your crops, your data quality, and your team.
Edge vs. cloud
Edge processing handles time-sensitive decisions locally: irrigation adjustments, lighting corrections, emergency shutoffs. Cloud processing handles batch analytics, cross-facility comparisons, model training, and long-term forecasting.
The practical answer is both, with local fallback. If your cloud connection drops, your plants don’t stop transpiring. A system that maintains safe climate parameters locally while reconnecting is not a luxury. It is a production requirement.
Grow rooms are hostile RF environments. High humidity, metal racking, dense vegetation, and electrical interference from LED drivers all degrade wireless signals. Test your connectivity under production conditions, not in an empty room with one sensor.
When a regression beats a Transformer
Academic papers push deep learning architectures because that is what gets published. In practice, the quality of your data matters more than the sophistication of your model. A random forest trained on clean, well-labeled data from your specific facility will often outperform a Transformer trained on a generic public dataset.
Deep learning makes clear sense for image-based tasks: plant health classification, growth-stage detection, defect identification. For yield prediction based on climate and nutrient data, simpler models can perform well if the input data is reliable and the features are well-chosen. Research consistently shows that DLI (daily light integral) and CO2 are among the strongest predictors of crop performance. You don’t need a billion parameters to learn that relationship.
Start with the simplest model that gives you actionable accuracy. Upgrade when the data supports it and the marginal improvement justifies the compute cost.
The interoperability problem nobody advertises
Most vertical farms run sensors from multiple vendors, each with its own protocol, data format, time resolution, and API. Integrating them into a single analytics layer is the unglamorous work that determines whether your platform actually functions.
This is not a theoretical concern. I’ve seen it in every IoT deployment across every industry: the first six months are spent not on analytics, but on getting devices to talk to each other and normalizing data into a consistent schema. Choose hardware and software with open APIs and documented data formats. Proprietary lock-in costs more in integration debt than any discount saves upfront.
Cybersecurity Is Crop Insurance
A connected vertical farm is operational technology, not just IT. The risk is not limited to data theft. Bad sensor data can trigger bad climate control, compromised access can alter setpoints, and ransomware can stop irrigation, HVAC, or lighting.
Consider what happens if someone (or something) changes your grow room temperature setpoint by 5°C overnight. Or floods your nutrient tank by overriding a valve. Or locks you out of your control system during a critical harvest window.
The countermeasures are not exotic: network segmentation between IT and OT, least-privilege access to control systems, multifactor authentication, redundant sensors on critical parameters, anomaly detection on setpoint changes, local fallback when cloud connectivity fails, manual overrides that always work, patch management, and model versioning with rollback capability.
As farms become more automated, the attack surface grows. The consequence of a breach becomes biological, not just digital. These controls are production requirements, not IT line items to defer.
Building the Stack in the Right Order
The most common mistake in vertical farming data analytics is starting with AI and working backward. The correct sequence is less exciting but far more effective.
- Establish a system of record. Before you analyze anything, know what you are growing, where, when, for whom, and under what recipe. If your crop records live in spreadsheets and group chats, no analytics platform will save you.
- Instrument the environment. Deploy sensors for temperature, humidity, light, CO2, pH, EC, water level, and energy consumption. Validate readings under real production conditions. Replace sensors that drift or drop data.
- Connect data across zones and business functions. Join sensor telemetry with crop records, harvest data, waste logs, energy bills, and sales orders. This integration step is where most platforms earn or lose their value.
- Validate forecasts against actual outcomes. Run predictive models in shadow mode alongside human decisions. Measure forecast accuracy, false alarm rates, and decision improvement over a minimum of two full crop cycles before trusting automated recommendations.
- Automate high-confidence decisions only. Let the system control lighting schedules and nutrient adjustments where the model has proven reliable. Keep human oversight on decisions with high downside risk: disease response, equipment shutdowns, crop termination.
This sequence works because each step validates the one before it. You can’t predict yield if your sensor data has gaps. You can’t automate if your predictions haven’t been tested. And you can’t test predictions if you don’t have a record of what actually happened.
If you are at step one or two and need reliable environmental sensors that work in harsh indoor conditions, our environmental tracking devices are built for continuous monitoring across temperature, humidity, and related parameters. If your operation is further along and you want to talk through sensor architecture or integration, reach out to our team or email info@datanetiot.com.
Frequently Asked Questions
What is vertical farming data analytics?
It is the collection, integration, and analysis of sensor, camera, and operational data from controlled-environment farms to improve production decisions. It ranges from basic dashboards showing temperature and humidity to automated systems that adjust lighting, irrigation, and nutrients based on predictive models. A typical IoT architecture sends data from sensors through gateways to cloud software, where it is analyzed and returned to operators.
What data should a vertical farm collect first?
Start with temperature, humidity, light intensity, CO2, pH, electrical conductivity, water level, energy consumption, crop identity, planting date, harvest weight, and waste. The minimum useful dataset connects environmental conditions to a specific crop batch and a commercial outcome. Without that connection, analytics remains descriptive at best.
Can AI accurately predict harvest yield?
Yes, when it has sufficient historical data, consistent sensor readings, and crop records. Commercial integrations now offer rolling one-to-eight-week forecasts. Accuracy depends on crop type, data quality, and facility conditions. Validate against actual harvests for at least two crop cycles before using forecasts for labor or customer commitments.
Does vertical farming always use less water and energy than field agriculture?
Not automatically. USDA cites estimates of 80% to 99% less irrigation water in some vertical systems, but notes the comparative water footprint is unknown when heating, cooling, and other uses are included. Energy can dominate lifecycle impact, with electricity contributing 42% to 62% of greenhouse-gas emissions for lettuce in one modular-farm study.
What is the biggest risk in a connected vertical farm?
A cyber or data-integrity incident that becomes a crop loss event. Bad sensor data can trigger wrong climate controls, compromised access can alter setpoints, and ransomware can halt irrigation or HVAC. Network segmentation, redundant sensors, local fallback, and manual overrides are production requirements.
Should I build a custom analytics platform or buy one?
Buy for the system of record, ERP, and standard climate monitoring. Build or customize for crop-specific predictive models that reflect your genetics, recipes, and facility conditions. No off-the-shelf model trained on someone else’s data will match one calibrated to yours. Let the decision follow your crop cycles and measured ROI, not a vendor’s feature roadmap.







 +1 508 292 2210
