

99% of the global population breathes air that exceeds WHO guideline limits. The data proving it exists. Satellites measure it. Ground sensors log it. Government portals publish it. And most of it still ends up in dashboards nobody checks until something has already gone wrong.
Real-time environmental data sounds self-explanatory until you try to build a program around it. Then the questions pile up. How fast is “real-time”? Which variables matter for your operation? How do you know the sensor reading on your screen is accurate right now, not just accurate on install day? And the question that rarely gets asked early enough: what specific decision will this data trigger?
I’ve spent 15+ years helping organizations close the gap between collecting data and acting on it. The pattern I see repeatedly: teams invest in sensors, connect them to a cloud platform, build a beautiful dashboard, and realize six months later that nobody changed a single operational decision because of it. The feed was live. The value wasn’t.
This guide is for operations managers, engineers, and decision-makers who want real-time environmental data to do actual work.
What “Real-Time” Really Means in Environmental Monitoring
There is no universal definition of “real-time” for environmental data. It does not mean instant. It means fast enough to change the decision that depends on it.
For a tsunami warning center, “real-time” means continuous. NOAA’s DART buoys continuously measure water-column height and transmit data by satellite because minutes determine evacuations. For an air-quality alert at a school district, hourly updates may be sufficient. For a cold-chain warehouse monitoring temperature excursions, a five-minute interval with threshold alerts is usually the right cadence.
The variables themselves are broad:
- Air quality: PM2.5, PM10, ozone, nitrogen dioxide, carbon monoxide, sulfur dioxide
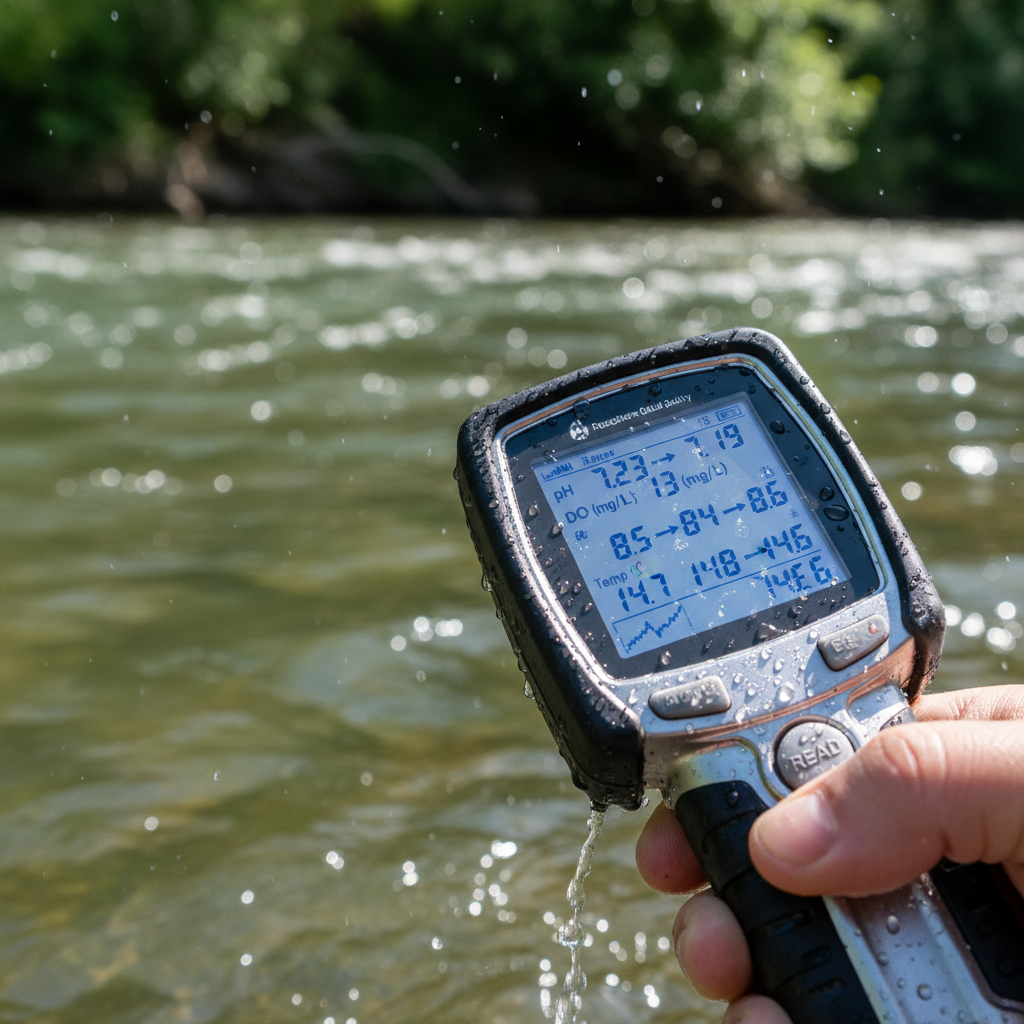
- Water: stream level, flow rate, dissolved oxygen, pH, turbidity, salinity
- Climate and weather: temperature, humidity, barometric pressure, wind speed, precipitation
- Emissions: methane, CO2 concentrations at facility or regional scale, including scope 1 emissions you directly control
- Soil and agriculture: soil moisture, nutrient levels, water table depth
What matters is not the variable alone. It’s the pairing: the right variable, measured at the right frequency, reaching the right person, with enough context to act. A temperature reading every 30 minutes is useless if the alert fires two hours after the cold chain broke.
Why Demand for Environmental Data Is Accelerating
Three forces are converging in 2026. They explain why “real-time environmental data” has moved from a research topic to an operational line item.
Climate pressure is no longer abstract. The WMO confirmed that 2024 was the warmest year in the 175-year observational record, at 1.55°C above the 1850-1900 baseline. Its 2026 update reports that 2015 through 2025 were the eleven warmest years on record, with ocean heat content reaching its highest level since measurements began in 1960. For operations teams, this translates to more heat events, more wildfire smoke, more extreme precipitation, and more regulatory pressure to monitor and respond.
The monitoring market reflects this urgency. MarketsandMarkets projects the environmental monitoring market will grow from $16.1 billion in 2025 to $21.1 billion by 2030. The environmental sensor segment alone is growing at 11% CAGR. Hardware is cheaper. Connectivity is easier. The bottleneck has shifted from “can we collect data?” to “can we trust it and act on it?”
Regulators now expect continuous visibility. Whether it’s emissions reporting, workplace air quality, water discharge permits, or cold-chain compliance for pharmaceuticals, the trend is toward continuous monitoring with auditable records. A quarterly lab report no longer passes in industries where regulators expect near-real-time evidence, and evolving ESG reporting requirements alongside tightening sustainability reporting standards raise the bar further.
The Four Layers Between a Sensor and a Decision
Most real-time environmental programs fail at layer three or four, not layer one. Here is the full stack.
Layer 1: Define the variable and the decision
Before purchasing any hardware, answer two questions. What environmental variable affects your operation? And what will you do differently when you see a specific reading?
If you can’t name the decision, the sensor is a science project. EPA notes that commercial air sensors can measure a wide variety of pollutants, but evaluation has focused primarily on the six criteria pollutants regulated under US ambient standards. Start with what’s regulated or what directly impacts your people, products, or permits.
Layer 2: Observation
This is where hardware enters. Fixed regulatory instruments offer repeatability and reference-grade accuracy. Low-cost IoT sensors offer density and speed of deployment. Mobile instruments sample routes and facilities. Satellites observe broad or remote areas. Each has a different footprint, sampling interval, failure mode, and cost curve.
The Sonoma County wildfire comparison illustrates the tradeoff: one AirNow regulatory station in Sebastopol sat against 359 PurpleAir monitors during the 2020 wildfire season. The single station met reference standards but couldn’t represent PM2.5 conditions across the county. The PurpleAir network revealed neighborhood-level variation but required calibration. Neither alone answered every question.
The practical approach: use public reference data as your baseline, then add calibrated local sensors where conditions vary sharply between locations.
Layer 3: Transport and data management
A sensor that reads accurately but can’t transmit reliably is a fancy thermometer. The transport layer includes cellular, Wi-Fi, LoRaWAN, satellite, or Bluetooth connectivity depending on deployment environment. EPA notes that many sensors require Wi-Fi, cellular, or Bluetooth, and some don’t display readings directly in real time.
On the data management side, interoperability matters more than most teams realize early on. The OGC SensorThings API defines eight linked entities that separate the physical device from the environmental condition it measures: Thing, Location, Datastream, Sensor, Observation, ObservedProperty, FeatureOfInterest, and HistoricalLocation. This prevents a common mistake: treating a sensor ID as if it were the environmental reading itself. Even if you don’t adopt SensorThings directly, the principle holds. Store metadata, units, timestamps, calibration status, and uncertainty as first-class fields in every record.
Layer 4: Analytics, alerting, and action
A useful alert includes a threshold, a persistence rule, a location, an affected asset or population, a confidence level, a recommended action, and an escalation path. AI is entering this layer, compressing multiple feeds into forecasts and impact estimates. But the WMO’s 2025 Congress was explicit: AI should complement, not replace, existing scientific forecasting infrastructure. They also reported that countries with strong early-warning systems see disaster mortality at least six times lower, and 24 hours of advance notice can cut damage by up to 30%.
The engineering target isn’t the most sophisticated model. It’s the shortest trustworthy path from a validated signal to a documented action.
Where Data Quality Breaks Down (and What It Costs You)
This is the part of real-time environmental monitoring that nobody markets. The sensor on the wall looks clean. The dashboard shows green. But the number it’s reporting may be wrong, and you won’t know until something expensive happens.
EPA’s sensor toolbox is blunt about the risks: air sensors can produce systematic bias, be affected by temperature and humidity, drift as gas sensors age, and miss entire data periods. AirNow itself labels its map readings as preliminary and unvalidated. A 2025 review of low-cost air-quality sensor networks identifies cross-sensitivity, drift, standardization gaps, and lower accuracy compared to reference instruments as continuing challenges.
The practical implications:
- Sensor drift is invisible on a dashboard. A temperature sensor that reads 0.5°C high on day one may read 2°C high after six months in a humid environment. Without periodic co-location against a reference instrument, you’re making decisions on corrupted data.
- Calibration isn’t a one-time event. The 2025 review recommends co-location with reference monitors for weeks to months, followed by periodic adaptation of correction models. Transfer calibration (training a model at one site and deploying at another) depends on environmental similarity and degrades over time.
- “No data” is data. AirNow notes that a blank spot on its map means nothing was reported for the most recent hour. In an operational context, silence from a sensor during a critical event is the worst possible outcome. Your system needs to distinguish between “conditions are fine” and “the sensor is offline.”
The Sonoma County case makes this tangible. AirNow’s single regulatory station counted 18 days exceeding the WHO PM2.5 guideline of 15 micrograms per cubic meter during wildfire season. PurpleAir’s 359 sensors counted 34 days. That’s not a calibration footnote. It’s a factor-of-two disagreement on how many days farmworkers were exposed to hazardous air.
Density without calibration gives false confidence. Calibration without density misses the exposure. A solid system shows the raw value, the corrected value, the correction date, the reference instrument used, and a confidence indicator. A single number on a screen, presented without context, is not data. It’s a guess with a timestamp.
Real-World Use Cases That Moved the Needle
Theory is useful. Evidence is better. Here are cases where real-time environmental data changed an outcome, not just filled a report.
School district air quality in Los Angeles
LA Unified School District’s Know Your Air network deploys over 200 sensors across a 710-plus-square-mile district serving more than 1,400 schools and 500,000 students. This connects air-quality readings directly to school-day decisions: when to keep kids indoors, when to modify outdoor activities, when to communicate with parents. The sensors don’t sit in a database. They trigger protocols.
Mining compliance at Kansanshi
First Quantum Minerals’ Kansanshi Mine shifted from daily manual air-quality collection to continuous 24/7 sensor monitoring. The reported result: 80% reduction in maintenance time. But the deeper value is auditability. When a regulator asks for emissions data, continuous timestamped records beat a clipboard with daily readings.
Water operations across the US
USGS operates more than 13,500 real-time water monitoring locations backed by 135-plus years of water data. Their REST APIs and code-friendly access (R and Python packages) make this public infrastructure that any organization can build on. For flood management, reservoir operations, and emergency response, the combination of real-time levels, weather data, and forecast models creates a decision window that periodic manual gauging never could.
Ocean monitoring by NOAA’s buoy network
NOAA’s buoy network illustrates how the same architecture serves wildly different decisions. MAPCO2 buoys at Cheeca Rocks measure pH, dissolved CO2, temperature, and salinity every three hours for ocean acidification research. Sixteen ReCON buoys in the Great Lakes track wave height, dissolved oxygen, and chlorophyll for recreation safety and drinking-water intake protection. DART buoys transmit continuous water-column data for tsunami warnings. Same architecture: instrument, telemetry, quality control, interpretation, action. Different variables, latencies, and stakes.
Community sovereignty for the Quinault Indian Nation
The Quinault Indian Nation deployed four air-quality sensors for 4,500 tribal members to build its own monitoring program. The value isn’t just the data. It’s ownership. When a community controls its own environmental measurements, it can independently verify (or challenge) external claims about local conditions.
How to Build a Monitoring Program That Works
After watching organizations succeed and fail at this, here’s the sequence that actually produces results.
Start with one decision and one measurable outcome. Not “monitor the environment.” Something concrete: reduce worker smoke exposure events by 50%. Detect cold-chain excursions within 10 minutes. Verify discharge water meets permit pH limits continuously. The decision defines the variable, the latency, the spatial resolution, and the accuracy requirement.
Anchor to public reference data. Before buying any hardware, inventory what’s already available for free. USGS provides machine-readable water data. AirNow publishes real-time air quality. NOAA makes over 25 petabytes of atmospheric, coastal, oceanic, and geophysical data available. These are your baselines. Build on top of them.
Add local density where conditions vary. If your warehouse has three climate zones and one sensor, you have one-third of the picture. If your port has wind patterns that shift PM2.5 exposure from berth to berth, a single monitor at the main gate doesn’t protect workers at the far end. The Sonoma County study made this clear: one station, 359 data gaps.
Design for maintenance from day one. Sensors degrade. Batteries die. Connectivity drops. Build in a maintenance schedule, a calibration protocol, and a clear process for flagging degraded readings. If the only alert you’ve designed is “threshold exceeded,” you’ll never know when the sensor itself is the problem.
Make uncertainty visible. Show the raw value, the corrected value, and the confidence level. Don’t present a single number as truth. The organizations that build trust with regulators, communities, and their own teams are the ones that say: here’s what we measured, here’s our confidence, and here’s what we did about it.
Pilot, then scale. Run a 90-day pilot with a small sensor deployment covering one decision. Prove that the alert changes behavior. Prove that the data holds up against a reference. Then expand. The worst deployment is 500 sensors on day one with no calibration plan and no defined response protocol.
What’s Coming Next in Environmental Monitoring
Several trends are reshaping this space right now, and they’re worth tracking if you’re planning a program.
Sensor fusion and automated validation. The 2025 low-cost-sensor review recommends unified performance metrics, integration with air-quality models and satellite observations, and automated validation using satellite inputs. The near-term winner will be a network that knows when its own readings are unreliable and flags them automatically, instead of serving bad data with a green checkmark.
AI-assisted nowcasting. AI is compressing the gap between “what is happening” and “what will happen in the next two hours.” WMO endorses this direction but insists on physical observations, human review, and open data practices alongside it. The practical implication: invest in AI as an acceleration layer on top of solid observations, not as a replacement for them.
Satellite-ground integration. Satellite systems for atmospheric and emissions monitoring (from Copernicus, GHGSat, Carbon Mapper, and Planet, among others) are increasingly useful for regional and facility-level coverage. They won’t eliminate ground sensors. They make ground measurements more strategic by identifying where to verify or intervene first.
Environmental justice through better siting. Dense monitoring is also a justice issue. Communities that lack sensors lack evidence. Programs that publish siting logic, underserved-area coverage, and maintenance responsibility are building credibility alongside operational capability. The Quinault and LAUSD cases point in this direction.
The strongest monitoring programs over the next several years will combine in-situ observations, mobile and satellite sensing, models, and workflow automation. The defensible asset won’t be the prettiest dashboard. It will be a provenance-rich data layer that can answer five questions for every alert: what was measured, where, when, by which method, and what action followed.
At Datanet IoT Solutions, environmental monitoring is one of our core verticals. We deploy temperature, humidity, soil, and water sensors across terrestrial and maritime environments, with end-to-end integration from hardware selection through data delivery and alerting. If your monitoring program collects data but doesn’t drive decisions, that’s the gap we close. Reach out to our team or email us at info@datanetiot.com.

Frequently Asked Questions
What counts as “real-time” in environmental data?
There is no universal latency threshold. Real-time means data delivered fast enough for the decision at hand. For tsunami detection, that’s continuous satellite transmission. For air-quality alerts, hourly updates may suffice. For cold-chain monitoring, five-minute intervals with threshold alerts are typical. Define the decision first, then define the refresh rate.
Are low-cost IoT sensors accurate enough for compliance?
It depends on the application and the calibration program. EPA warns that air sensors can show systematic bias, drift, and sensitivity to temperature or humidity. Co-location with reference instruments and periodic recalibration can improve accuracy significantly. For regulatory compliance, verify that your sensor and calibration protocol meet the specific standard your authority requires before relying on readings as evidence.
What public environmental data sources are available for free?
Several large-scale networks publish free, machine-readable data. USGS provides real-time water data from over 13,500 locations. NOAA publishes atmospheric, oceanic, and coastal data totaling over 25 petabytes. EPA’s AirNow provides real-time AQI and monitor-level readings. NASA Earthdata offers near-real-time satellite observations. These public baselines should anchor any monitoring program before proprietary sensors are added.
How does sensor drift affect environmental readings over time?
Drift means the instrument’s output gradually shifts from true values due to aging, fouling, or environmental exposure. A 2025 review of low-cost sensor networks identifies drift as a persistent concern that requires regular co-location with reference instruments and periodic recalibration. Without a maintenance protocol, a “real-time” reading may be consistently wrong for weeks or months before anyone notices.
Can satellite data replace ground-based environmental sensors?
No. Satellites and ground sensors answer different questions. Satellites excel at broad geographic coverage, plume detection, and monitoring remote areas. Ground sensors provide point-specific accuracy at higher temporal resolution. The strongest programs use satellites to identify where to focus ground-based verification, treating the two as complementary layers rather than substitutes.
How should an organization start a real-time environmental monitoring program?
Start with one decision and one measurable outcome: reduce exposure events, detect a threshold excursion, or verify a permit condition. Define the variable, acceptable latency, spatial resolution, and response owner. Pilot with a small number of sensors, validate against a reference, and prove the alert changes operational behavior. Scale only after the pilot demonstrates that an observation triggers a real action.








 +1 508 292 2210

4 Responses