

In FY2025, EPA conducted over 14,000 compliance-monitoring activities, nearly 8,300 inspections, and secured more than $6.4 billion in commitments to bring facilities back into compliance. Civil penalties alone exceeded $650 million. That was one fiscal year. The year before, penalties topped $1.7 billion.
Environmental compliance monitoring is the system behind those numbers. Not a product. Not a sensor. A system: measurements, records, inspections, investigations, reports, and corrective actions that prove whether a facility meets its permits and legal obligations. If you manage EHS, operations, or environmental programs at an industrial facility, you already know the pressure. What is shifting fast is the infrastructure underneath: electronic reporting deadlines that landed in late 2025, PFAS testing requirements stretching the analyte list, satellites catching methane plumes from orbit, and IoT sensors filling the blind spots between quarterly lab samples.
This article covers the full stack. Regulatory framework. Monitoring methods. Evidence chains. Recent rule changes. And the technology layer that the conversation around compliance monitoring has been slow to address.
What Environmental Compliance Monitoring Actually Means
EPA defines compliance monitoring as all means used to determine whether regulated entities obey environmental law: inspections, investigations, record reviews, reports, samples, interviews, off-site data analysis, and public complaints. The definition is deliberately broad. It is not limited to sensor readings or lab reports.
This matters because many organizations treat “monitoring” as a hardware problem. Buy the analyzer, collect the reading, file the report. In practice, compliance monitoring is a control-and-evidence system. The sensor is one link in a chain that runs from the permit clause through calibration, sampling, calculation, data review, corrective action, and report submission. Break any link and the data loses its legal weight.
EPA and its state, Tribal, and local partners operate 44 regulatory programs authorized by seven environmental statutes. The agency’s stated goals include documenting compliance status, building enforcement evidence, monitoring consent decrees, creating deterrence, and feeding implementation problems back to rule writers. That last one is telling: monitoring data does not only judge your facility. It reshapes the rules that future facilities operate under.
The controlling unit of compliance monitoring is not “the environment” in the abstract. It is the specific facility, specific permit, specific pollutant, specific measurement method, specific frequency, specific limit, and specific reporting deadline. Generic checklists are starting points, not programs.
The Regulatory Stack: Laws, Agencies, and Permits
The US regulatory framework was built in layers over decades. Each statute addressed a different medium or problem, and monitoring obligations reflect that history.
Seven federal statutes carry compliance-monitoring authority. The Clean Air Act evolved from 1955 legislation through the landmark 1970 law and 1990 amendments, authorizing NAAQS, state implementation plans, NSPS, NESHAPs, and Title V permitting. The Clean Water Act traces to the 1948 Federal Water Pollution Control Act and its sweeping 1972 amendments, which created the NPDES permit system for point-source discharges. RCRA, passed in 1976, provides cradle-to-grave authority over hazardous waste, from generation through treatment, storage, and disposal. The Safe Drinking Water Act sets maximum contaminant levels and authorizes monitoring programs like UCMR. CERCLA governs Superfund cleanups. TSCA regulates chemical substances. FIFRA covers pesticides.
Federal statutes set the framework. State and local agencies often hold delegated authority to implement and enforce programs. But for any individual facility, the permit is the controlling document: it specifies what must be measured, how, how often, and by when results must be reported. Two plants running identical processes in different states may face different monitoring methods, reporting formats, and deadlines. Software templates and national checklists are starting points. The permit is the truth.
Five Monitoring Approaches and Their Trade-Offs
No single monitoring method covers every compliance obligation. The practical question is which method fits which obligation and what evidence each produces.
| Approach | Best Use | Strength | Main Trade-Off |
|---|---|---|---|
| Periodic laboratory sampling | Water, soil, waste characterization, analytes without reliable online sensors | High analytical specificity and legally defensible records | Sparse in time; misses short-lived excursions between samples |
| Continuous emission monitoring (CEMS) | Regulated stacks, online wastewater parameters | Near-real-time detection; supports continuous compliance determinations | Capital cost, calibration burden, downtime management, rule-specific QA |
| IoT and distributed sensors | Fence-line, stormwater, facility conditions, ambient screening | Dense spatial and temporal coverage at lower per-unit cost | Requires validation against reference methods; drift control essential |
| Satellite and aerial remote sensing | Methane and CO2 plume detection, regional emissions, inaccessible sites | Wide-area discovery and independent verification | Source attribution needs ground-truthing; legal acceptance still evolving |
| EHS compliance software | Obligation tracking, permit management, calculations, workflows, reporting | Scales governance across multiple facilities; preserves audit trails | Cannot fix invalid measurements or incorrect legal interpretations |
CEMS: More Than a Sensor
EPA defines a CEMS as the total equipment used to determine gas or particulate concentration or emission rate, including analyzers plus the conversion system that produces results in emission-limit units. CEMS are required under some regulations for continuous compliance or exceedance determinations.
The quality assurance layer is not optional. EPA uses performance specifications to evaluate CEMS at installation and 40 CFR Part 60 Appendix F QA procedures to assess ongoing data quality. Purchasing hardware without specifying calibration protocols, validation schedules, downtime handling, and exception documentation is acquiring a liability, not a compliance tool.
IoT Sensors: The Screening Layer Nobody Talks About
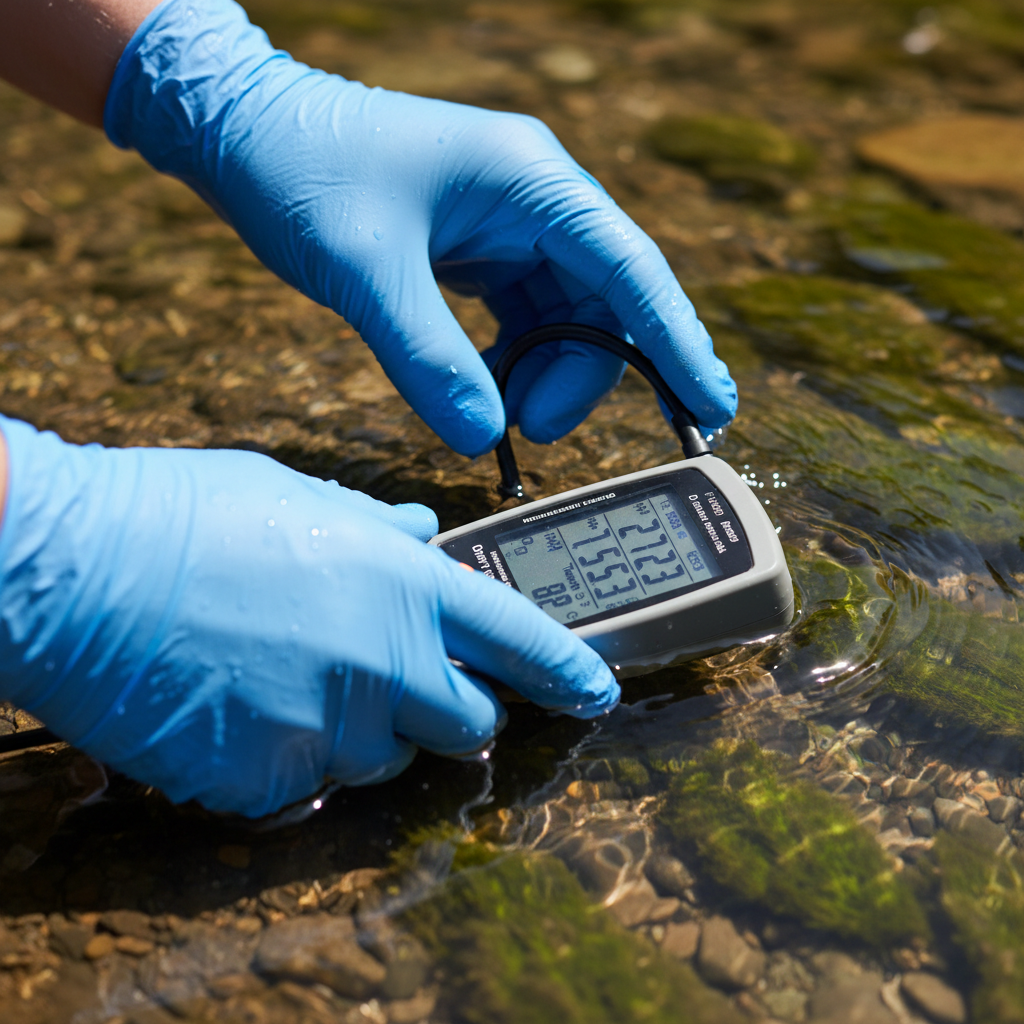
Distributed sensors fill the gap between quarterly lab samples and expensive CEMS installations. Temperature, humidity, water quality, soil conditions, ambient air quality: these can be monitored continuously at a fraction of per-point CEMS cost.
The trade-off is regulatory acceptance. A $200 electrochemical sensor does not carry the same legal weight as a reference-method analyzer or an accredited lab result. But for screening, early warning, trend analysis, and prioritization, IoT devices add visibility that periodic sampling structurally cannot. The same logic drives adoption in sectors like dissolved oxygen monitoring in aquaculture, where continuous readings catch problems long before a scheduled test would—and where remote aquaculture monitoring and fish farm monitoring keep eyes on conditions around the clock. The winning architecture uses legally accepted methods for formal determinations and lower-cost sensors for everything between those determinations. When the screening sensor flags an anomaly at 2 a.m. on a Tuesday, you investigate before the quarterly sample confirms a violation.
The Evidence Chain: Where Most Programs Break
A monitoring program is only as strong as its weakest evidentiary link. The most common failure is not missing a reading. It is producing data that cannot be traced, validated, or explained under scrutiny.
Data Without Provenance Is Not Evidence
EPA’s QAPP guidance requires organizations to connect each measurement to the decision it supports, the sampling design, methods, equipment, QA/QC, data review, acceptance criteria, and records. A dashboard showing green lights across your facility is comforting. It is not equivalent to a validated record. If an inspector asks how a number was generated, what calibration standard was used, who reviewed the result, and what happened when a reading crossed a threshold, the answer needs to exist in documentation.
Flint: When Monitoring Exists but Governance Fails
The Flint water crisis remains the defining case study for why technical monitoring alone is insufficient. EPA’s Inspector General found that management weaknesses delayed the federal response and recommended stronger oversight of state drinking-water programs. The samples existed. The elevated lead readings existed. What failed was authority, escalation, risk communication, and independent review.
Flint now reports a 90th-percentile lead level of 10 ppb against a 15-ppb action level, more than 97% of service lines replaced, and six continuous water-quality monitoring stations. That recovery took years, hundreds of millions of dollars, and institutional reform. The lesson is not “get better sensors.” The lesson is that sensors without governance, escalation authority, and transparent communication produce data that nobody acts on in time.
Marathon Oil: Measurement Converts to Liability
On the enforcement side, the Marathon Oil settlement illustrates the other direction: when monitoring data reveals problems and regulators act. The FY2024 settlement required a $64.5 million civil penalty and was projected to reduce nearly 2.25 million tons of CO2-equivalent methane over five years. Measurement did not prevent the violation. But measurement quantified the violation precisely enough to drive a specific, enforceable outcome. That is the function of compliance monitoring at its sharpest.
Coal Ash: 775 Units, 36 Assessed
EPA estimates approximately 300 regulated coal facilities contain about 775 coal-ash surface impoundments and landfills. In FY2025, the agency assessed 36 units. The arithmetic is plain: facilities cannot rely on inspection frequency for assurance. Self-monitoring with credible data, documented protocols, and a corrective-action loop that does not wait for the next inspector is the only operational strategy.
What Changed in 2025 (and What Hits Next)
Several regulatory deadlines converged in late 2025. Their downstream effects are still unfolding.
Electronic Reporting Becomes the Baseline
NPDES Phase 2 electronic reporting generally reached its December 21, 2025 deadline. Discharge Monitoring Reports, Notices of Intent, No Exposure Certifications, CAFO reports, MS4 reports, pretreatment reports, and overflow reports are now expected electronically. Data flows through ECHO, improving timeliness, accuracy, and public visibility.
On the waste side, EPA’s e-Manifest Third Rule integrated hazardous-waste export manifests and related reports into the electronic system starting December 1, 2025. The chain of custody from generator to destination now has a digital backbone.
If your compliance data still lives in emailed spreadsheets, the gap between your workflow and the regulatory expectation is widening every quarter.
PFAS Expands the Analyte List
UCMR 5 covers 30 contaminants (29 PFAS plus lithium), with sampling running from 2023 through 2025 across large public water systems and a representative sample of 800 smaller systems. EPA also published a January 2025 final rule allowing EPA Method 537.1 version 1.0 for initial PFAS monitoring requirements.
The implication extends well beyond water utilities. Any facility with PFAS in its waste stream, discharge, or air emissions should expect expanding obligations. Systems that hard-code a fixed pollutant list will face rework. Treat analytes, methods, units, reporting limits, and permit thresholds as configurable master data.
Methane Detection Goes Remote
EPA’s Methane Super Emitter Program uses approved satellite, aerial, and mobile monitoring to identify potential releases of at least 100 kilograms per hour, measured by certified third parties. Full implementation has been extended to January 22, 2027, but the detection infrastructure is operational now.
The data supports urgency. A NASA analysis using TROPOMI satellite data found that 2019 US methane emissions were 13% higher than EPA’s estimate. Emissions from 70 high-emitting landfills were 77% higher on median than facility self-reports. Carbon Mapper adds facility-scale methane and CO2 imaging from aircraft and satellites, with data published through a public portal.
For operators, the message is straightforward: third-party eyes in the sky can now flag discrepancies between your reports and observable reality. Self-monitoring accuracy is no longer just an internal quality metric. It is externally verifiable, and increasingly central to ESG compliance that must withstand an audit.
Building a Monitoring Program That Survives an Audit
Most companies start by buying software or sensors. The right starting point is the obligation register.
Map every permit condition to a control. For each facility, catalog every permit, consent order, and regulatory obligation. Map each condition to a measurement method, frequency, responsible person, reporting deadline, and escalation trigger. This is the foundation. Everything else serves it.
Match measurement to legal requirement. Not every parameter needs continuous monitoring. Not every sample needs an accredited lab. The permit and applicable rule specify what counts. Use reference methods where legally required, CEMS where regulations mandate continuous determinations, and distributed sensors for screening and operational awareness.
Build QA/QC before collecting data. Develop or update your Quality Assurance Project Plan before deploying new instruments. Connect each measurement to the decision it supports, the equipment specification, calibration protocol, data review criteria, and records-management policy.
Maintain data lineage from sensor to submission. Every data point should carry provenance: what device generated it, when calibration occurred, who reviewed it, what calculation was applied, when the report was filed. This is not administrative overhead. It is the difference between data and evidence.
Close the loop with corrective action. An exceedance detected but not acted upon is worse than an exceedance not detected, because it demonstrates both the problem and the failure to respond. Document investigation, root cause, corrective action, verification, and timeline. Regulators evaluate not just whether you found the problem, but what you did about it and how fast.
Make data accessible to affected communities. In FY2024, more than 95% of total EPA penalties were assessed at facilities in overburdened and underserved communities. Environmental justice is the enforcement priority, not a side conversation. If residents near your facility cannot interpret your monitoring data, expect increased scrutiny and less goodwill when issues arise.
Continuous Environmental Monitoring and the IoT Layer
The environmental monitoring market is growing at roughly 5.6% to 5.7% annually. Grand View Research estimates $14.4 billion in 2024, reaching $20.1 billion by 2030. MarketsandMarkets places the 2024 figure at $15.33 billion, reaching $21.14 billion by 2030. Methodologies differ but direction agrees: steady, sustained demand across instruments, data services, and software.
A significant share of that growth comes from the shift away from periodic-only monitoring. Not because continuous measurement is always legally required, but because the cost of missing events between quarterly samples keeps climbing. Penalties are higher. Community attention is sharper. Satellites can catch what your own program missed. This principle extends beyond stationary facilities—even cargo monitoring at sea now demands continuous environmental oversight, particularly for hazardous materials transport where gaps in observation create regulatory and safety exposure.
IoT-based environmental sensors (temperature, humidity, water quality, soil moisture, ambient air) are the practical bridge. They deploy in hours, cost a fraction of a CEMS installation, and produce continuous data streams. They do not replace accredited laboratory analysis for formal compliance determinations. They fill the 89 days between quarterly samples with actual observations. When the screening sensor flags a drift at 3 a.m., you investigate before that drift becomes a violation on your next lab report.
The architecture that holds up: IoT sensors for continuous screening and early warning, reference-method instruments for permit-required measurements, and a unified platform recording both streams with full provenance. This is where I see the biggest gap in how most facilities operate today. They have the compliance software. They have the quarterly lab contract. They have nothing in between.
At Datanet, our environmental tracking devices are built to close exactly that gap: field-deployed, continuous monitoring that feeds the evidence chain your compliance program depends on. If your monitoring has blind spots between scheduled samples, that is worth a conversation.

Frequently Asked Questions
What is environmental compliance monitoring?
It is the process of determining whether a regulated facility meets its environmental permits, laws, and standards. EPA’s definition includes inspections, investigations, record reviews, reports, samples, interviews, and public complaints. The goal is not just measurement but evidentiary proof of compliance.
Which US laws typically require environmental monitoring?
Seven core federal statutes carry monitoring authority: the Clean Air Act, Clean Water Act, RCRA, Safe Drinking Water Act, CERCLA, TSCA, and FIFRA. Actual monitoring requirements for a given facility depend on its permits, state and local rules, consent orders, and enforcement history.
Is continuous monitoring always required?
No. CEMS are required under some regulations for continuous compliance or exceedance determinations. Many obligations are met through periodic sampling, laboratory analysis, calculations, or permit-specific reporting. The permit and applicable rule determine the method and frequency.
What makes monitoring data legally defensible?
A documented method, calibrated equipment, QA/QC procedures, qualified reviewer, acceptance criteria, records retention, and a traceable path from the original observation to the submitted report. EPA’s QAPP guidance provides the framework for connecting each measurement to the decision it supports.
How are PFAS regulations changing monitoring requirements?
UCMR 5 added 29 PFAS and lithium to the monitoring list, with sampling through 2025 across public water systems. EPA’s January 2025 rule allowed EPA Method 537.1 for initial monitoring. Facilities with PFAS in any waste stream, discharge, or emission should expect expanding obligations and build systems with configurable analyte lists.
Can satellite data establish a regulatory violation by itself?
Not currently. Remote sensing can identify and prioritize potential emissions events, especially methane, but proving a violation still requires source attribution, quantification, approved methods, and a connection to a specific permit obligation. EPA’s Methane Super Emitter Program (implementation extended to January 2027) defines the emerging framework for using remote-sensing data in enforcement.








 +1 508 292 2210

5 Responses