

The global environmental monitoring technology market sits at roughly $15.3 billion and is heading toward $21 billion by 2030. That is a lot of sensors, platforms, and software. And yet, most deployments I encounter in the field share the same flaw: they confuse buying hardware with building a monitoring system.
A sensor measures a signal. Environmental monitoring technology turns that signal into a defensible, actionable answer. Is this water safe? Is that facility in compliance? Should we reroute this shipment? The distance between “signal” and “answer” is where most projects stall, and where most of that $15 billion gets spent without producing decisions.
If you manage ESG reporting, run industrial operations near sensitive water or air boundaries, or simply need to know whether your environmental data will hold up under regulatory scrutiny, this piece is for you. It covers what the full stack looks like in 2026, where the real trade-offs hide, why calibration matters more than the sensor itself, and how to design a system that closes the loop between measurement and action.
What Environmental Monitoring Technology Actually Includes
Environmental monitoring technology is the combination of instruments, sensors, sampling methods, remote sensing, connected networks, software, and analytics used to measure environmental conditions and support decisions. The EPA frames its technology program around improved regulatory data collection, pollutant-discharge visibility, enforcement, and participatory science.
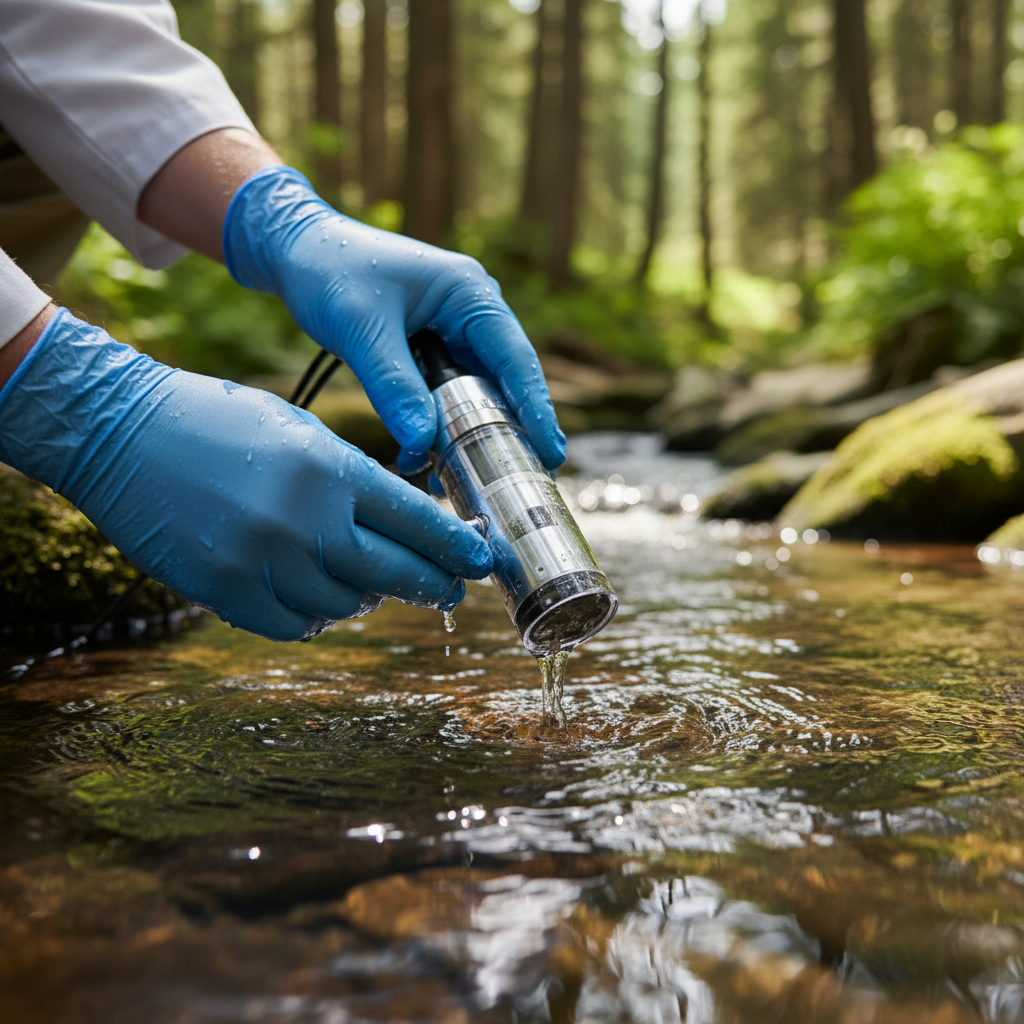
What gets measured spans a wide range: air (PM2.5, PM10, NO2, SO2, O3, CO, methane), water (pH, temperature, dissolved oxygen, turbidity, conductivity, nutrients, PFAS), soil (contamination, moisture, salinity), noise, radiation, and biodiversity. EPA’s Water Sensors Toolbox alone catalogs instruments for pH, temperature, conductivity, dissolved oxygen, turbidity, algae, cyanotoxins, nutrients, and related parameters.
But listing sensors is not the same as designing a monitoring system. The practical stack has six layers, and skipping any one of them downgrades your deployment from “monitoring” to “data collection.”
- The sensing element itself: a physical, chemical, optical, or biological detector. Laser-scattering particle counters for air, electrochemical cells for gases, pH electrodes for water, eDNA samplers for biodiversity.
- Sampling and conditioning: how the sample reaches the sensor. Inlet design, flow control, filtration, preservation protocols.
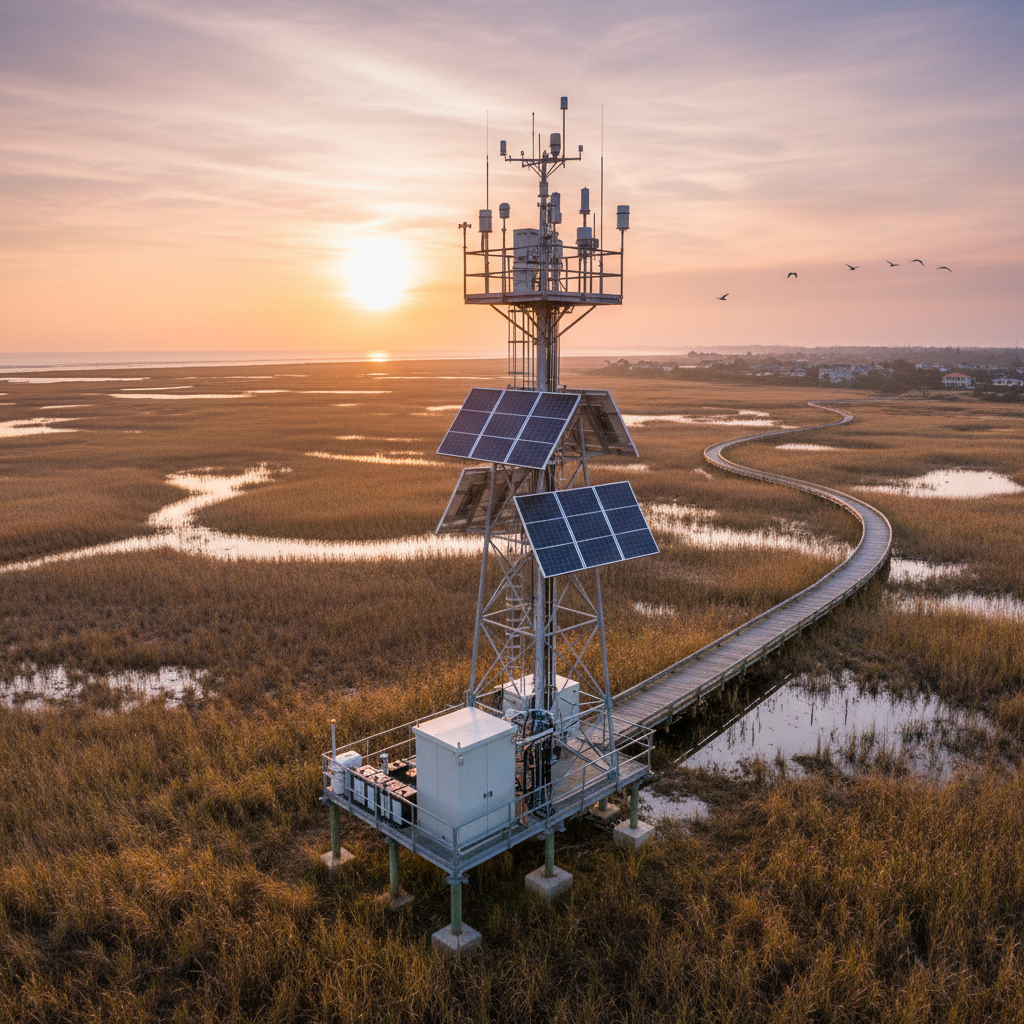
- Communications and power: cellular, LoRa, satellite backhaul, Wi-Fi on the comms side; solar, battery, or mains on the power side. This layer determines where you can deploy and how often you get data.
- Storage and data management: edge processing, cloud ingestion, time-series databases, APIs for integration with enterprise systems.
- Quality assurance and calibration: collocation with reference instruments, correction algorithms, drift detection, metadata management. This is the layer most teams skip.
- Analytics and decision layer: alerts, AI classification, compliance reporting, and escalation workflows. The part that turns a reading into a response.
The most common failure pattern: organizations invest heavily in layers one through four, skip layer five, and barely define layer six. The result is a dashboard full of numbers nobody trusts enough to act on.
The Numbers Driving This Market
Published market estimates converge on steady mid-single-digit growth, though exact figures shift depending on how broadly “environmental monitoring” is defined:
| Source | 2024 Estimate | 2030 Forecast | CAGR |
|---|---|---|---|
| Grand View Research | $14.4B | $20.1B | 5.7% |
| MarketsandMarkets | $15.33B | $21.14B | 5.6% |
| BCC Research (broader sensing scope) | $31.3B | $41.4B | 5.7% |
The variation reflects scope, not disagreement. BCC includes industrial, automotive, and smart-city sensing alongside environmental compliance. The narrower definitions focus on instruments, software, and services tied directly to environmental measurement. Either way, a 5.6% CAGR doesn’t sound dramatic on its own. The demand drivers behind that number are.
WHO reports that 99% of the global population breathes air exceeding its guideline limits. The State of Global Air 2024 report attributes 8.1 million deaths in 2021 to air pollution, including more than 700,000 children under five. Monitoring is not a compliance line item on these terms. It is an exposure-management and public-health tool, and mapping deployments against the WHO guidelines for environmental monitoring keeps that focus explicit.
On the regulatory side, EPA’s PFAS rule requires public water systems to complete initial monitoring by 2027, followed by ongoing compliance cycles. The agency’s Next Generation Compliance program ties monitoring technology directly to enforcement. For industries operating near water, air, or soil boundaries, the regulatory clock is accelerating.
Then there are climate events. Wildfire smoke, methane super-emitters, and extreme weather create recurring demand for data that is more granular, more timely, and more spatially dense than annual surveys or quarterly lab samples. This is the fastest-growing pocket in the market, because the alternative is flying blind during exactly the events that matter most.
Five Monitoring Approaches and Their Real Trade-Offs
There is no universal sensor. There is a spectrum of approaches, each optimized for different combinations of accuracy, coverage, cost, and operational context. The strongest deployments layer several approaches together.
| Approach | Measures Best | Key Strength | Main Trade-Off | Best Role |
|---|---|---|---|---|
| Reference-grade ground monitors | Regulated air pollutants, lab-validated water parameters | Accuracy, traceability, legal defensibility | High capital, limited spatial density, slow to deploy | Compliance anchor, exposure baseline |
| Low-cost sensor networks | PM2.5, PM10, temperature, humidity, basic gases | Dense, real-time, community-accessible | Cross-sensitivity, humidity effects, drift, siting variability | Screening, hotspot discovery, early warning |
| Satellites and airborne remote sensing | Trace gases, aerosols, methane plumes, land cover | Regional-to-global coverage, repeatable | Cloud interference, resolution limits, ground truth required | Context, plume discovery, trend detection |
| Autonomous vehicles and drones | Water-column profiles, gas mapping, habitat imagery | Reaches hazardous, remote, or underwater sites | Battery, navigation, regulation, recovery logistics | Hazardous-site and ecological survey |
| eDNA and bioacoustics | Species presence, pathogen traces, soundscapes | Non-invasive; detects organisms cameras miss | Does not prove abundance, health, or residence | Biodiversity monitoring, conservation |
A few of these deserve closer attention.
NASA’s TEMPO instrument has measured air quality from geostationary orbit since 2023, delivering hourly daytime observations over North America with spatial detail down to a few square miles. Its mission was extended through at least September 2026. Meanwhile, UNEP’s Methane Alert and Response System (MARS) became fully operational in January 2024, combining more than 30 satellite instruments with AI models to issue actionable methane alerts to governments and operators. Satellite coverage is getting better fast. It still cannot replace a sensor at breathing height or a water probe inside a treatment plant.
On the biological side, environmental DNA (eDNA) lets teams detect endangered species, study climate impacts, and identify pathogens from a single water sample. Paired with autonomous drones for accessing remote terrain, eDNA expands what “environmental monitoring” means beyond chemistry and physics into ecology and conservation. The caveat: detecting a species’ genetic trace does not automatically mean a healthy population lives there. Inference still requires careful sampling design and domain expertise.
In August 2024, USGS described work to expand its JaiaBot autonomous underwater platform with dissolved-oxygen, pH, and fluorescence sensors. A micro-AUV making repeated observations in water that is unsafe for human surveyors is a capability that did not exist at scale five years ago, and the same probes underpin dissolved oxygen monitoring in aquaculture, broader aquaculture water quality monitoring, fish farm monitoring, and remote aquaculture monitoring. But the value depends entirely on calibration, navigation reliability, and validation against established sampling methods.
The practical takeaway: these are complementary layers, not competing alternatives. Reference instruments anchor your measurement. Dense sensors fill spatial gaps. Satellites provide regional context. Autonomous platforms reach what people cannot. And biological methods reveal what no chemical sensor can detect.
Why Calibration Is the Actual Product
This is where most environmental monitoring projects quietly fail.
PurpleAir operates a network of more than 35,000 air-quality sensors in over 100 countries, providing real-time PM2.5 readings on a public map. It is also, in raw form, frequently inaccurate. The sensors use Plantower PMS5003 laser-scattering detectors. They correlate strongly with reference instruments but can overreport PM2.5 by a factor of two in high-humidity conditions. A U.S.-wide correction equation developed by EPA researchers achieved an RMSE of 3 micrograms per cubic meter and maintained a linear wildfire-smoke response up to 200 µg/m³.
That correction made the data useful enough for a major public deployment. EPA and more than 30 state, local, and tribal agencies tested PurpleAir sensors at over 70 locations, developed the correction equation, and incorporated corrected data into the AirNow Fire and Smoke Map. The map has logged over 24 million visits and draws on nearly 13,000 sensors. In 2022, Google Maps started using the same correction, placing nationwide PurpleAir data beside government AQI readings.
This is how environmental monitoring technology is supposed to work: raw data from an affordable network, corrected by independent research, validated against reference instruments, then surfaced through platforms people trust. But reaching that point took years, dozens of agencies, peer-reviewed science, and continuous quality-control protocols. The sensor alone was never the product. The calibration pipeline was.
And calibration has limits. The PurpleAir study did not specifically evaluate sensor aging and drift. Dust can be underestimated. Conditions absent from the training data may produce errors the correction cannot catch. Calibration is not a one-time procurement checkbox. It is an ongoing operational commitment.
The hardest version of this lesson comes from Flint, Michigan. The city had monitoring infrastructure. It had data. It also had corrosive water, inadequate treatment, lead leaching, governance failures, and delayed recognition. A task force concluded that Flint residents were needlessly and tragically exposed to toxic lead and other hazards. The sensors existed. The institutional system to act on the data did not.
Monitoring without accountability is a record of harm, not a system of protection.
Designing a Monitoring System That Produces Decisions
Before you evaluate a single sensor, answer five questions:
- What specific decision will this data change? (If the answer is “we’ll have better visibility,” keep pushing. Visibility without a trigger is a screensaver.)
- What is the acceptable measurement uncertainty for that decision?
- Who is accountable for acting when a threshold is crossed?
- How will you verify sensor data against a reference method?
- What happens when the network goes offline?
If any of those questions draw a blank, you are not ready to buy hardware. You are ready to define requirements.
Once requirements are clear, the architecture follows a layered model:
- Reference instruments or laboratory analysis as your measurement anchor.
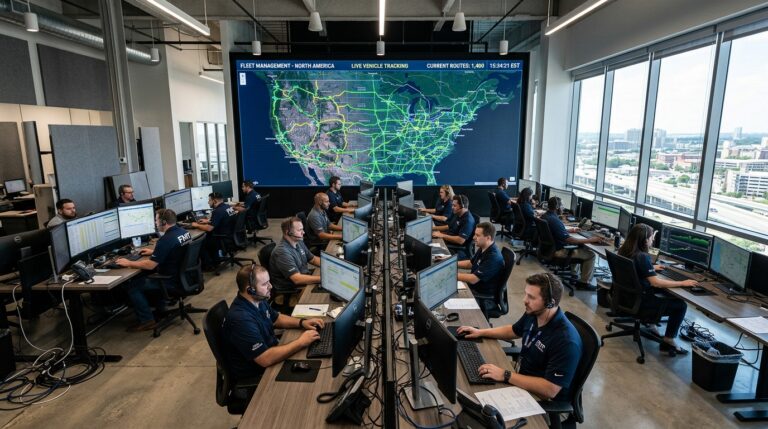
- Dense connected sensors for spatial and temporal coverage, especially in distributed operations. Cellular-connected wireless environmental monitoring trackers that report temperature, humidity, and other conditions from the field work well here, particularly when readings need to be tied to specific assets, containers, or locations across a logistics network.
- Satellite data for regional context, plume detection, and long-term trend analysis.
- AI for anomaly detection, sensor-fault identification, source attribution, and action prioritization.
- A human escalation path for readings the model cannot explain or situations that require judgment.
Two governance dimensions that routinely get overlooked in procurement:
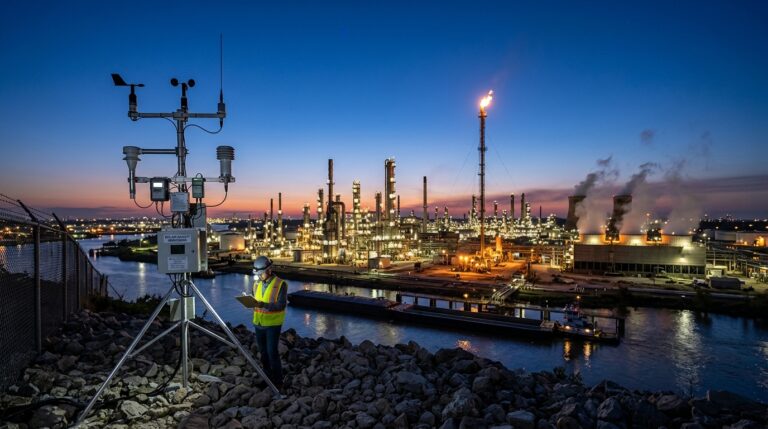
EPA is explicit that ISO 14001 is not a technical standard and does not replace requirements in statutes or regulations. Certification demonstrates you have an environmental management framework. It does not prove your measurements are valid or that your facility meets specific compliance thresholds. Treating certification as a substitute for defensible measurement is a common and expensive error. A 2024 review found that 82% of ports have adopted water-quality monitoring; the question for those ports is whether the data they collect would survive an audit, not just whether a sensor is installed.
Then there is cybersecurity. Every connected sensor expands the attack surface, and environmental IoT raises data-protection concerns that become especially acute when monitoring feeds operational controls or public health alerts. An attacker who manipulates an air-quality reading could mask illegal emissions. An attacker who spoofs water-quality data could delay treatment responses. Version control, access logging, encryption, and offline fallback belong in the system design from day one.
What’s Shifting Right Now
Several developments over the last 18 months are changing both what monitoring systems can do and what regulators expect them to deliver.
| Trend | What’s Happening | What It Means for You |
|---|---|---|
| Satellite expansion | TEMPO extended through September 2026 (hourly daytime air quality over North America). MARS uses 30+ instruments with AI for global methane alerts. | Regional context is cheaper and more current than ever. Still needs ground validation for compliance decisions. |
| AI and remote sensing fusion | A 2025 review documents AI integration across air quality, biodiversity, water, agriculture, and urban monitoring. | Automated classification and forecasting are maturing. Budget for model validation, labeled training data, and explainability. |
| Digital twins | A 2025 environmental-health brief connects IoT sensors, wildfire surveillance, and weather data in continuously updated models. | A twin can test scenarios before committing resources. It can also make a weak sensor layer look authoritative. Demand uncertainty disclosure. |
| PFAS deadlines | EPA requires public water systems to complete initial PFAS monitoring by 2027. | Sampling plans, laboratory capacity, and treatment decisions need to be in motion now. |
| Sensor standardization | EPA released supplemental 2024 reports covering PM10 and gas-phase sensor performance targets. | More comparable procurement. Performance targets narrow the range, but they are not a guarantee of field accuracy. |
| Open data infrastructure | NASA Earthdata provides open access to Earth-science data collections. EPA defines acceptance protocols for new sensor networks. | Combining public, commercial, and community data is possible. Provenance, licensing, and schema alignment take real work. |
The direction is clear: tiered, continuously calibrated systems where inexpensive nodes screen and localize, reference instruments anchor, satellites contextualize, AI prioritizes, and humans decide. The organizations building this architecture (rather than buying point solutions and hoping they converge) will produce better data, faster compliance, and fewer blind spots. The same principles apply when scaling environmental monitoring for agriculture, where field conditions demand exactly this layered approach, and they extend into controlled-environment systems like vertical farming technology.
If your operations involve tracking environmental conditions across distributed assets, whether in ports, freight corridors, warehouses, or industrial facilities, the monitoring challenge comes down to the same thing: reliable field data, transmitted in real time, tied to the specific location or asset that matters. This is the core of effective remote environmental monitoring. Turning that stream into real-time environmental data that drives decisions is exactly the space we work in at Datanet. Our environmental tracking devices are built for this problem, and we design end-to-end systems that match sensor hardware to your operational reality. Talk to us if you want to see how that works in practice.
Frequently Asked Questions
What is environmental monitoring technology?
It is the combination of sensors, instruments, sampling methods, remote sensing, networks, software, and analytics used to measure environmental conditions (air, water, soil, noise, biodiversity, emissions) and turn those measurements into decisions. A complete system includes sensing, calibration, data management, quality assurance, and a decision layer that triggers action.
What can environmental sensors measure?
Air sensors commonly measure particulate matter (PM2.5, PM10) and gases (NO2, SO2, O3, CO, methane). Water sensors cover pH, temperature, conductivity, dissolved oxygen, turbidity, nutrients, algae, cyanotoxins, and contaminants like PFAS. Soil sensors track moisture, salinity, and contamination. Biological methods such as eDNA detect species presence from environmental samples.
Are low-cost air sensors accurate enough for compliance?
On their own, generally no. PurpleAir sensors can overreport PM2.5 by a factor of two under certain conditions. With proper collocation, mathematical correction, and quality control, they produce useful supplemental data. EPA uses corrected PurpleAir readings on the AirNow Fire and Smoke Map, but labels them as supplemental information, not regulatory-grade measurements.
When should I choose satellite monitoring over ground sensors?
Satellites excel at regional coverage, plume discovery, trend analysis, and monitoring areas with no ground infrastructure. NASA’s TEMPO provides hourly air-quality data over North America; UNEP’s MARS detects large methane emissions globally. But satellites cannot replace near-source measurements at breathing height or water probes inside treatment systems. Use both as complementary layers.
Does ISO 14001 certification prove environmental compliance?
No. ISO 14001 is an environmental management system standard. EPA states explicitly that it does not replace statutory or regulatory technical requirements. Certification shows you have a management framework in place. It does not validate your measurements or prove your facility meets specific emission or discharge limits.
What is the biggest overlooked risk in environmental monitoring?
Treating measurement as protection without defining who acts on the data. Flint, Michigan had monitoring infrastructure but lacked the governance, treatment protocols, and accountability to protect residents. Every deployment should specify who investigates an alert, who can override a threshold, how uncertainty is communicated, and what happens when the system goes offline.






 +1 508 292 2210

8 Responses