

A harmful algal bloom killed more than 40,000 tonnes of Chilean salmon in 2016, with losses above $800 million. Nearly 12% of the country’s production, gone. The farms had aquaculture water quality monitoring systems in place. Sensors were reading. Fish died anyway. (See also: aquaculture environmental monitoring.)
That gap between collecting a number and preventing a disaster is where monitoring either earns its investment or becomes expensive decoration. Most operations sit closer to the decoration end than they realize.
I run growth at Datanet IoT Solutions, where we deploy environmental and asset tracking sensors across industries that can’t tolerate blind spots. Aquaculture presents the same core problem I see in aviation and cargo monitoring at sea: a high-value biological asset in a variable environment, where profit or catastrophe depends on detection speed and response quality. This guide covers what to measure, how systems actually work, where they fail in the field, and what the shift toward predictive monitoring means for farm operators, engineers, and decision-makers.
What Aquaculture Water Quality Monitoring Actually Covers
The phrase gets used loosely. Some people mean a $200 handheld pH meter. Others mean a $99,000 multiparameter sonde streaming to a cloud dashboard with machine learning. Both can be called “monitoring.” Neither, on its own, is the full picture.
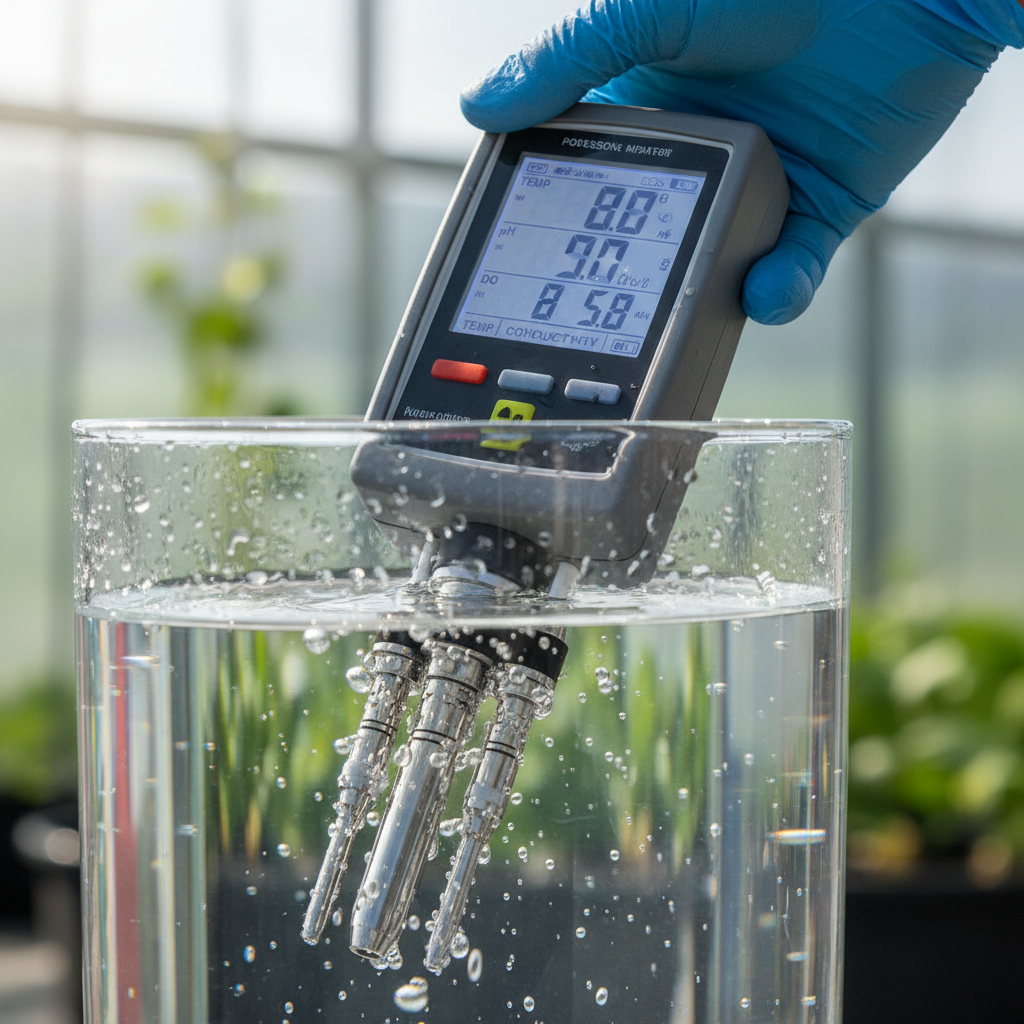
Aquaculture water quality monitoring is the continuous (or near-continuous) measurement, transmission, interpretation, and response to the chemical, physical, and biological conditions of a production environment. The operative word is “response.” A sensor reading 2 mg/L of dissolved oxygen at 3 a.m. with nobody awake to start an aerator is not monitoring. It’s record-keeping.
The scale depending on this distinction is staggering. Global aquaculture produced 130.9 million tonnes worth $312.8 billion in 2022, per FAO data. Farmed aquatic animals reached 94.4 million tonnes, overtaking capture fisheries at 51% of world production. The precision aquaculture market alone was estimated at $850 million in 2025, with projections reaching $1.43 billion by 2030. This is production infrastructure, not an optional sensor project, which is why a well-designed aquaculture monitoring system is a core operational investment.
Yet a review of recirculating aquaculture systems (RAS) monitoring found no universal rule specifying which parameters must be measured. Each operator decides. That means the gap between best-in-class and average is enormous, and the consequences are biological, financial, and regulatory.
The Parameters That Kill Fish, in Priority Order
Not all water quality variables carry equal weight. Some kill in hours. Others degrade performance over weeks. The order you deploy sensors should follow the speed and severity of failure, not the length of a vendor’s spec sheet.
| Parameter | Why It Matters | General Target Range | Failure Speed |
|---|---|---|---|
| Dissolved Oxygen (DO) | Single most important pond-water variable. Fish stop feeding, then die. | 5 to 10 mg/L; stress below 3 to 4 mg/L | Minutes to hours |
| Temperature | Controls oxygen capacity, metabolism, ammonia toxicity, disease pressure. | Species-specific. Water at 11°C holds 40% more O₂ than at 27°C. | Hours to days |
| pH | Determines what fraction of ammonia is toxic. High pH = more un-ionized NH₃. | 6 to 9 for most species | Hours |
| Ammonia (NH₃/NH₄⁺) | Un-ionized NH₃ is extremely toxic. Toxicity rises with pH and temperature simultaneously. | NH₃ below 0.0125 mg/L for salmonids | Hours to days |
| Nitrite (NO₂⁻) | Toxic nitrification intermediate. Blocks oxygen transport in fish blood. | Below 1 mg/L for most freshwater species | Days |
| Salinity / Conductivity | Ionic balance, osmoregulation, species compatibility. | System-specific | Days |
| Turbidity / Solids | Gill damage, light penetration, oxygen demand from decomposition. | System-specific | Days to weeks |
These thresholds come from established pond-management research and peer-reviewed literature. They are guidance, not universal legal limits. Species, life stage, acclimation history, stocking density, and production system all shift the correct set point. Tilapia tolerates CO₂ up to 60 mg/L; salmonids start struggling above 20 mg/L.
The most dangerous misunderstanding is treating these parameters as independent. They interact. A pH of 8.5 is fine when ammonia is low. That same pH becomes lethal if total ammonia nitrogen spikes after heavy feeding, because the fraction of toxic un-ionized NH₃ increases sharply with both pH and temperature. Monitoring one number without the others is like reading airspeed without altitude.
From Sensor to Decision: Five Layers Most Farms Get Wrong
A monitoring system is not a sensor. It’s five linked layers, and the weakest layer determines the value of the entire investment.
The first layer is the aquatic environment itself. Its variability (stratification, currents, feeding cycles, weather, biological load) determines how many sensors you need and where they go. One probe in a 5-hectare pond doesn’t give you “monitoring.” It gives you a single data point in a complex system.
The second layer is sensing hardware. Optical DO, electrochemical pH, thermistors, ion-selective electrodes, turbidity sensors, and laboratory wet chemistry each carry trade-offs in accuracy, speed, cost, and maintenance burden. Optical dissolved-oxygen sensors eliminate membrane conditioning and use replaceable caps with stored calibration coefficients. Online nitrogen analyzers can track biofilter performance in real time. Choosing the right water quality sensors for fish farming depends on this balance, because every sensor becomes a liability if it isn’t cleaned and calibrated.
Third is local processing and communications. Data has to leave the sensor and reach something that can act on it. Recent IoT research describes Wi-Fi for connected facilities, LoRaWAN for long-range low-power links, Bluetooth for short-range setup, and SMS as a fallback where internet access is unreliable. The protocol matters less than reliability. A LoRaWAN node that drops packets during a storm is a design failure, not a connectivity preference.
Fourth is cloud or farm software: dashboards, trend visualization, alarm configuration, historical storage, and reporting. This is where most vendor marketing concentrates, and where most operational value gets lost. A beautiful dashboard with 10,000 data points per day means nothing if nobody configured the alarm thresholds, tested the notification chain, or defined what action follows which alert.
The fifth layer is the one that actually prevents fish kills: human or automated response. When DO drops below 4 mg/L at 3 a.m., does the system text a named person? Does that person have authority to start emergency aeration? Is the aerator tested weekly? Is there a backup? Current IoT systems can activate aerators, heaters, lights, and dosing devices automatically, but few farms automate high-consequence decisions end to end. The reason is sound: a drifting sensor that triggers unnecessary chemical dosing across an entire facility creates its own disaster.
The right approach is staged. First, the system alerts a human. Then it recommends a specific action. Only after local validation (redundant sensors, visual confirmation, plausibility check) should it actuate equipment. Most farms stall at layer four, admiring their data, because layer five requires organizational discipline, not just technology.
Where Monitoring Programs Break Down in Practice
In 15 years of deploying IoT sensors across industries, I’ve seen the same failure modes repeat. Aquaculture adds a few of its own, but the core problems are universal.
Biofouling is the most persistent. Sensors sit in water full of life. Algae, bacteria, and biofilm colonize optical windows, membrane surfaces, and electrode junctions within days. A DO sensor covered in biofilm doesn’t read dissolved oxygen; it reads the oxygen consumption of the biofilm. Reviews consistently identify cleaning and calibration as non-negotiable because constant water contact encourages films that obstruct or degrade sensors. There is no set-and-forget sensor in aquaculture. If your maintenance schedule is “when something looks wrong,” your readings drifted weeks ago.
Calibration drift compounds the problem. Every electrochemical and optical sensor drifts over time. Temperature compensation algorithms help, but they don’t eliminate the need for periodic reference checks. A Malaysian validation study comparing low-cost IoT sensors against a calibrated YSI Professional Plus found 97% accuracy for temperature and 98% for pH, but only 76% for dissolved oxygen and 80% for ammonia. DO was the weakest performer. And DO is the parameter most likely to demand rapid intervention. That should concern anyone relying on a single low-cost probe for life-support decisions.
Alarm fatigue is subtler but equally destructive. Too many alerts, too loosely configured. After the 50th false alarm in a week, the night operator ignores number 51. Number 51 is real. This isn’t a technology problem; it’s a workflow design problem. Alarms should be tiered (informational, action-required, emergency), each with a different notification channel and escalation path.
The most common organizational failure? No named response owner. The alarm fires. Who responds? What’s the first action? Where’s the checklist? How long before escalation? If those questions don’t have written answers posted next to the control panel, the monitoring system is a recording device, not a management tool.
Then there’s the trap of false confidence. Twenty cheap sensors sampling every five minutes create a comforting density of data points. If none of them have been validated against a reference in three months, that data density is an illusion. One accurate instrument at a sentinel location delivers more operational value than a hundred drifting nodes.
Different Production Systems Need Different Monitoring
A shrimp pond in Vietnam, a salmon RAS in Norway, and an offshore cage in Scotland share the need for water quality data. They share almost nothing else. For pond-based operations, shrimp farm monitoring illustrates why sensors alone won’t save a crop.
In open ponds and raceways, spatial variability is the primary challenge. Oxygen, temperature, and pH can differ significantly between inlet, center, and drain of a single pond. Wind, sunlight, algal photosynthesis, and feeding create gradients that one probe can’t capture. The practical solution: multiple low-cost nodes validated against a reference instrument, with aeration triggered by the lowest reading, not the average. For brackish and marine systems, salinity monitoring in aquaculture adds another layer that affects osmoregulation and species compatibility.
Recirculating aquaculture systems shift the focus to biofilter health. Ammonia enters from fish metabolism. Nitrifying bacteria convert it to nitrite, then nitrate. If the biofilter stalls (from pH crash, temperature shock, antibiotic treatment, or overfeeding), ammonia and nitrite spike fast. RAS operations need online nitrogen measurement, tight DO and pH monitoring at the biofilter, and redundancy at vulnerable points. Companies like Aquamonitrix have built products specifically for this gap, offering real-time nitrite and nitrate analysis that reduces manual sampling and accelerates biofilter management.
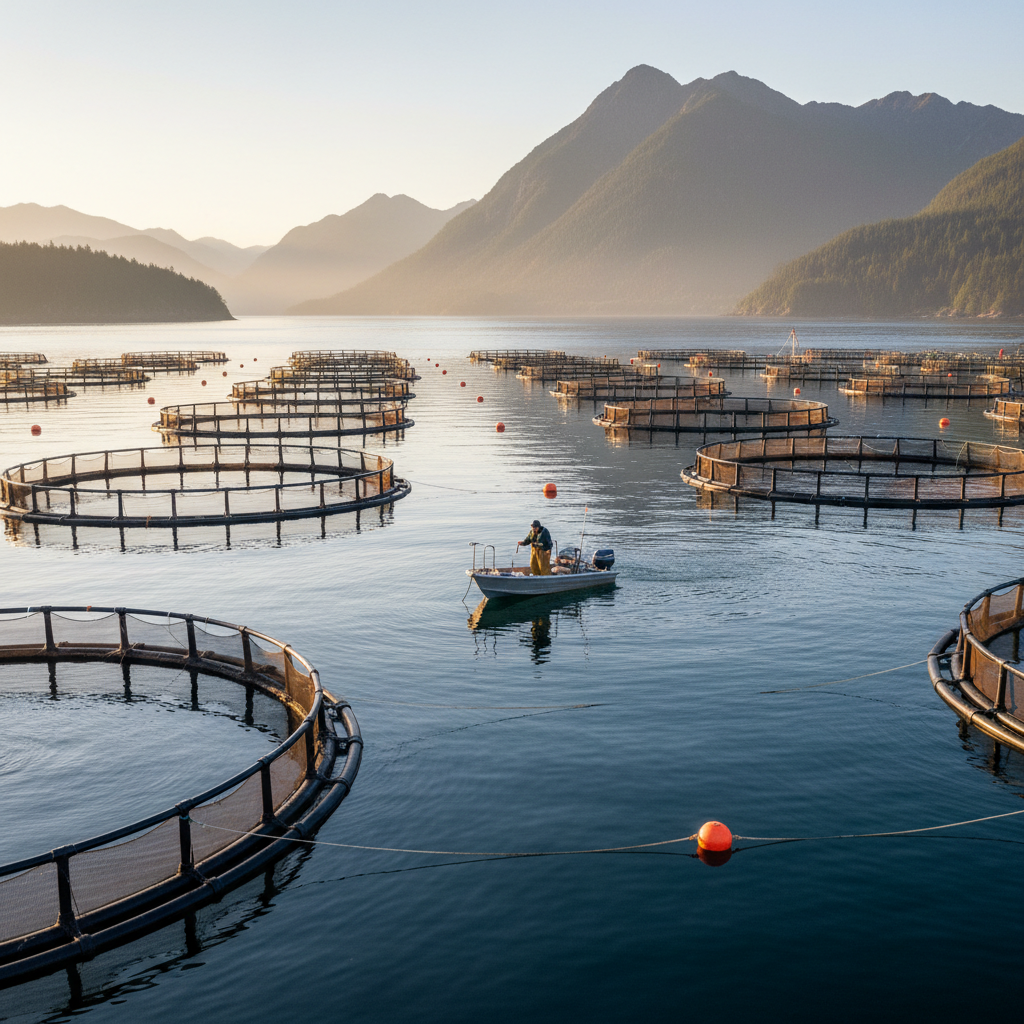
Offshore and coastal cages face a different set of constraints: connectivity, power, corrosion, and environmental unpredictability. Marine sensors encounter saltwater corrosion, wave action, accelerated biofouling, and power limitations from battery or solar operation. But the bigger challenge is context. Local water chemistry alone can’t predict a harmful algal bloom moving in from offshore. A Scotland-wide risk analysis found that bloom risk varies dramatically by region, with the Shetland Islands at highest risk and other areas at very low risk. Effective offshore monitoring combines local sensors with regional phytoplankton data, weather forecasts, current models, and satellite imagery—similar to how air quality monitoring systems integrate multiple environmental data sources for comprehensive analysis.
The strongest architecture for any system is hybrid: trusted reference instruments at critical points, lower-cost distributed nodes for spatial coverage, online analyzers for high-consequence chemistry, and periodic laboratory confirmation. The question is never “which brand has the longest parameter list.” It’s which combination detects your most dangerous failure early enough to act.
What Fish Kills Actually Cost, and What Prevention Is Worth
The economics of monitoring aren’t about the price of sensors. They’re about the cost of what happens without them.
The Chilean bloom destroyed over $800 million in salmon biomass, driven by regional oceanographic conditions that no single farm sensor could have stopped alone. That’s an extreme case. But the asymmetry holds at every scale: the cost of a monitoring failure routinely exceeds the cost of the entire monitoring system by orders of magnitude. Malaysia’s aquaculture sector saw a 50% production drop in 2019 attributed to poor water quality management. On the other end, a Vermont catfish operation documented more than $1 million in savings across a decade through automated environmental controls, including an 83% reduction in propane usage.
The cost spectrum for monitoring technology is enormous. An Arduino-based IoT prototype validated in a Malaysian university hatchery cost an estimated $216. Commercial multiparameter systems run above $99,000. The right answer is neither “go cheap” nor “go expensive.” It’s “go appropriate.” A 10-hectare shrimp pond doesn’t need a $99,000 sonde. A 200-tonne RAS salmon facility can’t rely on a $216 prototype for life-support decisions. The hybrid architecture (reference instruments at critical points, low-cost nodes for coverage, online analyzers where biology demands them) delivers the best cost-to-risk ratio for most operations.
The hidden cost most operators miss is labor. Manual sampling twice a day, by handheld meter, is standard at many farms. Two snapshots out of 1,440 minutes. The other 1,438 minutes are invisible. Continuous monitoring doesn’t eliminate manual checks (you still need reference validation), but it converts labor from data collection to data-informed management. That’s a more productive job.
There’s also the regulatory angle. US EPA rules for concentrated aquatic animal production address effluent limits, feed and waste management, monitoring, and records. European and Asian regulators are moving in the same direction, and sustainability certifications (ASC, BAP, GlobalG.A.P.) demand documented environmental performance. This means platforms need to retain raw readings, calibration history, alarm acknowledgments, maintenance logs, and corrective actions. If your system can show today’s oxygen level but can’t prove what it was six months ago, or what you did when it dropped, you have an operational tool, not a compliance tool. For operations planning to scale, export, or pursue premium certification, building the audit trail into monitoring architecture from day one is far cheaper than retrofitting it later, and sound aquaculture risk management starts well before insurance ever enters the picture.
Predictive Monitoring: eDNA, Digital Twins, and What’s Real Today
The marketing pitch for 2026 is prediction. Don’t just see what happened; know what’s coming. Machine learning models that forecast oxygen crashes. Digital twins that simulate your entire facility. Environmental DNA that spots harmful algae before a bloom forms.
Some of this is real. USGS describes environmental DNA (eDNA) as a method to detect genetic traces in water and provide early warning of harmful algae before blooms become dangerous. That’s a genuine advance for coastal operations where the threat isn’t internal chemistry but external biology. eDNA won’t replace DO or pH sensors. It adds a biological layer that chemistry alone can’t deliver.
Machine learning applications in aquaculture have grown rapidly. A recent review documented a 74.79% increase in aquaculture water-monitoring research between 2020 and 2024. ML models are being applied to feeding optimization, disease detection, behavior analysis, and anomaly prediction. But the same review notes that few systems automate decisions completely and that sensor maintenance remains the limiting factor. A prediction model trained on drifting sensor data produces drifting predictions.
Digital twins (virtual replicas of physical facilities running on real-time sensor data) are the most ambitious concept. They promise scenario simulation: what happens to oxygen if stocking increases 20%? What if the biofilter loses 30% efficiency during a cold snap? The unresolved challenges are data synchronization, model reliability, interoperability between equipment brands, and capital cost. For most farms today, a digital twin is premature. For a 10,000-tonne RAS facility with consistent data infrastructure, the economics may start making sense.
The practical framework is three tiers. You move up only when the previous tier is solid:
- Reliable life-support sensing and alarms. Continuous DO and temperature. pH and ammonia where density demands it. Named response owners. Tested escalation. This tier alone prevents most catastrophic losses.
- Analytics, feeding optimization, cameras, weather and ocean data integration, remote maintenance scheduling. This tier improves efficiency and extends visibility beyond the water surface.
- Validated automated control, digital twins, eDNA, and predictive models. This tier belongs to operations with mature data infrastructure, proven calibration discipline, and the organizational capacity to manage model uncertainty.
Investing in tier three before tier one is solid is how farms end up with impressive dashboards and dead fish.
At Datanet, we build IoT monitoring architectures across industries where asset visibility and environmental data are mission-critical. If your operation needs help designing a sensor-to-decision system that doesn’t break at layer five, talk to our team. You can also explore our environmental tracking solutions for a closer look at the hardware side.
Frequently Asked Questions
Which water quality parameters should an aquaculture farm monitor first?
Dissolved oxygen and temperature. DO is the single most important pond-water variable, and temperature directly affects oxygen capacity, metabolism, and ammonia toxicity. Add pH, total ammonia nitrogen, and nitrite based on species and stocking density. High-biomass RAS needs more frequent nitrogen monitoring than a low-density earthen pond.
How often should water quality be measured?
Continuously for DO and temperature, because they change fast and kill fast. Manual or laboratory testing remains useful for parameters that are expensive to automate (alkalinity, specific ions) or for validating sensor accuracy. The correct frequency follows the speed of change, consequence of failure, and time needed to respond.
Are low-cost IoT sensors accurate enough for commercial aquaculture?
For spatial coverage and screening, yes, when properly calibrated against a reference instrument. A Malaysian validation study achieved 97% accuracy for temperature and 98% for pH, but only 76% for dissolved oxygen. Use low-cost nodes as a coverage layer, not as the sole basis for life-support decisions or regulatory reporting.
Can water quality monitoring prevent all fish kills?
No. Monitoring reduces exposure to stressors and shortens response time, but it cannot guarantee prevention. Harmful algal blooms, disease, equipment failure, and human error can interact in ways no sensor network fully anticipates. Monitoring works when connected to aeration, water exchange, feed control, biofilter management, and a tested emergency plan.
What is the most overlooked issue in monitoring projects?
Data trust. Biofouling, calibration drift, broken communications, poor sensor placement, and unclear response ownership can make a sophisticated dashboard operationally useless. Most monitoring failures aren’t hardware failures. They’re maintenance and workflow failures.
Does AI replace the need for farm staff in water quality management?
Not yet, and not soon for high-consequence decisions. Machine learning identifies outliers, optimizes feeding, and recommends actions. But sensor maintenance, alarm verification, and emergency response still require human judgment. AI should sharpen the operator’s decisions, not replace the operator.








 +1 508 292 2210

4 Responses