

A controlled study pushed Pacific white shrimp to 10 ppt. Mortality hit 53.3%. The sensor reading looked acceptable. The immune suppression, microbiome disruption, and pathogen vulnerability behind that reading did not. That gap between number and condition is the central problem in salinity monitoring in aquaculture.
Most operations measure a value. The animals experience something more complex: ionic balance, rate of change, temperature interaction, pathogen load, and acclimation history, all compressed into a single conductivity reading on a screen. In an industry that produced 103 million tonnes of aquatic animals worth $371 billion at farm gate in 2024, the distance between a number and a condition gets expensive fast.
This article covers what salinity monitoring actually captures, where it falls short, how to choose the right measurement architecture, and where most systems fail in the field. Whether you manage a shrimp pond, salmon cage, RAS facility, or shellfish lease, the logic holds.
What Salinity Monitoring Actually Measures
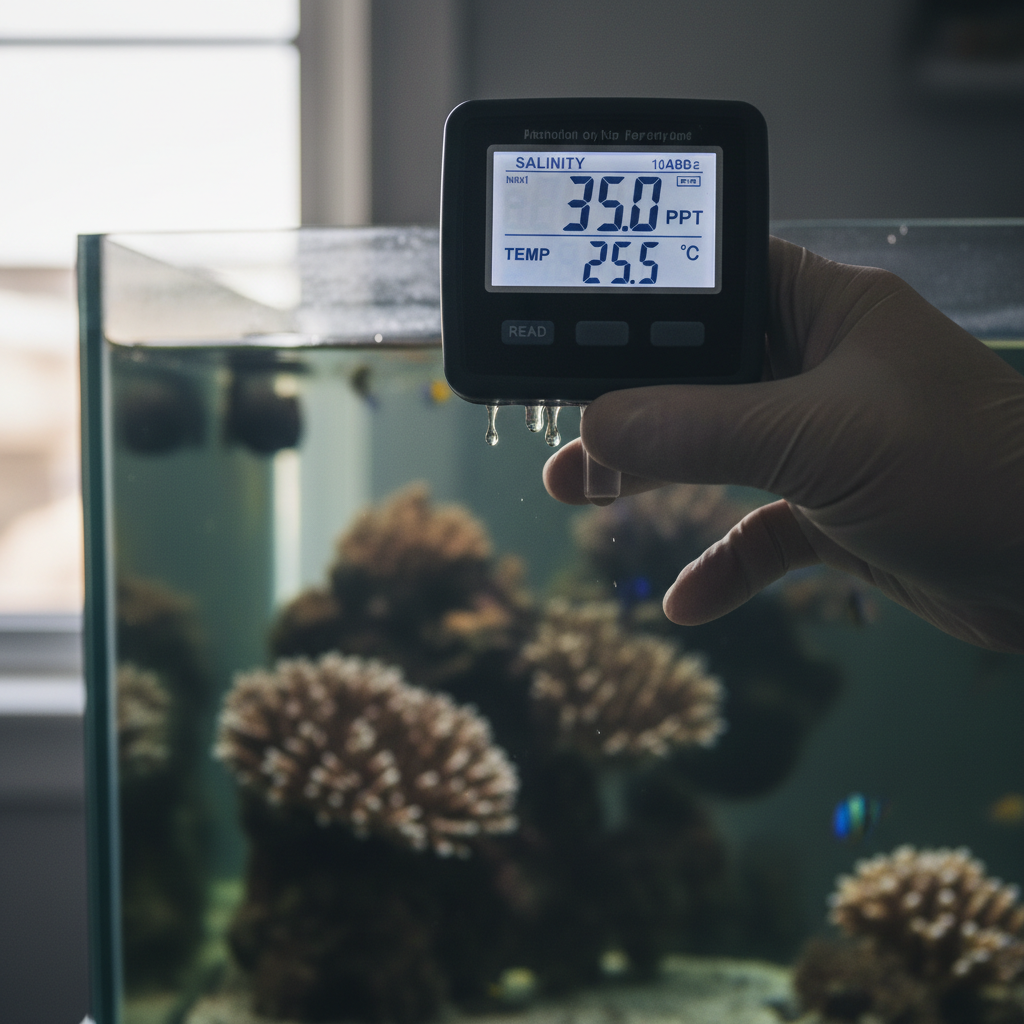
Salinity is the concentration of dissolved salts in water, typically expressed in parts per thousand (ppt), grams per liter (g/L), or Practical Salinity Units (PSU). Most continuous sensors do not measure salt concentration directly. They measure electrical conductivity (EC), because dissolved ions carry current. The firmware applies a calibrated conversion to report a salinity value.
This conversion works well in ocean-like water. It works less well in inland aquifers, treated effluent, brackish estuaries, or recirculating systems where the ionic makeup departs from standard seawater ratios. USGS research at 66 monitoring sites found that a conductivity-based proxy predicted salinity within ±10%, but accuracy depended on water type and seasonal chemistry. Two water bodies can show identical conductivity and have very different ionic profiles.
Temperature adds another layer. Conductivity rises as water warms, so probes without automatic temperature compensation will report different salinity values for the same water at different times of day.
The practical takeaway: a salinity reading is an inference, not a direct measurement. It is useful, often sufficient, and occasionally misleading. Keep raw EC, temperature, and calibration records alongside the converted number. That metadata is what turns a reading into evidence.
There Is No Universal “Ideal Salinity”
The most common question behind this search is direct: what salinity should my farm run? The honest answer is that it depends on species, life stage, water chemistry, and acclimation protocol.
| Species Group | Indicative Range | Key Consideration |
|---|---|---|
| Catfish, pangasius, common carp | Below 5 g/L | Freshwater species; salinity above threshold triggers osmotic stress |
| Atlantic salmon | Up to 20 g/L (freshwater phase); 22 to 28 ppt (sea phase) | Smoltification timing determines salt tolerance |
| Tilapia, rainbow trout | Up to 20 g/L | Euryhaline, but growth performance drops at extremes |
| Penaeid shrimp (Pacific white) | 2 to 40 g/L survival; 15 to 25 ppt optimal growth | Ion composition matters as much as headline ppt |
| Hard clams | 20 to 30 ppt optimal physiological range | Juveniles more vulnerable; rapid change worse than gradual |
Sources: Global Seafood Alliance salinity guidance and University of Florida hard clam research.
Now consider the Alabama exception. Producers in West Alabama have raised Pacific white shrimp for over 20 years in aquifer water at 2 to 6 ppt, far below the roughly 34 ppt of full-strength seawater. It works because they supplement potassium, magnesium, calcium, and sodium according to their specific water chemistry. Shrimp arrive from hatcheries at 30 ppt and are acclimated over 5 to 10 days. The salinity reading alone would suggest these farms should fail. The ionic recipe explains why they succeed.
If your monitoring system reports ppt and nothing else, you have half the picture. The number is real. The diagnosis requires ionic context.
Rate of Change Kills Faster Than a Wrong Average
A farm can operate outside textbook ranges for years if animals are properly acclimated and ionic balance is managed. What kills is surprise.
University of Florida researchers exposed hard clams to sustained low and high salinity. At 5 ppt, mortality reached 54% in growout-size seed within 15 days. At 45 ppt, it reached 76%. The same researchers noted that rapid changes are more stressful than gradual ones. A lease sitting at 25 ppt year-round is stable. A lease that drops from 25 to 12 ppt overnight after a river flood is a mortality event.
The shrimp disease research adds a second mechanism. A 2024 study found that low salinity at 10 ppt reduced growth, disrupted gut microbiome diversity, and increased vulnerability to Vibrio parahaemolyticus. A 2025 Egyptian study tested whiteleg shrimp at 7, 35, and 50 g/L and found that salinity extremes altered infection dynamics and reduced antibiotic treatment effectiveness. Neither study claims salinity alone causes every outbreak. Both show abrupt salinity change is a co-stressor that opens the door to pathogens animals would otherwise resist.
The monitoring implication: alerting on rate of change per hour is more valuable than alerting on a daily average. If your system logs once per shift, a rainstorm can push animals past their acclimation threshold before anyone checks the screen.
Choosing Your Measurement Architecture
The technology question is not “which sensor is best.” It is “which combination of methods fits this farm’s biology, labor, scale, and risk profile.”
| Method | Strength | Limitation | Best Fit |
|---|---|---|---|
| Refractometer | Fast, cheap, no power required | Manual only; no continuous record | Pond rounds, hatchery transfers, calibration cross-checks |
| Handheld EC/salinity meter | Digital readout, temperature-compensated | Still manual; ±1 ppt typical accuracy | Daily spot checks, probe verification |
| Continuous EC probe | Logs automatically, catches events between rounds | Requires cleaning, calibration, power, connectivity | Ponds, RAS, cages, dosing control |
| Multiparameter sonde | Links salinity to DO, pH, temperature, turbidity | Higher cost, more channels to maintain | Intensive facilities, coastal cages, hatcheries |
| Lab ion analysis | Full ionic profile (K, Mg, Ca, Na) | Slow, costly, sampling logistics | Investigating unexplained stress, validating low-salinity source water |
A two-tier architecture works for most operations. Use a continuous EC probe or sonde as the event-detection layer. Use a refractometer or calibrated handheld as the audit layer. Run both. When they disagree, investigate before trusting either. Modern wireless environmental monitoring systems can integrate both continuous probes and manual validation checkpoints into a unified data flow. The same logic applies to a hydroponic monitoring system, where EC and nutrient balance demand identical layered verification.
A 2024 Asian seabass study shows what low-cost continuous monitoring looks like in practice. Researchers used a DFRobot EC sensor, validated it against a YSI Professional Plus over three months at six-hour intervals, and reported ±0.09 ppt accuracy after regression calibration. That is promising. But the same study warns that standard-solution calibration alone is insufficient and calls for field comparison against a trusted reference. The cheap sensor can deliver, but only if validated in your water, at your site, against something you already trust.
Specifications also deserve scrutiny. Hanna’s HI98319 marine tester covers 0.0 to 70.0 ppt with 0.1 ppt resolution, but its stated accuracy is ±1 ppt through 40 ppt and ±2 ppt above that. If you need to catch a 1 ppt change from a rain event, that resolution and accuracy together cannot reliably flag it without trend data and local calibration.
Biofouling, Drift, and the Maintenance Nobody Budgets For
Here is where the spec sheet meets the salt water.
Every continuous sensor deployed in aquaculture faces biological fouling (algae, biofilm, barnacles), chemical drift (electrode degradation), and physical interference (sediment, cable corrosion, air bubbles). Marketing describes day-one performance. Your operating accuracy lives on day 90.
A 2025 sea-cage study monitoring European sea bass deployed salinity sensors at 6 meters depth. The researchers had to exclude salinity and turbidity data from analysis because anomalies were likely caused by cleaning issues. A separate 2025 IoT prototype study reported field malfunctions from loose electrical connections. These are not edge cases. They are the normal operating environment for electronics submerged in productive water.
A realistic maintenance protocol:
- Inspect and clean probes on a defined schedule. Weekly in high-fouling environments, biweekly minimum elsewhere.
- Calibrate with fresh, traceable standards matched to your operating range.
- Cross-check against a reference meter or refractometer. Log the deviation.
- Record temperature, calibration standard, and date for every calibration event.
- Run plausibility checks. Does the salinity trend match rainfall, water exchange volume, and readings from neighboring sensors?
If your budget covers the sensor but not the maintenance, you are buying a number generator, not a decision tool.
Connected Systems: From Probe to Decision
The shift from spot-checking to connected monitoring is well underway. A 2025 systematic review analyzed 217 articles on IoT water-quality sensors in aquaculture and found 56 papers published from 2020 through 2024, a 74.79% increase in research output. The parameters studied now extend beyond pH, temperature, and dissolved oxygen to include salinity, TDS, EC, turbidity, ammonia, and water level.
Deployed systems are moving past proof-of-concept. Scottish Sea Farms placed 10 Smart Water devices across offshore cages in Scapa Flow, monitoring pH, temperature, salinity, and oxygen for 35,000 salmon over 5G. The public case does not report a quantified mortality reduction, but it demonstrates operational visibility in a location where physical access depends entirely on weather windows.
A 2024 Bangladesh freshwater Galda shrimp study combined five sensors with cloud and machine-learning layers, achieving EC prediction with R² of 0.94 and production classification accuracy of 97.84%. Early-stage results from a specific dataset, not a universal guarantee. But the direction is clear: salinity data feeding predictive models that flag risk before visible stress appears in the animals.
The practical buying question is simple. What happens between your manual rounds? If a four-hour rain event can drop your pond below the acclimation threshold and your team checks twice per shift, continuous monitoring closes that gap. If your facility is stable, well-buffered, and inspected every hour, the return calculation changes.
Six questions to ask any monitoring vendor before committing:
- What is the sensor’s accuracy in my water chemistry, not just in calibration solution?
- What is the cleaning and calibration interval, and who performs it?
- Does the device buffer data locally during connectivity gaps?
- Can I access raw EC and temperature, or only the converted salinity?
- Does alert logic trigger on rate of change, or only on fixed thresholds?
- Who owns the data, and can it be exported for permits or audits?
Effluent: The Other Side of the Pond Wall
Salinity monitoring is usually framed as an input question: what do my animals need? There is an output question too: what is my farm discharging?
In Bahía de Kino, Mexico, researchers sampled effluent from four shrimp farms spanning 1,350 hectares. Effluent salinity measured 39.3 ± 1.3 ppt, significantly above the surrounding bay at 37.2 ± 0.6 ppt, with depressed dissolved oxygen and elevated suspended solids. US aquaculture effluent guidance recommends documenting ambient water quality before a facility is built and describing flow, DO, ammonia, and solids in the permitting context.
The regulatory direction is clear. Discharge monitoring requirements are tightening in coastal zones. A farm that optimizes salinity inside the pond while ignoring what leaves through the outfall is building a compliance liability that grows with every permit cycle.
A complete salinity program covers both the culture environment and the receiving water. Same sensors. Same data flow. Different purpose.
Four Layers of a Working Salinity Program
A dashboard is not a program. A program that reduces mortality and protects yield has four layers:
- Define a biological target that is species-specific, life-stage-specific, and ion-aware. Not a number copied from a textbook written for a different water source.
- Match the measurement method to the farm’s risk profile. Continuous logging for shock detection, manual checks for calibration verification, lab analysis when ion imbalance is suspected.
- Document a response protocol. What happens when salinity crosses a threshold or changes faster than expected? Who acts, what gets tested, how fast?
- Maintain an evidence trail. Calibration records, alarm logs, corrective actions, and outcome data. This is what separates a monitoring system from a number on a wall.
If you are building or upgrading an aquaculture monitoring architecture, environmental tracking solutions with IoT connectivity handle the measurement and data layers. The biological target and response protocol require your operational knowledge. The strongest systems combine both.
Questions about connecting water-quality sensors to a working decision flow? Talk to our team, or reach us at info@datanetiot.com.
Frequently Asked Questions
What salinity is best for aquaculture?
There is no single target. Catfish and carp thrive below 5 g/L. Penaeid shrimp survive at 2 to 40 g/L but grow best at 15 to 25 ppt. Hard clams prefer 20 to 30 ppt. The correct number depends on species, life stage, ionic composition, and acclimation history. Do not copy a target from a different species or water source.
Is conductivity the same as salinity?
No. Conductivity measures how readily water carries electrical current. Salinity is calculated from that reading using a calibrated conversion. The conversion works in seawater-like chemistry but can misrepresent conditions in inland, brackish, or recirculated water where ion ratios differ from ocean norms.
How often should I measure salinity?
Continuously during stocking, acclimation, heavy rain, water exchange, and disease events. In stable systems, daily manual checks at minimum, with continuous logging where budget and risk justify it. For shellfish site selection, one to two years of monitoring is recommended before committing to a lease.
Can low salinity cause disease in shrimp?
It acts as a co-stressor. Research shows shrimp at 10 ppt exhibited reduced growth, microbiome disruption, and up to 53.3% mortality when challenged with Vibrio. Low salinity diverts energy from immune function into osmoregulation, raising infection risk when pathogens are present.
Do I need IoT monitoring, or is a refractometer enough?
A refractometer works if your environment is stable, staff checks frequently, and you can tolerate the risk of missing events between rounds. IoT monitoring adds value when weather, tides, or facility scale create gaps a manual schedule cannot cover. The strongest setup uses both: continuous logging for detection, manual checks for verification.
What should I ask a sensor vendor before buying?
Ask for accuracy in your actual water chemistry (not calibration solution), cleaning interval, biofouling behavior, raw data access, offline buffering, rate-of-change alerting, data ownership, and independent field validation results. A vendor that cannot answer all of these is selling hardware, not a monitoring solution.








 +1 508 292 2210

4 Responses