

A single overnight oxygen crash can wipe out more stock than a month of poor feeding. In an industry that FAO values at $313 billion in first-sale revenue, dissolved oxygen monitoring in aquaculture is the line between a profitable cycle and a catastrophic write-off. (See also: aquaculture environmental monitoring.)
Yet most operations still treat it as a device purchase instead of a system design problem, which is exactly why a well-planned aquaculture monitoring system matters more than any single sensor.
I’ve spent years deploying IoT monitoring across logistics, aviation, and environmental tracking. The pattern I see in aquaculture is identical to what I saw in cold-chain a decade ago: operators buy a sensor, mount it in one convenient spot, check it once or twice a day, and assume they’re covered. They’re not. A dissolved oxygen reading is a snapshot at one location and one moment. It can look perfectly safe at 3 PM and be lethal at 5 AM, six feet away.
This guide covers what actually works: the biology behind the numbers, the sensor technology worth your investment, the placement strategy that separates useful data from false confidence, and the emergency protocol for when oxygen crashes despite your best setup.
Why dissolved oxygen is the most critical parameter you measure
Dissolved oxygen (DO) is oxygen gas held in water. Fish, shrimp, microbes, algae, and decomposing feed consume it continuously. Photosynthesis and wind replenish it during the day. At night, photosynthesis stops. Respiration doesn’t.
The result: DO typically hits its minimum just after dawn. That 4:30 AM window is when stock dies, and most operators are asleep.
UF/IFAS sets practical references at 5 mg/L or above for optimum fish health, 2 to 4 mg/L as a distress range for many species, and below 2 mg/L where mortality usually begins. But these are guidelines, not universal rules. Silver perch can tolerate brief dips to 2 mg/L, while prolonged exposure below 3 mg/L still damages growth. Shrimp generally need above 5 mg/L. Temperature complicates things further: cold water holds more oxygen than warm water. At 45°F, water retains about 12 mg/L. At 90°F, only 7.4 mg/L.
The practical takeaway: your safe threshold depends on species, life stage, temperature, salinity, stocking density, and how long the low-oxygen event lasts. Because cold water holds more oxygen than warm water, aquaculture temperature monitoring directly shapes your DO risk. A static alarm at 4 mg/L is better than nothing. A dynamic threshold adjusted for conditions is far better.
The dawn risk is biological, not hypothetical
Dense phytoplankton blooms produce oxygen during daylight hours, sometimes pushing DO above saturation by late afternoon. At night, the same bloom becomes a massive oxygen consumer. Add high stocking density, recent heavy feeding, warm water, calm wind, and cloud cover, and you have the recipe for a pre-dawn crash.
The worst scenario is a plankton die-off. A thriving bloom collapses overnight, and instead of producing oxygen, the decomposing biomass consumes it rapidly. NSW guidance identifies this sequence as one of the most common causes of catastrophic oxygen depletion in pond aquaculture. If you don’t have continuous monitoring or a dawn measurement protocol, you find out when fish start piping at the surface. By then, losses have already begun.
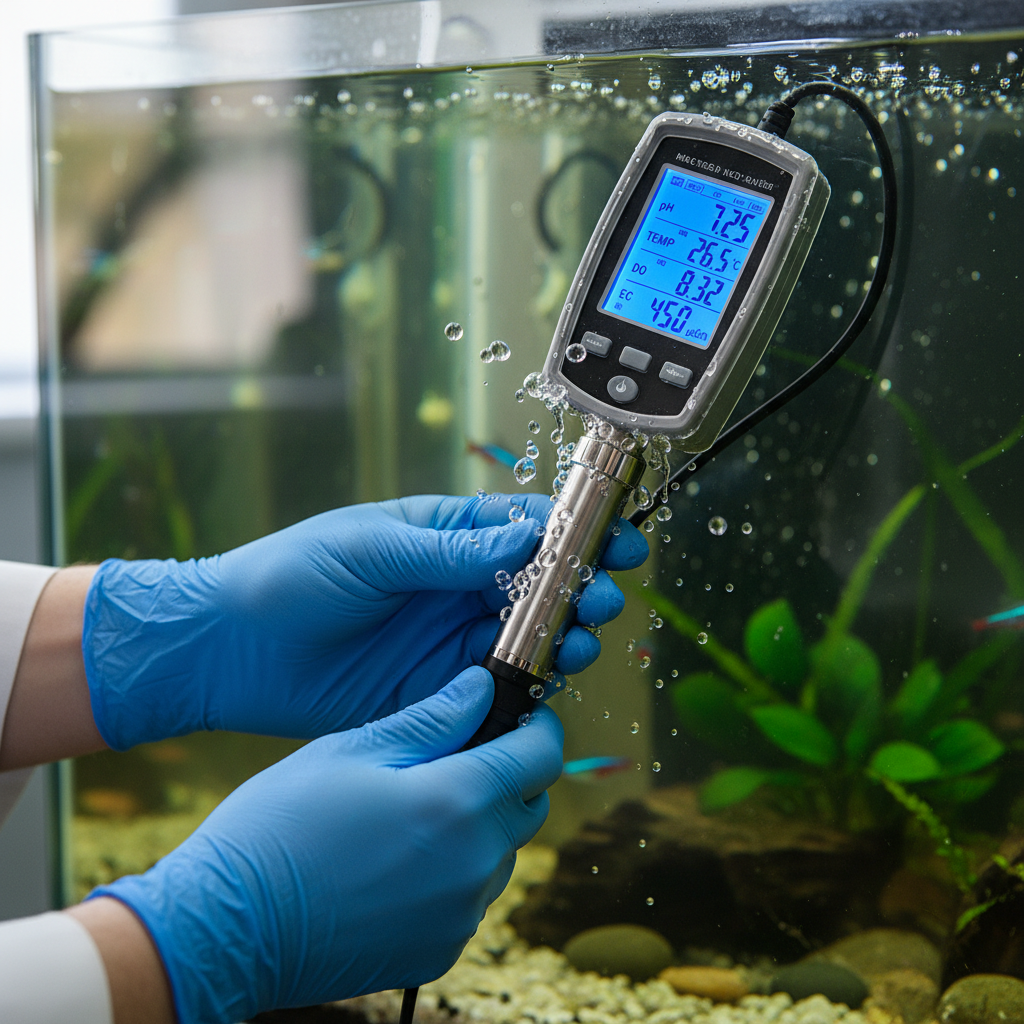
Sensor types compared: four approaches, four trade-offs
Every sensor manufacturer will tell you theirs is the best. Here’s what the measurement principles actually deliver.
Winkler titration (the reference standard)
First proposed in 1888, the Winkler method chemically fixes dissolved oxygen in a water sample and determines concentration through titration. Hach describes it as accurate but time-consuming, with sampling error and no real-time signal. It remains the reference for calibration verification and audits, but it doesn’t help you at 4 AM when oxygen is crashing.
Electrochemical sensors (polarographic and galvanic)
These use an oxygen-permeable membrane, an electrolyte solution, and electrodes. Oxygen diffusing through the membrane generates a current proportional to its concentration. HORIBA’s comparison of galvanic and optical probes is worth reading for the technical detail. The key facts: electrochemical probes are fast (stabilization in roughly 15 to 20 seconds), low-power, and relatively affordable. The catch is they consume oxygen during measurement, which means they need water flowing across the membrane at about 1 foot per second for accurate readings. Membranes degrade and require periodic replacement. Calibration drifts.
Optical sensors (luminescence quenching)
Optical probes excite a luminescent dye and measure how dissolved oxygen quenches the fluorescence response. They don’t consume oxygen, are less dependent on water flow, and generally need less routine maintenance. Xylem notes that optical sensors typically measure up to about 20 mg/L, while amperometric designs can reach 60 mg/L or 600% saturation. The trade-off: higher purchase cost, more power consumption, and the sensing cap or dye ages over time.
Low-cost IoT sensors
The emerging category. These combine lower-grade sensing elements with edge computing, telemetry, and cloud platforms—advances in environmental monitoring technology that trade individual probe accuracy for spatial density (more measurement points per dollar). A Malaysian study at an Asian seabass hatchery validated a low-cost system against a YSI Professional Plus and reported a mean relative DO error of 0.57% under controlled conditions. That’s promising. But the same study found that standard-solution calibration alone was insufficient; field collocation against a reference instrument was essential.
| Approach | Best for | Main limitation | Typical use |
|---|---|---|---|
| Winkler titration | Reference accuracy | No real-time signal; labor-intensive | Audits, calibration checks |
| Electrochemical probe | Fast response, low power | Consumes oxygen; needs flow and membrane care | Portable checks, powered continuous monitoring |
| Optical probe | Unattended, low-flow sites | Higher cost and power; cap aging | Fixed installations, hard-to-service locations |
| Low-cost IoT | Spatial density, remote alerts | Drift risk; requires local calibration | Broad coverage when paired with reference checks |
No single type wins across every scenario. A shrimp pond in Southeast Asia, a salmon cage in Norway, and a trout RAS in Colorado are three entirely different operating environments. Pick the measurement principle that matches your water chemistry, maintenance capacity, and monitoring architecture.
The measurement gap most farms ignore
Here’s the part almost nobody talks about: the biggest risk in dissolved oxygen monitoring isn’t the sensor. It’s where you put it.
SRAC’s measurement guide makes this explicit. A DO reading represents only the exact time and location where it was taken. Oxygen varies by depth, horizontal position, wind exposure, proximity to banks, proximity to aerators, and time of day. A surface reading at 2 PM near a paddlewheel tells you almost nothing about bottom-water conditions at 4 AM on the far side of the pond.
I see the same failure mode in cargo monitoring at sea: a temperature logger placed near the refrigeration unit reads fine while the load 20 feet away cooks. The technology works. The deployment doesn’t.
Placement that produces real data
For ponds, SRAC recommends sampling at 12 to 18 inches below the surface at multiple locations, including the spots farthest from aeration. For cages, depth profiling matters because stratification can create oxygen-dead zones below the thermocline while surface readings look normal. For RAS, measure at the tank outlet (where oxygen is lowest after fish consumption) and verify at the inlet after oxygenation.
During summer growing seasons, high-density ponds need at least two daily readings: dawn and dusk capture the extremes. In warm, volatile conditions, every 1 to 2 hours is safer. Continuous fixed probes are the most reliable option when a missed overnight event could mean a mass mortality.
And here’s the uncomfortable truth: even continuous monitoring gives false confidence if you have one probe in a two-hectare pond. A safe number at the wrong location is more dangerous than no number at all, because it suppresses the instinct to check.
Continuous IoT monitoring vs. spot checks: when the investment pays
If you manage a small extensive pond with low stocking density, a portable DO meter and disciplined dawn/dusk checks may be enough. Manual measurement works when the consequence of missing one reading is low, and when someone is physically present at the right times.
The economics shift when any of these conditions apply:
- High stocking density (the oxygen consumption rate outpaces natural replenishment)
- Remote or multiple sites (nobody is on-site at dawn)
- High-value species (a single crash event costs more than an entire monitoring system)
- RAS or intensive systems (oxygen swings happen fast, and there’s no natural buffer)
The precision aquaculture market is projected to grow from $0.85 billion in 2025 to $1.43 billion by 2030 at an 11.1% CAGR. That growth isn’t speculative enthusiasm. It’s driven by operators who lost stock once and decided never again.
The dense-and-cheap approach
One interesting development: deploying many low-cost IoT sensors instead of a few premium probes. The Malaysian seabass study showed that a low-cost system can produce a 0.57% mean relative DO error after proper field calibration. A 2026 preliminary field evaluation extends this concept with low-cost IoT monitoring combined with short-horizon DO forecasting in ponds.
The logic is spatial. Ten corrected low-cost points across a pond can reveal oxygen gradients that one premium probe at a fixed location cannot. But (and this is a critical “but”) those ten points are only useful if each one has been collocated against a reference instrument and if ongoing drift is checked. Low-cost does not mean low-maintenance.
Predictive DO: what AI delivers and where it falls short
The promise of predicting oxygen crashes before they happen is real, and the reported numbers look strong. An enhanced LSTM model reported 92.28% prediction accuracy compared to 81.97% for a baseline approach. An IoT-driven ensemble study reported 96% accuracy. Machine learning has been applied to forecast hypoxia events in salmon farms.
Here’s what those numbers don’t tell you: model performance depends entirely on the quality and representativeness of the training data. A model trained on six months of stable conditions will perform poorly during a sudden bloom crash, an unusual weather event, or a change in stocking density. These are exactly the scenarios where you need prediction most.
UAV-based spatial mapping
A study at two Nanjing aquaculture bases synchronized UAV imagery with in-water samples and achieved R² values of 0.87 and 0.85 using Random Forest models. Useful. But the researchers also documented that DO is not directly photosensitive, so the UAV’s spectral data relies on proxy variables like chlorophyll-a. Vegetation interference introduces error.
The responsible way to use both AI and UAVs: as an early-warning layer that extends coverage and anticipates risk, never as a replacement for an in-water probe at the point of biological exposure. A prediction that says “oxygen will drop in Pond 3 by dawn” is valuable only if there’s a calibrated sensor in Pond 3 that confirms it, and an aerator connected to act on it.
When oxygen crashes: your first 15 minutes
No monitoring system is failure-proof. Probes foul. Networks drop. Calibration drifts. Blooms crash faster than any model predicts. You need an emergency protocol that doesn’t depend on technology working perfectly.
The sequence, drawn from UF/IFAS guidance and NSW DPI recommendations:
- Verify the reading and location. If fish are piping at the surface, the emergency is real regardless of what the sensor says. Grab a portable meter and check at the point of distress.
- Start aeration immediately. Turn on every available aerator, paddlewheel, diffuser, or blower. In an active crash, over-aerating is not the risk.
- Stop feeding. Feed decomposition and fish metabolic activity both consume oxygen. Cutting feed reduces both loads.
- Exchange water if possible. Incoming water from a clean source can raise DO quickly, especially in tank systems or ponds with inflow capacity.
- Remove dead organic material. Dead fish, dead algae, and uneaten feed accelerate oxygen consumption as they decompose.
After the crisis passes, the harder question: why didn’t the monitoring system catch it? Was the probe in the wrong place? Was the alarm threshold set for the wrong species or condition? Did the network go down without a secondary alert? Every crash is a system audit.
Building a layered monitoring architecture
The winning design isn’t one device. It’s a system with redundancy, clear escalation, and manual fallback. Five layers, in priority order:
Layer 1: In-water sensing. Fixed probes with temperature and conductivity compensation at the actual biological risk points (not the most convenient installation spot). Optical for unattended deployments; electrochemical where fast response and low power matter more.
Layer 2: Reference verification. A portable meter or Winkler kit to periodically check your fixed probes against ground truth. This is the layer most operations skip, and it’s the one that catches drift before drift catches you.
Layer 3: Communications and alarms. Telemetry that delivers readings to a dashboard and triggers alerts with low latency. Design the offline behavior as carefully as the online behavior: if the network fails, the system should default to local alarm (audible, visual) rather than silence.
Layer 4: Automated response. Aeration tied to DO thresholds through a controller (PLC, edge device, or cloud logic). A 150 m³ rainbow trout RAS case used PLC-controlled side-stream oxygenation, targeting 110% saturation and maintaining 11 mg/L, with estimated daily oxygen savings of 20 to 60%. But even this system observed some gas waste, which means hydraulic design (flow rate, bubble size, aerator position) must be optimized alongside the control logic.
Layer 5: Analytics and prediction. AI models, trend analysis, spatial mapping. This layer adds foresight but should never be the sole safety signal. A model that knows when not to trust itself (confidence bounds, drift detection) is worth more than one that reports high accuracy on training data.
Always retain manual override on the aerator. A clogged probe, a failed network link, or a bad calibration can become a single point of failure if there’s no human in the loop.
Integration with feeding systems
One area the industry is moving toward but few current SERP resources cover: linking DO data to automatic feeders. High dissolved oxygen triggers normal feeding rates. Declining DO triggers reduced rations or a feeding pause. The logic is simple (feed metabolism is a major oxygen consumer), and the production benefit is double: you avoid accelerating a crash, and you stop wasting feed that fish under oxygen stress won’t convert efficiently.
Choosing the right system for your operation
Instead of recommending a brand, here’s the decision framework I use when clients ask me to spec a monitoring system:
- What species, density, and life stage? (This sets your threshold and response-time requirements.)
- What’s your water chemistry? (Salinity, temperature range, and turbidity determine sensor suitability. Consistent salinity monitoring in aquaculture is part of this picture.)
- How many measurement points do you need for representative coverage? (Not “how many can I afford,” but “how many does the spatial risk demand.”)
- Who responds at 4 AM? (If the answer is “nobody on-site,” you need automated aeration with independent alarms, not just a dashboard.)
- What’s your calibration and maintenance capacity? (An optical probe with no maintenance plan drifts just as badly as a cheap one.)
- What happens when the system fails? (If the answer is “we wouldn’t know,” you have a single point of failure.)
The cheapest probe can become the most expensive system if it produces a missed alarm. And the most expensive probe adds zero value if it’s mounted in the wrong spot.
Frequently asked questions
What dissolved oxygen level kills fish?
There is no single lethal threshold. UF/IFAS reports that mortality usually occurs below 2 mg/L for many freshwater species, while distress begins between 2 and 4 mg/L. Species, temperature, salinity, life stage, and exposure duration all shift the actual lethal point. Set your alarm based on the most sensitive species in your system, not a generic number.
How often should dissolved oxygen be measured in aquaculture?
At minimum, twice daily (dawn and dusk) in high-density systems during the growing season. Warm, volatile conditions may require checks every 1 to 2 hours. Continuous monitoring with fixed probes is the safest approach when a missed overnight event could kill stock. SRAC recommends electronic meters over colorimetric kits for any commercial operation measuring multiple ponds or tanks.
Are optical DO sensors better than electrochemical ones?
Neither wins universally. Optical sensors don’t consume oxygen and need less routine maintenance, making them better for unattended, fixed installations. Electrochemical sensors respond faster, use less power, and cost less, making them practical for portable use and budget-constrained deployments. Choose based on your installation conditions, not marketing claims.
Can IoT sensors replace professional DO meters?
They can extend coverage, not automatically replace reference instruments. A validated low-cost system achieved 0.57% mean relative DO error against a YSI Professional Plus, but only after field collocation and local correction. Deploy many low-cost points for spatial coverage, and keep a reference meter for periodic verification.
What should I do immediately during an oxygen crash?
Verify the emergency (portable meter or visual signs like piping), start every available aerator, stop feeding, exchange water if possible, and remove dead organic material. These steps come from UF/IFAS and NSW DPI guidance. After the event, audit why your monitoring system didn’t prevent it.
Why does dissolved oxygen drop overnight in ponds?
Photosynthesis by algae and aquatic plants stops after sunset, while respiration by fish, microbes, plankton, and decomposing organic matter continues through the night. The imbalance causes DO to decline steadily, typically reaching its lowest point just after dawn. High stocking density, heavy feeding, warm temperatures, and dense algal blooms amplify the drop.
If your aquaculture operation lacks continuous visibility into dissolved oxygen, temperature, or water quality conditions, that’s the kind of monitoring gap IoT solves. At Datanet, environmental tracking and remote sensing are what we build every day. Explore our environmental tracking devices, or reach out directly at datanetiot.com/contact-us.








 +1 508 292 2210

3 Responses