

In 2024, aquaculture crossed 100 million tonnes of farmed aquatic animals for the first time, valued at USD 371 billion at farm gate. The industry has never been larger. Yet for most operators, aquaculture productivity improvement remains a puzzle: feed costs climb, disease erases entire production cycles, and oxygen crashes happen at 2 a.m. with nobody watching.
The problem isn’t a shortage of technology. It’s that farms pick technology before diagnosing the constraint that destroys the most value. A smart feeder can’t fix bad genetics. An AI dashboard can’t prevent a biosecurity breach. And a $200,000 recirculating system can’t pay for itself if energy costs weren’t modeled.
Below are six levers ranked by evidence and impact, in the order most operations should address them. The sequence matters as much as the lever itself.
What Productivity Actually Measures
Aquaculture productivity is not harvest weight. It’s a scorecard of connected metrics. A farm that reports 10 tonnes per hectare but lost 30% of stocked animals to disease is less productive than one reporting 8 tonnes with 5% mortality, because the second farm spent less feed, less labor, and less capital per kilogram of saleable product.
| KPI | What It Answers | Improvement Levers |
|---|---|---|
| Survival rate | How many stocked animals reach harvest? | Biosecurity, water stability, stocking discipline |
| Growth rate / days to harvest | How fast does biomass accumulate? | Genetics, nutrition, oxygen, temperature control |
| FCR (feed conversion ratio) | How much feed produces one kg of harvested fish? | Formulation, feeding schedule, pellet quality, appetite sensing |
| Yield per area or volume | How much product per unit of scarce space? | Stocking, system design, aeration, recirculation |
| Resource intensity | What water, energy, and labor cost per kg? | Recirculation, aeration efficiency, automation |
| Margin variability | Does the operation produce reliable cash flow? | Forecasting, contracts, maintenance, insurance |
When you know which KPI is weakest, you know which lever to pull first. Most guidance on aquaculture productivity talks about what to improve and why. Rarely does it address the order. That’s what the six levers below do.
Lever 1: Genetics and Seed Quality
Selective breeding is the only productivity intervention that compounds across generations without increasing operating complexity. The evidence is unusually clear.
The GIFT (Genetically Improved Farmed Tilapia) program, launched by WorldFish in 1988, combined diverse founder populations with repeated selection for growth and local adaptation. It has produced roughly 10% growth improvement per generation and has been disseminated to 16 countries.
In a Bangladesh field comparison, GIFT tilapia grew 27% faster in monoculture and 36% faster in polyculture than non-GIFT strains. Yields hit 8.1 versus 6.2 tonnes/ha/cycle in monoculture, 9.3 versus 7.8 in polyculture. Profitability was higher for GIFT farmers across both systems.
But here’s the boundary condition the same study revealed: FCR differences between GIFT and non-GIFT were not statistically significant. Faster growth did not automatically prove better feed conversion. Survival was actually lower for GIFT fish in polyculture.
The lesson is simple. Genetics raises the biological ceiling. Management determines whether that ceiling becomes realized harvest. Buy verified seed, track batch performance, select against your farm’s actual disease profile and environment. The compounding then works for you cycle after cycle.
Once your seed is right, the next lever targets the biggest line item on your P&L.
Lever 2: Feed Efficiency
Feed is the largest single cost in aquaculture production. It directly affects growth, water quality, oxygen demand, and waste output. Every percentage point of FCR improvement hits both margin and environmental footprint.
Historically, typical aquaculture FCR has improved from about 1.8-3.0 down to 1.2-1.8, driven by better formulation, pellet technology, and species-specific feeding regimes. That’s real progress. But the metric that matters on your farm is economic FCR: feed delivered (not just dispensed) divided by biomass harvested (not estimated), priced at what you actually paid, including waste and mortality.
Two numbers frame the strategic picture. Aquaculture consumes 87% of global fishmeal production and 74% of fish-oil production. That concentration creates price volatility and supply risk. Alternative proteins (plant, insect, algal, microbial) are advancing, but substitution is species-specific. A novel ingredient that reduces fishmeal dependence but tanks palatability or survival hasn’t improved productivity. Test each alternative against growth, FCR, health, and cost per saleable kilogram.
Before investing in a smart feeder, know your current baseline. Measure delivered feed against harvested biomass. Track feeding events with timestamps. Compare FCR across ponds, cages, or tanks under similar conditions. The gap between what you think you’re feeding and what fish actually consume is often larger than any algorithm can optimize away.
Feed optimization puts money back on the table. Biosecurity keeps it there.
Lever 3: Biosecurity and Disease Prevention
Infectious disease causes the loss of roughly 10% of all cultured aquatic animals globally, worth more than USD 10 billion per year. In India alone, a 2025 study estimated aquaculture disease costs at USD 2.48 billion, or 14.95% of annual production value.
No sensor, no algorithm, no feeding system can recover fish that are already dead. That’s why biosecurity ranks above technology in any honest productivity framework.
A functional biosecurity program is layered:
- Certified, traceable seed from verified hatcheries
- Quarantine protocols for new stock
- Water-quality control that prevents the conditions pathogens exploit
- Routine observation and early diagnostics
- Vaccination where species and pathogen profiles support it
- Physical barriers: disinfection points, vector control, staff protocols
- Rapid mortality removal and reporting
The return on biosecurity is asymmetric. Spending on prevention is modest and continuous. A single disease event can wipe out a cycle’s revenue in days. When Early Mortality Syndrome swept through Southeast Asian shrimp farms, entire national production volumes collapsed within months.
If your operation hasn’t quantified its annual disease-related losses, that number is probably your highest-ROI discovery. And most biosecurity failures don’t start with a pathogen. They start with water.
Lever 4: Environmental Monitoring and Water Quality
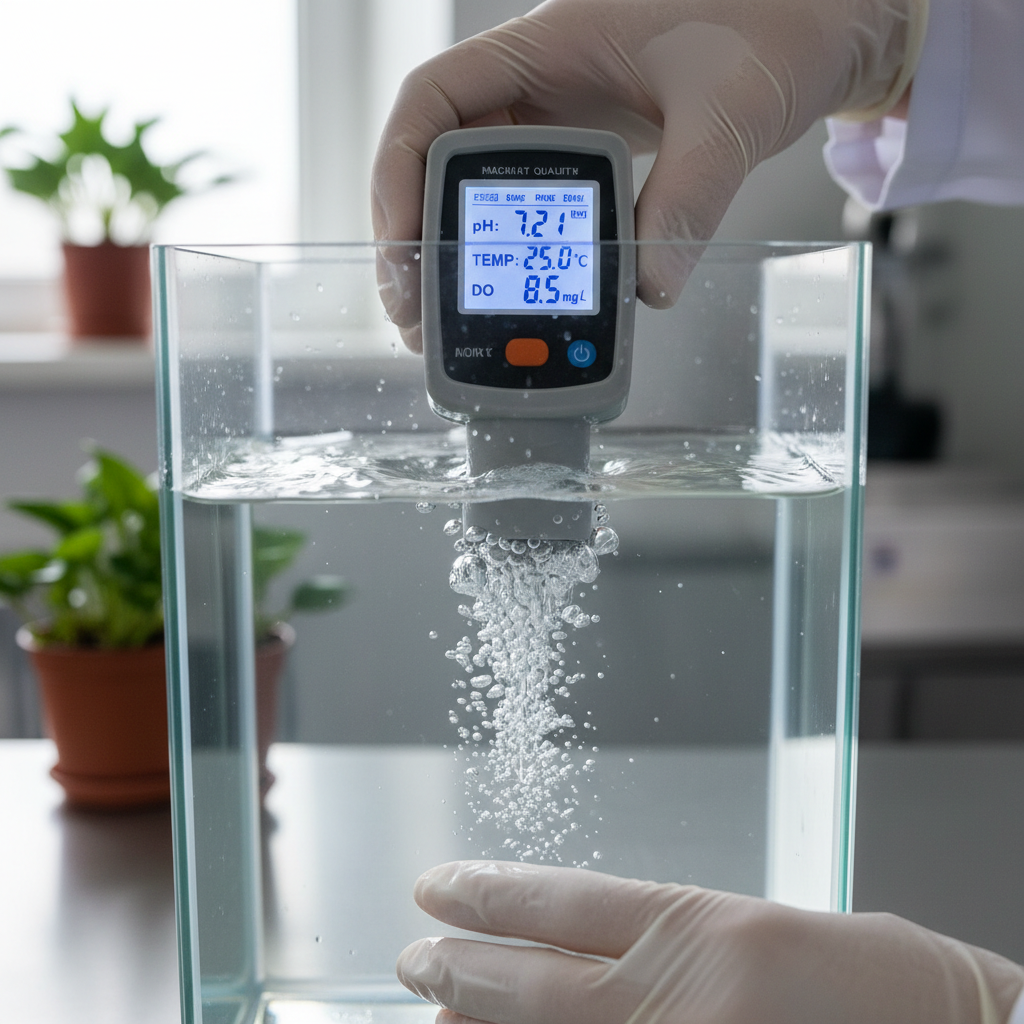
Dissolved oxygen, temperature, pH, ammonia, nitrite, salinity, turbidity, CO2. These aren’t isolated measurements. They form a connected system. Feed more, and oxygen drops while ammonia rises. Temperature spikes, and oxygen carrying capacity falls right when metabolic demand climbs.
Most aquaculture losses from water quality are not caused by sudden catastrophes. They’re caused by chronic, invisible stress: suppressed growth, weakened immune response, amplified disease susceptibility. A fish that eats less because dissolved oxygen dipped below threshold for six hours overnight doesn’t show symptoms. It just grows slower. Multiply that across thousands of animals and hundreds of nights, and you have a productivity gap that’s real but invisible without continuous data.
The shift from spot sampling (once or twice a day, manual) to continuous sensor-based monitoring changes the decision cycle entirely. Instead of discovering a problem after the damage is done, operators set thresholds and respond before oxygen crashes, before ammonia spikes reach lethal concentrations, before temperature excursions trigger stress cascades.
FAO identifies rising temperature, salinity shifts, and fluctuating water availability as growing threats to aquaculture viability. Climate variability doesn’t just add risk. It makes continuous monitoring and early-warning systems more valuable every year.
The practical question for any operator: how many of your water-quality parameters are measured continuously, and how many are spot-checked? The gap between those two answers is usually where unrealized productivity lives. What you can monitor also depends on what you’ve built, which brings us to system design.
Lever 5: System Design
Ponds, cages, recirculating aquaculture systems (RAS), biofloc (BFT), and integrated multi-trophic aquaculture (IMTA) are not ranked from primitive to advanced. They’re ranked by which constraints your operation faces.
Ponds and cages work where land, water, climate, and carrying capacity are favorable. Their capital and energy costs are lower, but environmental control is limited. RAS adds filtration, nitrification, oxygenation, and recirculation, enabling production near markets and in locations where open water isn’t available. But the economics of RAS are exposed to high energy consumption. A 2025 optimization study reported a 17% decrease in energy cost per kilogram after targeted improvements, with consumption ranging from 600 to 1,400 kWh. That’s progress, not a solved problem.
The Atlantic Sapphire case is the most instructive example in the industry. The company built a large-scale RAS salmon farm in Florida, suffered a mass mortality event in March 2021, then spent years recovering. By late 2025, management reported survival above 99%, harvest weights consistently above 3 kg, and structural highs in feeding efficiency. Both chapters of that story tell the same truth: a tightly controlled system can concentrate failure modes as easily as it concentrates productivity. Filtration, oxygen, water chemistry, and controls become coupled. When one component fails, everything fails together.
Biofloc technology converts waste into microbial biomass that can serve as supplemental food, potentially reducing external feed inputs and improving resource efficiency. IMTA extends the principle by co-culturing species at different trophic levels. Both are promising but condition-dependent, requiring careful management of microbial balance and aeration.
Make the system design decision after the biological levers are addressed. No infrastructure compensates for poor seed, bad feed, or absent biosecurity. The right infrastructure does, however, create the data foundation for what comes n See also the article: Vertical Farming Sensors: What Pays Back and What Doesn’t.ext.
Lever 6: AI, Computer Vision, and Automation
Digital tools sit at the top of this ranking for a reason: they amplify whatever is underneath them. If the biology, feed, and water management are solid, AI accelerates gains. If they’re broken, AI generates prettier reports about ongoing losses.
The evidence is real but uneven. USDA researchers developed an AI-assisted computer-vision system that detected whole and partial fish with more than 85% precision in recirculating systems. Non-invasive biomass estimates enable more accurate feeding, earlier health alerts, and less unnecessary handling. On the commercial side, Aquabyte’s feeding system uses pellet tracking and fish-behavior analysis to predict appetite five minutes ahead. Innovasea’s Farm360 platform integrates feeding records, fish health, environmental data, stock management, and traceability into a single operating system. A 2026 review of AI in aquaculture describes emerging ecosystems that combine IoT, computer vision, predictive analytics, and digital twins.
These are credible tools. But product descriptions and customer testimonials are not controlled trials. Before committing capital, require a baseline, a control group, and a post-pilot audit of FCR, survival, growth rate, and labor hours.
The cautionary counterpoint is eFishery. The Indonesian startup built a smart-feeding device that addressed a real problem: timing and controlling feed delivery for fish and shrimp farms. It became a unicorn after a USD 200 million Series D in 2023. Then in late 2024 and into 2025, reports described an investigation into alleged misconduct and fraud. The product may work. The governance failed. For operators, the lesson is clear: require device uptime logs, feed-delivery data, biomass reconciliation, and audit rights. Technology can reduce feed waste while weak controls destroy enterprise value.
The Sequence Matters More Than Any Single Technology
I’ve spent over 15 years deploying IoT and monitoring solutions across industrial operations: supply chain, aviation, ground support, and increasingly aquaculture and environmental monitoring. The operations that improve productivity fastest don’t start with the most expensive technology. They start with the intervention that removes the most waste from the current system.
The staged approach:
- Establish a baseline. Measure biomass, survival, FCR, water parameters, energy, and labor for at least one full cycle. You cannot improve what you haven’t quantified.
- Remove feed and disease waste. These two categories account for more lost value than any other on most farms. Fix them before buying hardware.
- Improve seed. Better genetics compound over cycles. The earlier you start, the more cycles you benefit.
- Stabilize water and oxygen. Continuous environmental monitoring converts invisible chronic stress into actionable alerts. This is where sensors pay for themselves fastest.
- Automate repeatable tasks. Feeding, aeration control, and data collection are the first candidates.
- Use AI for prediction and closed-loop control. Only after steps 1 through 5 give you clean data and stable operations. AI trained on bad data produces confident bad decisions.
The precision aquaculture technology market is projected to grow from USD 848 million in 2025 to USD 1.4 billion by 2030. That’s a lot of capital flowing into the sector. The farms that capture the most value from it will be those with biological and operational foundations already in place.
At Datanet, environmental monitoring is what we do. We deploy rugged IoT sensor networks that track temperature, water quality, and environmental conditions in real time across industrial and aquaculture operations. If your farm is at step 4, or if you want to figure out where your biggest productivity gap lives, reach out to our team at info@datanetiot.com. You can also explore our environmental tracking devices directly.
Frequently Asked Questions
What is the single most effective way to improve aquaculture productivity?
There is no universal answer. Start by diagnosing your largest loss: feed waste, disease mortality, slow growth, oxygen instability, or downtime. Feed is often the first economic target because it’s the largest cost category. But if disease mortality is significant, biosecurity delivers higher returns, since infectious disease losses are estimated at 10% of all cultured animals globally, exceeding USD 10 billion per year.
Is a lower FCR always better?
Usually, but not in isolation. FCR is feed divided by harvested biomass. A farm can report low FCR while mortality is high or feed records exclude waste. The Bangladesh GIFT study shows this clearly: profitability improved with GIFT tilapia, but FCR differences between strains were not statistically significant. Always pair FCR with survival, days to harvest, and product quality.
Are RAS farms more productive than ponds or cages?
RAS offers tighter environmental control and enables production where open water isn’t available. It is not automatically cheaper or more sustainable. Energy consumption remains a central economic challenge, and coupled system failures (filtration, oxygen, controls) can create severe downside. Choose RAS when water scarcity, biosecurity requirements, or market proximity justifies the capital and energy costs.
Does AI already produce proven productivity gains in aquaculture?
Some capabilities are demonstrated. USDA researchers achieved more than 85% precision in non-invasive fish detection. Commercial systems offer appetite prediction and feeding recommendations. But vendor claims should be verified with controlled before-and-after comparisons measuring FCR, survival, growth rate, and labor data. A dashboard alone is not a productivity improvement.
How does climate change affect aquaculture productivity?
Rising temperatures reduce dissolved oxygen carrying capacity while increasing metabolic demand. Salinity and water availability fluctuations add compounding stress. FAO identifies these as growing threats to aquaculture viability. Continuous environmental monitoring, species diversification, and climate scenario planning are becoming operational necessities rather than optional upgrades.
What role does traceability play in productivity?
Traceability connects feed inputs, biomass records, harvest data, and sales into a reconcilable chain. It enables accurate FCR calculation, batch performance comparison, and early detection of discrepancies. Beyond operations, it supports certification (ASC, BAP) and market access. The Global Dialogue on Seafood Traceability is building common data standards to make this practical across supply chains.








 +1 508 292 2210

2 Responses