

Aquaculture now produces more fish than wild capture. In 2022, global aquaculture output hit 94.4 million tonnes of aquatic animals, surpassing capture fisheries for the first time at 51% of global aquatic-animal production. That is 94.4 million tonnes of living biomass held in controlled water, where dissolved oxygen can drop from safe to lethal in a few hours.
Water quality sensors for fish farming are the obvious response. But the sensor itself is the easy purchase. The hard part is building a system that keeps producing truthful data at 3 AM on a humid August night, when fouling has been growing on the probe for six weeks and the cellular signal is spotty.
I have spent over fifteen years integrating IoT monitoring systems across industries: aviation MRO, maritime supply chains, ground support operations. The failure patterns are consistent. The measurement device works fine on the bench. Then reality (biofouling, power loss, calibration drift, bad placement) introduces errors that no spec sheet warns you about. This guide is built from that perspective. Not which sensor to buy. How to build a monitoring system that protects your fish.
What Happens Between Midnight and Dawn
The most dangerous hours on a fish farm are the ones nobody is watching. Photosynthesis shuts down after sunset. Algae, bacteria, and fish all keep consuming oxygen. By dawn, dissolved oxygen in a productive pond can collapse.
Mississippi State University Extension reports that aeration is typically initiated around 3 to 4 mg/L dissolved oxygen, yet nearly every catfish pond can fall below 2 mg/L at dawn in midsummer. Those low-DO windows can last 3 to 6 hours per day. If you are sampling once in the morning, you might catch the tail end of a crash. Or you might find dead fish.
DO is not the only parameter that moves fast. pH shifts change the toxicity of ammonia in the water. NMSU guidance puts the optimal pH range for most pond fish at 6 to 9, with un-ionized ammonia above 0.02 ppm for extended periods becoming hazardous. A pH reading of 8.5 and a total ammonia nitrogen of 0.5 ppm can mean very different things at 20°C versus 30°C. Temperature shifts the equilibrium toward the toxic form.
This biological reality sets the engineering requirement. Sensors must measure the right variable, at the right location, at the right frequency, with enough accuracy to trigger the right response. A beautiful dashboard showing yesterday’s average tells you nothing useful when oxygen is crashing at 4 AM.
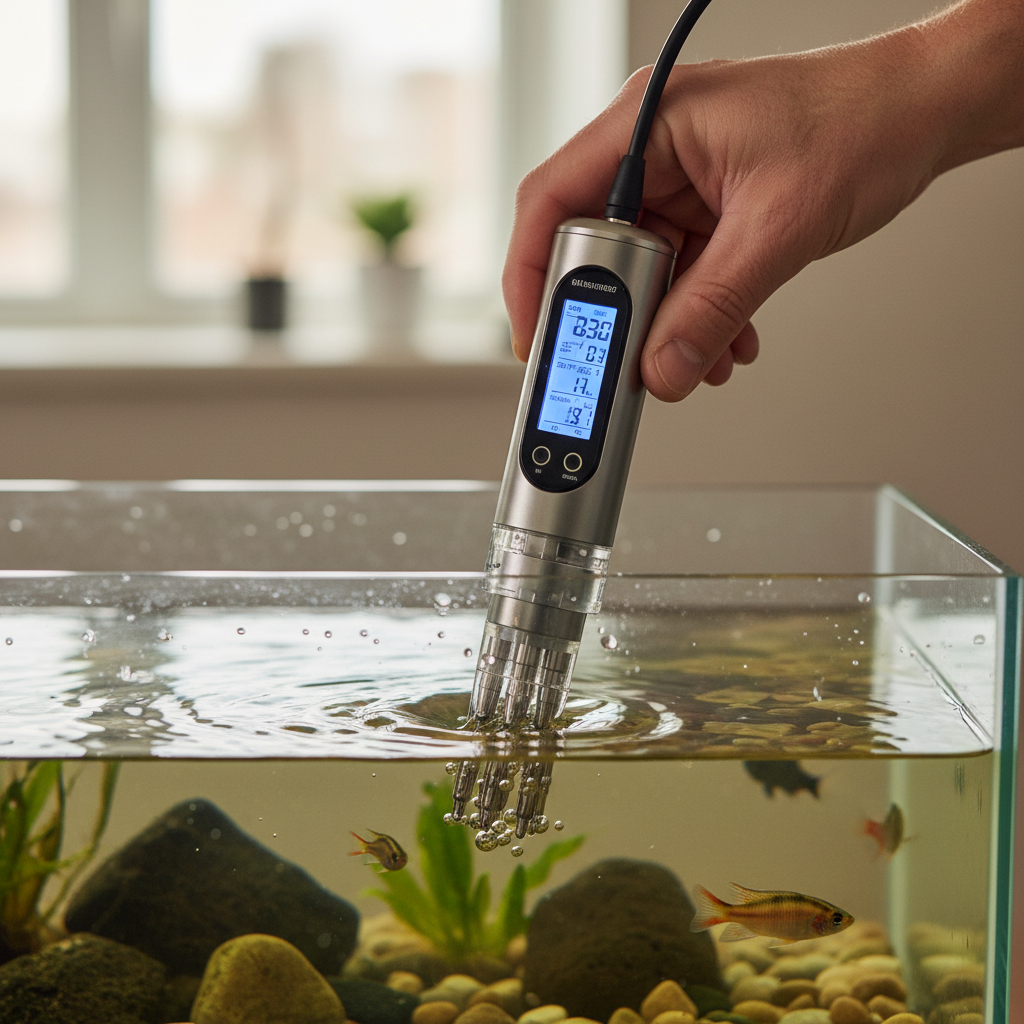
Start With Three Parameters. Ignore the Rest.
Multiparameter probes can measure 20 variables simultaneously. That sounds powerful. But a 2025 systematic review of 217 IoT water quality monitoring studies found pH in 98.2% of reviewed cases, temperature in 92.9%, and dissolved oxygen in only 62.5%. Continuous measurement of nitrogen compounds remains a significant gap in the research literature.
That distribution reflects what is deployable, not just what matters biologically. pH and temperature probes are mature and relatively stable. DO sensing requires more attention. Ammonia and TAN measurement is harder to deploy continuously and less validated under real farm conditions.
For most operations, the practical buying order is:
- Dissolved oxygen: your fastest-moving life-safety variable. If you monitor nothing else, monitor this.
- Temperature: context for everything. Metabolic rate, oxygen solubility, ammonia toxicity all shift with it.
- pH: direct stress indicator and the key modifier that determines whether your ammonia levels are safe or lethal.
Then expand based on your production system, applying the same margin-first discipline used in vertical farming optimization and the cost tradeoffs seen with indoor farming sensors:
| Parameter | What it reveals | Typical safe range (species-dependent) | When to add it |
|---|---|---|---|
| Ammonia / TAN | Fish waste accumulation, biofilter performance | Un-ionized NH₃ below 0.02 ppm for prolonged exposure | RAS, biofloc, high-density tanks, species with low ammonia tolerance |
| EC / Salinity | Dissolved mineral concentration, salinity stress | Species-specific | Brackish or marine systems, variable source water |
| Turbidity | Suspended solids, algae density, water clarity | Context-dependent | Ponds with algae management issues, biofloc systems |
| ORP | Oxidation-reduction potential, treatment effectiveness | 200-400 mV typical for healthy ponds | Systems using ozone, UV, or chemical treatment |
| Nitrite / Nitrate | Nitrogen cycle health, biofilter maturity | Nitrite below 0.5 ppm for most freshwater species | Recirculating systems where the nitrogen cycle is central |
A practical system monitors DO, temperature, and pH with validated, maintainable sensors. Then adds chemistry based on what the production system demands. Not what the brochure supports.
Every Sensor Type Has a Weakness
Three sensing approaches dominate water quality monitoring sensors, and each carries a specific maintenance liability.
Optical DO sensors use fluorescence quenching to measure oxygen without consuming it. They drift less than electrochemical alternatives and do not require electrolyte replacement. But a detailed antifouling review published in Sensors notes that optical sensors, while more resilient to data drift, have zero tolerance for a fouled optical surface. A biofilm on the window, and the reading becomes fiction. There is no alarm for “your window is dirty.”
Electrochemical sensors (galvanic or polarographic) are established across every price point. They work. They also drift more readily, consume electrolyte or oxygen during measurement, and their membranes degrade over weeks. Skip the maintenance cycle and you get slow, inaccurate readings without any obvious system alert.
Solid-state and ion-selective designs aim to reduce moving parts. Replaceable chip-based systems simplify the service model: swap a sensor chip every few months instead of maintaining a membrane. The tradeoff is a shorter field-validation history and, for some parameters, lower resolution.
No sensor technology eliminates maintenance. Each shifts where the burden falls: optical cleaning, membrane replacement, electrolyte refill, chip swap, recalibration. The right choice matches your team’s discipline, your service schedule, and your tolerance for silent drift.
Architecture Matters More Than the Probe
A sensor is one component in a four-layer system: perception (probes), network (data transport), processing (storage and filtering), and application (dashboards, alarms, actuator control). Most buying decisions focus entirely on the first layer. Most failures happen in the other three.
| Deployment approach | Best fit | Strength | Primary risk |
|---|---|---|---|
| Handheld + lab confirmation | Small ponds, commissioning, reference checks | Low fixed cost, high accuracy when used properly | Labor-intensive; misses overnight DO crashes entirely |
| In-tank continuous probe | RAS, tanks, cages, high-value biomass | Fast trend detection and alarm capability | Continuous fouling exposure, calibration drift, replacement cost |
| Sidestream / multiplexed chamber | Multiple ponds, expensive multiparameter packages | One protected station serves several water sources | Pump or valve failure creates a false sense of coverage |
| Distributed low-cost IoT nodes | Remote or widely spaced ponds, tight budgets | Spatial coverage professional sondes cannot afford | Accuracy, enclosure integrity, power, and calibration become your problem |
Connectivity determines whether data reaches you in time to act. Wi-Fi works for facilities with existing infrastructure and short distances. Cellular (GSM, LTE, NB-IoT) serves isolated sites: a tilapia pond deployment in Pune used GSM/GPRS telemetry with 15-minute sampling intervals and maintained 48-hour battery backup. LoRaWAN handles low-power, long-range communication across multiple ponds, with transmission distances reported up to 8 km in field conditions.
Then there is the sampling frequency question. The rule is simple: sample faster than the time you need to respond. If your emergency aerators take 15 minutes to recover pond DO, and you sample every six hours, you are not monitoring. You are documenting losses after the fact.
Architecture also shapes your future options. A system built on open protocols and standard data formats (MQTT, REST APIs, CSV export) lets you swap probes, add nodes, or migrate platforms as needs evolve. A closed ecosystem locks you into one vendor’s roadmap. Ask about data portability before you ask about sensor specs.
The Maintenance Budget Nobody Talks About
This is where most sensor investments quietly fail. Not at purchase. Six months later.
Biofouling is the central failure mode of any sensor submerged in productive water. Biofilm, algae, sediment, and mineral deposits accumulate on every surface: electrodes, membranes, optical windows, housings, cables. One estimate cited in a sensor antifouling review attributes up to 50% of operational budgets to biofouling management, depending on location and season.
What fouling actually does to your operation:
- Drift without visible failure. The probe reads 5.2 mg/L DO. Actual is 3.8. Your dashboard shows green. Your fish are stressed.
- Gradual signal degradation. Numbers look plausible but trend inaccurately, masking a slow deterioration until someone notices the readings stopped making biological sense.
- Complete sensor inoperability if membranes clog or electrodes corrode, turning an “always-on” system into an expensive paperweight.
Antifouling strategies include mechanical wipers, high-pressure water jets, ultrasonication, copper-based coatings, UV inhibition, and consumable solid-state sensor designs. Most real-world deployments combine several of these. None of them are free.
Then there is calibration. A freshly calibrated sensor is accurate. Two months later in warm, biologically active water, without recalibration against a reference standard, you have an expensive random number generator. Budget calibration solutions, a reference handheld meter, technician hours, and a calibration log from day one.
And do not forget the platform. Cloud-based dashboards carry subscription fees: per-device monthly charges, data storage tiers, SMS and email alert credits, API access. Ask what the system costs per year per sensor node. Not per unit at purchase.
Low-Cost IoT or Professional Sonde: When Each Fits
The field-test results for low-cost systems are better than most people expect.
An Asian seabass monitoring study used DFRobot, Atlas Scientific, and Vernier sensors with an ESP8266 module, sampling through a sidestream chamber every six hours. Over three months of validation: 98% pH accuracy and 97% temperature accuracy against reference instruments.
The Pune tilapia deployment achieved a 4.87% maximum error with 15-minute readings, Arduino-based hardware, and cellular upload. Both results are credible. Both came from teams with engineering support, controlled validation protocols, and reference-instrument comparison.
“Low-cost” does not mean “low-effort.” It means capital cost shifts to labor: enclosure design, power management, calibration discipline, firmware updates, and on-site troubleshooting.
When low-cost IoT makes sense:
- Spatial coverage across dozens of ponds where one professional sonde per pond is financially impossible
- Temperature and pH monitoring, where sensor technology is most mature and stable
- Farms with technical staff who can own the validation and maintenance cycle
- Early-stage deployments to prove the value of continuous data before committing to a platform
When professional instruments are non-negotiable:
- Life-critical DO control in high-value systems (RAS, salmon cages, shrimp hatcheries) where a bad reading triggers a bad control action
- Automated aeration or feeding loops where sensor output directly drives actuators
- Compliance, insurance, or buyer-mandated data quality standards
- Operations without on-site technical staff to maintain custom hardware
The pragmatic approach most farms eventually adopt: a professional DO instrument at the critical control point, low-cost distributed nodes for spatial temperature and pH context, and a single integration platform that ingests data from both.
What to Demand Before You Sign
Whether you are evaluating a $200 sensor node or a $20,000 multi-site platform, run through this list before committing:
- Accuracy in your water. Specification sheets reflect lab conditions. Demand a reference-instrument comparison test in your actual water type, temperature range, and salinity before final acceptance.
- Calibration protocol. How often? What standards? How long does it take? Can your team do it on-site without shipping the unit back?
- Fouling management plan. What is the cleaning method and interval? What happens to data quality between cleanings? Is there an automated wiper, or is it all manual?
- Consumables and replacement costs. Membranes, electrolyte, optical windows, sensor chips, batteries. Price these out for three years, not just at purchase.
- Data export and API. Can you extract raw timestamped readings in a standard format? Or are you locked into one vendor’s dashboard forever?
- Network and power budget. Actual cellular data cost per month, actual battery life under your sampling conditions (not ideal conditions), and what happens when the battery dies mid-cycle.
- Alarm escalation. When DO drops at 3 AM, who gets notified? SMS, email, relay trigger to aerators? What is the latency from detection to notification?
- Manual override and failsafe. If the system controls aerators or feeders, what happens when communication fails? A control system with no safe fallback state is a liability, not an asset.
- Interoperability. Can sensors from different manufacturers connect to the same platform? If you outgrow the vendor’s hardware, can you keep the data history and switch probes?
A $5,000 probe backed by a vague maintenance plan will underperform a $500 node backed by disciplined calibration and a clear response protocol. The system is only as good as the weakest link. The weakest link is almost never the sensor itself.
At Datanet, we integrate IoT environmental monitoring hardware across industries where sensor data continuity determines outcomes: aviation, maritime, agriculture. If you are building a water quality monitoring stack and need a partner who understands the full sensor-to-dashboard pipeline, reach out to our team or email info@datanetiot.com.
Frequently Asked Questions
Which water quality parameter should I monitor first on a fish farm?
Dissolved oxygen. It is the fastest-moving life-safety variable in most aquaculture systems. Mississippi State reports that catfish ponds can drop below 2 mg/L at dawn in midsummer, with low-oxygen windows lasting 3 to 6 hours. Temperature and pH should follow immediately, since both influence oxygen dynamics and ammonia toxicity. Add nitrogen compounds when stocking density or recirculating systems make them a material risk.
How often should water quality sensors take readings?
Sample faster than your response time. If your aerators need 15 minutes to recover oxygen levels, 15-minute readings are a minimum. For high-value or high-density systems (RAS, cages), continuous or near-continuous DO monitoring is the standard. A validated field system in Pune achieved reliable data quality at 15-minute intervals with cellular upload. A single midday spot check can miss the entire overnight danger window.
Are low-cost Arduino-based sensors reliable for commercial fish farming?
They can be, with conditions. Published field tests report 98% pH accuracy and 97% temperature accuracy over three months using low-cost components. Those results came from teams that validated against reference instruments, designed sealed enclosures, and maintained calibration schedules. Low-cost hardware shifts capital cost to engineering and maintenance labor. Without that investment, reliability drops fast.
What causes false alarms or silent sensor failures?
Biofouling is the most common cause. Biofilm on an optical window or electrode creates drift without a visible outage: the dashboard shows normal values while actual conditions deteriorate. Other causes include low battery, lost cellular or LoRa connectivity, pump failure in sidestream systems, and stale data that a dashboard does not distinguish from fresh readings. Monitor instrument health, not just water quality.
How much does sensor maintenance actually cost?
More than most vendors quote upfront. Research estimates attribute up to 50% of sensor operational budgets to biofouling management, depending on environment and season. Add calibration supplies, reference meters, replacement membranes or chips, technician labor, and cloud platform subscriptions. Budget the full annual cost per sensor node before purchasing, and compare that number against the biomass value at risk.
Do I need different sensors for freshwater and saltwater fish farming?
In most cases, yes. Salinity affects dissolved oxygen solubility, probe calibration curves, corrosion rates on housings and connectors, and biofouling patterns. Many DO sensors require salinity compensation to report accurate readings. Marine environments accelerate corrosion and may demand different enclosure materials. Confirm that any sensor you evaluate is rated, calibrated, and warranted for your specific salinity range and water chemistry.








 +1 508 292 2210

2 Responses