

The environmental monitoring market reached $14.4 billion in 2024 and is projected to hit $20.1 billion by 2030. Temperature and humidity monitoring sits at the center of that growth. And yet, a peer-reviewed study found that checking temperatures twice a day catches fewer than 7% of dangerous excursions.
That gap between “having a sensor” and “knowing your assets are safe” is where vaccines spoil, collections warp, compressed-air lines corrode, and audits fail. This guide covers the full chain: what temperature and humidity monitoring really involves, how accurate it needs to be, where to place the sensor, how to connect it, and what to do when the numbers go wrong.
Five Layers, Not Just a Sensor
Most people think of monitoring as a device on the wall. It’s not. It’s a system with five layers, and a gap in any one turns the rest into decoration.
Physical sensing comes first. Temperature measurement relies on RTDs (resistance temperature detectors), thermistors, thermocouples, or semiconductor elements. Vaisala considers RTDs the preferred choice for critical and regulated applications because of their accuracy and long-term stability. Humidity typically uses capacitive elements that respond to moisture absorption.
The second layer is local acquisition: a data logger that timestamps every reading and stores it at configurable intervals. NEDCC notes that electronic loggers record at user-selected intervals with finite memory, which means that local record is your evidence if the network drops or the cloud has an outage.
Communication is the third layer: Bluetooth, Wi-Fi, cellular, LoRaWAN, or wired Ethernet. The right choice depends on distance, alert speed, available infrastructure, and power. Not on which protocol sounds most modern.
Fourth, analytics and alerting. This is where raw readings become thresholds, trend lines, rate-of-change rules, and dew-point calculations. Data without interpretation is just storage. Modern environmental monitoring automation transforms these analytics into actionable workflows that reduce manual intervention.
Fifth is response and evidence. Who gets the alert? How fast must they act? How is the action documented? Without a response plan, the first four layers just produce a prettier record of a failure nobody prevented.
One distinction deserves attention here. Relative humidity (RH) is a percentage of the air’s moisture capacity at a given temperature. The same 60% RH means very different things at 20°C and 40°C. When condensation is the actual risk (cold surfaces, compressed-air lines, electronics enclosures), dew point is the more useful variable. Emerson’s AVENTICS DS1 reports pressure dew point, RH, absolute humidity, moisture content, and vapor pressure alongside temperature, because a single RH number doesn’t capture the full condensation picture.
Continuous Logging vs. Twice-a-Day Checks
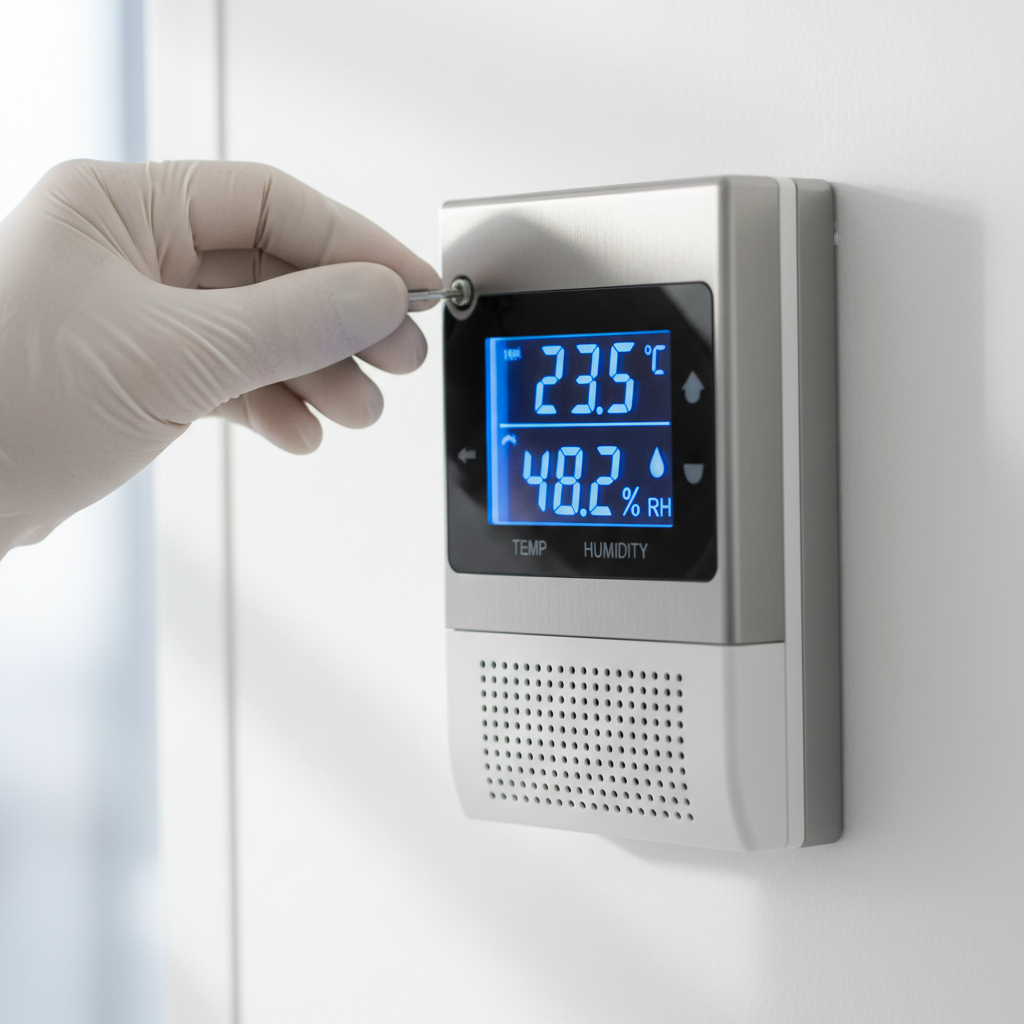
The research on this is uncomfortable. A Monte Carlo simulation evaluated how well manual-check schedules detected temperature excursions in vaccine storage units. Twice-daily current-temperature checks caught only 4.8% to 6.4% of simulated excursions. Twice-daily min/max readings improved detection to 34.8%-96.7%, but no non-continuous schedule consistently detected all events.
The authors note limitations: the simulation used household-grade storage units, human behavior was not modeled, and the sample may not represent every environment. But the directional conclusion is hard to argue with. Manual spot-checks miss excursions because excursions don’t schedule themselves around your rounds.
A museum case illustrates the same principle. At the Albany Museum of Art, once-daily handheld readings showed stable humidity. When five sensors were installed logging every 15 minutes, substantial daily fluctuations became visible for the first time, eventually leading to roughly $30,000 in HVAC corrections. (This is a vendor-reported case, but the underlying pattern, invisible swings between check-ins, is well-documented in preservation science.)
The logic is straightforward. If the shortest excursion that can damage your product lasts two hours and you check every twelve, you will miss it. Continuous monitoring with real-time environmental data doesn’t guarantee a fast response. It does guarantee you have evidence of what happened and when. That evidence is the foundation for every disposition decision, audit response, and root-cause investigation.
Accuracy, Drift, and Calibration: Reading the Specs Right
Three numbers define sensor quality. Most spec sheets only emphasize one.
Accuracy is how close to the true value a sensor reads at calibration. Drift is how far it wanders over time. Uncertainty is the complete range within which the true value sits, accounting for all error sources. Sensirion’s testing guide treats calibration accuracy, hysteresis, and long-term drift as distinct characteristics. Confusing them leads to purchasing decisions that look sound on paper and fail in the field.
For regulated cold chains, CDC recommends sensors with uncertainty of ±0.5°C and a current calibration certificate, with recalibration generally every one to two years. For preservation environments, NEDCC reports field performance around ±3% RH for temperature-compensated loggers and ±3%-5% for standard electronic meters.
Drift is the spec most buyers ignore. In mild lab conditions, polymer humidity sensors drift slowly and predictably. In harsh environments, the story changes fast. A USDA-funded project tested commercial polymer sensors at 90°C and 80% RH and documented 8% drift in a single month. That’s not a defective product. That’s a sensor operating outside the benign conditions where its specification was measured.
NIST’s primary Hybrid Humidity Generator can calibrate instruments across 2%-98% RH from -34°C to 85°C, with expanded uncertainty below 0.025°C for dew point. Those are calibration-facility numbers. Your warehouse, freezer, or shipping container is not a NIST lab. The gap between calibration-day accuracy and six-months-in-the-field performance is where monitoring quietly becomes fiction.
Budget for recalibration before you deploy. Match the schedule to the consequences of a wrong reading. If a false “safe” could cost $50,000 in spoiled product, quarterly co-location checks against a reference instrument are cheap insurance.
Picking Connectivity and Placement
Two decisions shape the usefulness of a monitoring system more than the sensor brand: how the data travels, and where the sensor sits.
Match the protocol to the problem
Bluetooth works within about 30 meters and requires someone (or a gateway) in range to collect data. Onset’s HOBO MX1101, for example, supports local download via HOBOconnect within 100 feet. That suits mapping studies, portable assessments, and offline-first environments where real-time alerting isn’t the priority.
Wi-Fi fits facilities with existing network coverage and stable power. Testo is migrating its Saveris logger family to a cloud Wi-Fi platform through mid-2026, reflecting the broader shift toward always-connected monitoring. The trade-off: Wi-Fi depends on infrastructure that may not exist in a remote warehouse, container yard, or field depot.
Cellular covers assets that move or sit where no local network exists: shipping containers in port, cold-chain trailers in transit, remote equipment shelters. This is the backbone of remote environmental monitoring, where coverage without local IT is the upside. Per-device data cost and battery management are the constraints.
Wired connections (Ethernet, PoE, Modbus) deliver industrial reliability and eliminate battery concerns entirely. Installation cost and reduced flexibility are the trade-offs. The right choice depends on whether the monitoring point is permanent or the assets (and the sensors) travel.
The sensor measures where it sits, not where you wish it did
CDC’s vaccine storage toolkit requires a buffered probe at the center of the storage unit, surrounded by product, with the display outside so you don’t open the door to check. NEDCC recommends keeping sensors away from floors, direct vents, HVAC equipment, doors, and windows unless those influences are specifically what you’re studying.
A sensor on the wall beside the HVAC return reads what the thermostat sees. The far corner of the room, the top shelf of the freezer, the area near the loading dock: these can differ by several degrees. Map the space before committing to permanent monitoring points. Deploy temporary loggers in multiple positions, run them through a representative period, and identify where gradients live. Then install permanent sensors at the points that represent your true risk.
Thresholds by Industry: Stop Guessing, Start Specifying
“Keep it at room temperature” is not a monitoring plan. Thresholds need to trace back to what you’re protecting.
| Application | Temperature | RH / moisture | Key consideration |
|---|---|---|---|
| Vaccine refrigerators | 2°C to 8°C | Not primary | Excursion duration determines disposition, not just peak temperature |
| Ultra-cold vaccine storage | -90°C to -60°C | Not primary | Specialized DDLs required; standard loggers won’t reach this range |
| Data centers (ASHRAE A1-A4) | 18°C to 27°C recommended | Below 60% upper moisture | Verify the current ASHRAE class for your hardware before adopting a generic target |
| Museums and archives | Stability over absolute value | 30%-55% RH typical | Rate of change matters more than hitting a fixed number |
| Food processing (high-temp) | Process-specific; can exceed 90°C | Often above 80% RH | Polymer sensor drift accelerates in hot, wet conditions |
| Compressed-air systems | Varies by process | Dew point is the control variable | RH misleads when condensation is the actual failure mode |
A note on data centers: the numeric ranges above come from secondary summaries, not from ASHRAE’s published standard directly. Operators should verify the current class and equipment specification before adopting a number found in a web summary. ASHRAE’s data-center resources cover environmental guidelines, cooling, and the ANSI/ASHRAE Standard 90.4-2025.
For museums and archives, absolute values matter less than consistency. A collection held at a steady 50% RH is generally safer than one swinging between 40% and 60% twice a day. NEDCC recommends collecting at least a year of continuous data before making major building-system changes, because conditions shift by season in ways a single month of readings will not reveal. The same stability challenge appears in controlled-growth spaces, where vertical farming humidity control shows how moisture management directly affects energy costs. See also the article: Environmental Monitoring for Agriculture: What Pays Off.
Three Ways Monitoring Becomes Theater
I’ve seen all three of these in the field. More than once.
The first is deploying sensors without a drift budget. You install 50 devices. Year one, they’re accurate. Year two, you don’t know. Year three, some read 5%-8% off and you’re making cold-chain decisions on numbers that quietly became fiction. The fix is straightforward: budget for recalibration, periodic co-location checks against a reference instrument, or planned replacement before you buy the first batch.
The second is setting thresholds from a web search instead of the asset’s actual specification. “Keep the warehouse between 18 and 25°C” means nothing if the product allows 15-30°C (you’ll drown in false alarms) or requires 2-8°C (you’ll miss the excursion that matters). Every threshold should trace to a product datasheet, a preservation standard, or a regulatory requirement. Not to a comfortable guess.
The third is having no documented response plan. An alert that nobody acts on is noise. A $2,000 sensor that emails a shared inbox at 3 AM isn’t monitoring. It’s logging with an optimistic assumption about human behavior. Define who receives each alert, how fast they must acknowledge, what action they take, and how the action gets recorded. CDC’s vaccine guidance provides a clean model: label, separate, investigate, document.
Building Monitoring That Holds Up
A sensor purchase is not a monitoring solution. The solution includes the sensor, its calibration record, its placement rationale, the data path to your dashboard, the alert logic, the response workflow, and the audit trail. Skip any layer and you’ll find the gap when it costs the most.
The most reliable approach I’ve seen across 15+ years of IoT deployments is tiered. Reference-grade or recently calibrated sensors sit at your most critical monitoring points. Lower-cost nodes add spatial coverage across a larger area. The lower-cost nodes get periodically co-located with the reference and flagged automatically when they diverge beyond tolerance. You get both confidence and coverage without overspending on either.
Cloud platforms add centralized visibility, multi-site comparison, and escalation paths. They also bring subscription costs, network dependency, and data-governance considerations. A well-designed system keeps local buffering (edge storage) so a network outage doesn’t punch a hole in your environmental record.
At Datanet, we design environmental monitoring as a complete system: sensor selection matched to your operating conditions, connectivity that fits your infrastructure, platform integration, and a calibration plan that keeps the data trustworthy over time. For distributed sites without local network coverage, wireless environmental monitoring keeps the data flowing where wired infrastructure isn’t practical. If you’re evaluating hardware, our environmental tracking device catalog covers the range from facility monitoring to field deployment.
When monitoring needs to follow assets through transit, dwell, and return, environmental tracking and asset tracking converge. That’s where the full operational picture takes shape.
If your current setup has blind spots you can feel but not prove, talk to our team or reach us at info@datanetiot.com.
Frequently Asked Questions
What is temperature and humidity monitoring?
It is the continuous or periodic measurement and recording of thermal and moisture conditions using sensors, data loggers, and (in modern systems) cloud platforms with real-time alerting. The purpose is to detect environmental excursions that could damage products, equipment, or collections before the damage becomes irreversible.
How often should a monitoring sensor record?
There is no universal interval. CDC guidance recommends at least every 30 minutes for vaccine storage. The right frequency depends on the shortest excursion that could cause harm in your specific application. Faster sampling captures more events but increases storage, battery consumption, and alert volume.
What accuracy do I need for temperature and humidity sensors?
Match the sensor’s uncertainty to the width of your acceptable range and the cost of a wrong reading. CDC recommends ±0.5°C for vaccine storage. NEDCC reports field humidity accuracy of ±3%-5% for common instruments. When a false “safe” reading could destroy $50,000 in product, tighter accuracy and more frequent calibration are worth the investment.
Where should I place a temperature and humidity sensor?
At the location the asset actually experiences, not where mounting is easiest. Avoid walls near HVAC returns, doors, windows, and floor level unless you are specifically measuring those influences. Map the space with temporary loggers first to identify thermal and moisture gradients, then install permanent sensors at the points that represent your real risk.
Is a wireless cloud monitor better than a standalone data logger?
They serve different needs. Standalone Bluetooth loggers suit portable mapping studies and offline environments. Cloud-connected systems (Wi-Fi or cellular) are stronger for distributed, multi-site operations that need real-time alerting and centralized reporting. For high-stakes environments, combine cloud connectivity with local buffering so a network outage doesn’t create a gap in your record.
What should happen after a temperature or humidity excursion?
Separate affected product immediately and label it as not for use until investigated. Determine the excursion’s duration and magnitude from the logged data. Verify sensor calibration and placement. Investigate the root cause (power failure, door left open, HVAC fault). Document the event, every action taken, and the final disposition decision.







 +1 508 292 2210

One Response