

A temperature reading of 28°C means nothing by itself. That same number in a tilapia pond at dawn and a salmon cage at noon demands opposite responses. In aquaculture temperature monitoring, the probe is the easy part. The hard part is everything that happens after the number hits a screen.
Aquaculture now supplies 103 million tonnes of aquatic animals annually, representing 53% of global aquatic-animal production. At that scale, a thermal event measured in hours can destroy months of biomass. Summer mortality syndrome in tilapia alone has caused 30% to 70% stock losses, sometimes reaching 100%. These catastrophes don’t happen because nobody measured temperature. They happen because the measurement didn’t trigger the right action fast enough.
I’ve spent over 15 years deploying IoT systems across industries where a missed reading costs real money. Aviation, logistics, maritime. Aquaculture is no different in principle: the sensor is just the first link in a chain, and the weakest link determines the outcome. This guide covers what most vendor pages skip: the temperature-DO interaction that kills more stock than temperature alone, sensor accuracy in pond conditions versus lab conditions, placement and maintenance realities, and how to convert alerts into decisions. Whether you run a hatchery, manage open ponds, or operate recirculating aquaculture systems (RAS), the goal is the same. Close the loop between what the sensor reads and what your team does next.
Temperature Alone Is Misleading. Here’s Why.
The single most dangerous assumption in aquaculture monitoring is that temperature is a standalone parameter. It isn’t. Temperature drives dissolved oxygen (DO) solubility, metabolic rate, feed conversion, immune function, and pathogen virulence. A temperature reading without context is a number without meaning.
Consider a hard-clam example from the University of Florida: 4.0 mg/L of dissolved oxygen at 21°C corresponds to only 53% saturation. At a different temperature, that same oxygen concentration means something entirely different for the animal. The physics are straightforward. Warmer water holds less oxygen while the animal’s metabolism demands more of it. That convergence is where mortality events begin.
A review of summer mortality in cultured tilapia connects the chain explicitly: high temperatures drive low DO, which impairs immunity, which opens the door to secondary bacterial infection. Proposed responses include water management, nutrition, vaccination, and active monitoring. The point is that temperature monitoring without concurrent DO checking, and without a prescribed intervention, is documenting a disaster rather than preventing one.
Heavy rainfall on warm days compounds the problem. Research on climate change and inland freshwater aquaculture shows that acute temperature changes from rain events on warm days exacerbate stress in ways a steady-state reading won’t predict. Your system needs to detect rate of change, not just absolute value.
Species context matters as much as physics. Coldwater species typically cannot tolerate temperatures above 20 to 25°C, while warmwater species usually will not reproduce below 20°C. Those are broad guideposts, not prescriptions. Strain, life stage, acclimation history, salinity, stocking density, and disease status all shift the actual threshold. The correct alarm setting is a biological and operational decision for your specific farm, not a default in an app.
Five Layers of a System That Actually Works
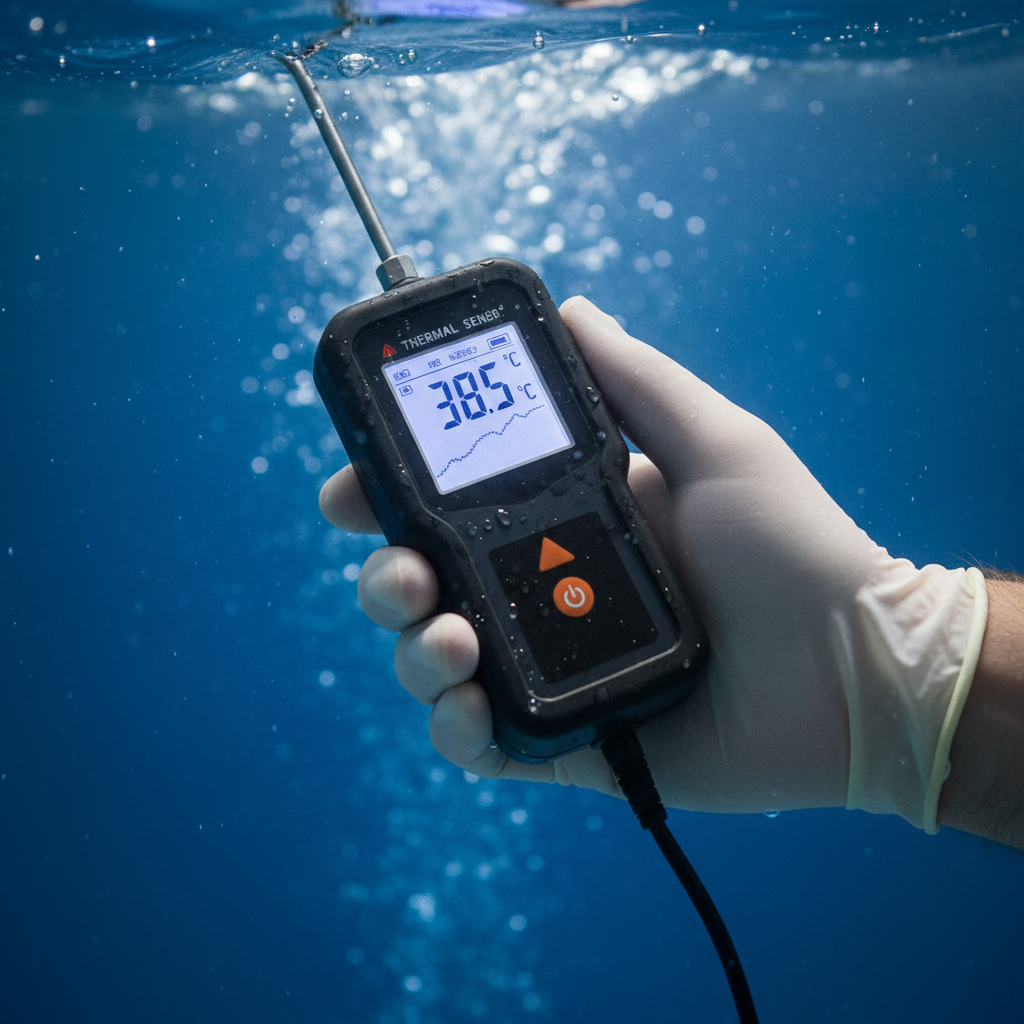
Most vendor pages emphasize the sensor and the dashboard. But a working aquaculture temperature monitoring system has five layers, and the weakest one determines whether stock lives or dies.
| Layer | Function | The question most farms skip |
|---|---|---|
| Sensor | Measures temperature, ideally with DO, pH, salinity, conductivity | Is the probe rated for your water chemistry, fouling rate, and cleaning frequency? |
| Edge device | Reads, timestamps, filters, and stores data locally | Does it retain data during connectivity outages and reject implausible spikes? |
| Connectivity | Transmits via cable, Wi-Fi, cellular, LoRaWAN, or satellite | Is coverage reliable at every pond, cage, and hatchery tank, including at 3 AM? |
| Cloud and interface | Displays trends, manages users, sends alerts | Can the right person see the right tank, threshold, and acknowledgment status from a phone? |
| Response | Triggers aeration, water exchange, feed adjustment, or escalation | Is there a written action for each alert, with a named owner and a time limit? |
A 2025 IoT prototype study describes exactly this chain: power unit, sensor unit, cloud server, database, and mobile application. The system reported 99.1% temperature accuracy at a prototype cost of $216.29. But it also reported occasional malfunctions from loose electrical connections. The sensor worked. The wiring didn’t. That’s a Layer 1 failure that no cloud dashboard can fix.
I see this pattern across every industry we work in, from cold chain to vertical farming temperature monitoring. A client invests in high-precision hardware but deploys it on unreliable power, or installs it in a location with intermittent cellular coverage, or builds no escalation path for off-hours alerts. The system “works” in the sense that data flows when conditions are perfect. It fails exactly when the reading matters most.
The most comprehensive IoT-aquaculture review published to date (covering 217 articles) identifies sensor maintenance and rural connectivity as persistent, unsolved challenges. Related research grew 74.79% between 2020 and 2024, which proves interest, not deployment maturity. If your farm sits in a connectivity dead zone or your staff doesn’t know what to do when an alert fires, no amount of sensor precision matters.
Sensor Accuracy: Lab Specs vs. Farm Reality
Every sensor has a data-sheet accuracy number. Very few of those numbers survive contact with a real pond.
An Asian seabass hatchery study offers a useful reality check. Researchers built a low-cost IoT system for a 10-ton hatchery tank, combining an ESP8266 controller, Arduino components, and ThingSpeak for visualization. They measured temperature alongside pH, ammonia, DO, and electrical conductivity. After three months of validation against a YSI Professional Plus reference instrument, they reported 76% to 97% accuracy with 0.27% to 4% relative error after calibration.
Two things stand out. First, calibration against a reference instrument made the system usable. Without it, the raw readings carried unknown error. Second, the accuracy range is wide because different parameters behave differently in different water conditions. Temperature was among the more reliable channels. pH and ammonia were harder to stabilize.
The 2025 IoT prototype that reported 99.1% temperature accuracy achieved that figure in a controlled test environment. The authors themselves flagged occasional malfunctions from loose electrical connections. In a real farm, add biofouling, sediment, UV degradation, cable corrosion in saltwater, temperature drift over months, and battery depletion. The gap between “works in the lab” and “works reliably in a pond for 18 months” is where most monitoring investments break down.
Before you buy, ask five questions:
- What reference instrument was used for validation, and in what water chemistry?
- What is the calibration interval, and can it be done without pulling the sensor offline?
- What is the documented drift rate over 6 and 12 months in saline or nutrient-rich water?
- What is the missing-data rate in the vendor’s own field deployments?
- What happens to stored data when connectivity drops?
If the vendor can’t answer those with field data rather than lab specs, the accuracy number on the brochure is a starting point, not a promise.
Placement and Maintenance: The Problems After Installation
Sensor placement is where many monitoring projects go wrong before they collect a single useful data point. One probe bolted to an accessible wall bracket may be convenient for maintenance. It may also be measuring a dead zone that doesn’t represent what the animals are experiencing.
Published guidance from commercial monitoring systems recommends placing pond probes at roughly 60% to 80% of water depth and, in RAS configurations, positioning sensors at the sump, biofilter outlet, and fish-tank return. Those are starting points. Adapt them to your circulation pattern, aeration placement, feed zones, inflows, and stratification. A probe sitting in an aeration bubble stream will report higher DO than the animals 10 meters away.
Validate placement during the first weeks of operation by comparing readings from multiple positions in the same pond or tank. If they disagree significantly, your single-point measurement is unreliable regardless of probe quality.
Maintenance is where monitoring projects go to die quietly. Four realities that vendors rarely discuss upfront:
Biofouling. In nutrient-rich water, algae and biofilm coat sensors within weeks. The reading drifts gradually: no alarm, just slowly worsening data quality. A cleaning schedule (weekly in warm, productive water; monthly in cleaner systems) isn’t optional. It’s part of the operating cost.
Calibration drift. Even quality probes drift. pH sensors are especially prone. Temperature probes are more stable but not immune, particularly at the extremes of their range. Schedule recalibration against a reference instrument at defined intervals, and log every event.
Power. Solar panels get dirty. Batteries degrade in heat. A monitoring system that goes dark at night in summer, exactly when DO drops fastest, is worse than useless because it creates false confidence. Dimension your power supply for worst-case conditions (consecutive cloudy days, winter solar angles, peak cellular transmission), not average conditions.
Spares. When a probe fails, the question is whether you have a replacement on site or whether you’re waiting two weeks for shipping. Budget for spares as part of the system cost, not as an afterthought.
Treat calibration, cleaning, power management, spare parts, and data-quality checks as recurring operating expenses. They belong in the annual budget alongside feed and labor, not buried in a one-time capital line item.
From Alerts to Decisions: Closing the Loop
A dashboard full of green indicators doesn’t save fish. A 3 AM alert that nobody responds to doesn’t save fish either. The value of aquaculture temperature monitoring lives entirely in the response protocol.
A 2025 study built a random-forest model that combined sensor data (temperature, salinity, conductivity, chlorophyll-a, turbidity, DO) with farmers’ daily records to classify five mortality-risk levels. It reported 78.6% overall accuracy with precision above 70% for each risk class. Promising, but the underlying operational data were confidential and future updates were expected. This is a decision-support tool, not a guarantee.
A peer-reviewed review published in 2026 describes systems that combine real-time environmental data with machine learning to predict hazards and automate responses like oxygen regulation. The same review warns that investing in AI without task-level integration may not improve efficiency. AI without a clear workflow is expensive noise.
What a practical response protocol looks like:
- Define thresholds by species, life stage, and season. A juvenile shrimp tank in summer needs different limits than a broodstock tank in winter. Don’t use a single default across the farm.
- Assign every alert to a named person with a time limit. “The system sends alerts” is not a plan. “João acknowledges within 15 minutes or it escalates to Maria” is a plan.
- Prescribe the action, not just the notification. Temperature above X and DO below Y: start emergency aeration and reduce feed by 50%. Temperature rising at Z degrees per hour: check aerator function and prepare water exchange.
- Log every response. What was the alert, who responded, what was the outcome. Without this record, you can’t improve the protocol, and you can’t use the data for compliance or certification.
- Test the chain monthly. Simulate a critical alert. Did it reach the right person? Did they know what to do? Did the aerator actually start?
The strongest monitoring architecture layers local probes with regional forecasting. NOAA’s Coastal Aquaculture Planning Portal provides real-time and forecast environmental data for marine operations, including climate-impact analysis through its Actea tool. A regional forecast tells you a heat event is coming in three days. Your in-tank probes tell you what the animals are experiencing right now. Use both: forecasts for preparation, local sensors for confirmation and intervention.
Choosing a System: Three Questions That Matter More Than Specs
The commercial landscape for aquaculture monitoring is fragmented. Vendors range from scientific instrument manufacturers to IoT startups to cloud analytics platforms. Each optimizes for a different bottleneck: measurement breadth, remote telemetry, rapid deployment, or predictive analytics.
Rather than comparing feature lists (which all look impressive on paper), ask three questions:
1. What is my actual operating environment?
Saltwater corrodes differently than freshwater. A cage in open ocean has different connectivity needs than an indoor RAS. A remote shrimp pond in Southeast Asia has different power availability than a hatchery in Norway. The best sensor in the world fails if it can’t survive your water, reach your network, or stay powered through the night.
2. What is my response capability?
If you have 24/7 on-site staff with training and backup aerators, a simple alert system may be sufficient. If your ponds are unmanned at night, you need a system that can trigger automatic aeration or escalate through multiple contacts until someone responds. Match the monitoring system to your response infrastructure, not to a brochure scenario.
3. What evidence will I need in 12 months?
Some operations need exportable data for environmental compliance, food-safety certification, or insurance claims. Others need integration with feed-management or ERP systems. If you’ll need structured, auditable data, buy for that requirement now. Retrofitting data exports onto a system designed only for real-time alerts is painful and expensive.
The precision aquaculture market is estimated at $847.9 million in 2025, growing to $1.43 billion by 2030. That number includes automation, analytics, imaging, and farm management, not just sensors. Before using a market-growth figure to justify a purchase, ask the vendor to define what portion of that market their product addresses, and what the recurring software and maintenance costs will be over three years.
Require a pilot. Install in one pond or tank, run for 60 to 90 days, validate against a reference instrument, test the alert chain end-to-end, and define specific pass/fail criteria in writing. A vendor confident in their system will agree. One that won’t should raise questions.
Where Datanet Fits
At Datanet IoT Solutions, we deploy environmental tracking systems across industries where sensor reliability, connectivity, and maintenance discipline aren’t negotiable: aviation, maritime, industrial supply chain, and environmental monitoring. The principles are the same whether you’re tracking temperature in a cargo hold or a shrimp pond. The sensor is only as good as the data chain behind it.
If your aquaculture operation needs help closing the gap between probes and decisions, explore our environmental tracking devices or talk to our team. We build end-to-end, not just hardware drops.
Frequently Asked Questions
What temperature range should I maintain for aquaculture?
There is no universal set point. Coldwater species (salmon, trout) typically cannot tolerate temperatures above 20 to 25°C, while warmwater species (tilapia, catfish, shrimp) usually will not reproduce below 20°C. Set thresholds by species, life stage, acclimation history, and local water chemistry. Validate against your own growth, feed conversion, and mortality data rather than relying on generic ranges.
Is temperature monitoring enough by itself?
Rarely. Temperature directly affects dissolved oxygen solubility, metabolic rate, and immune function. At 21°C, 4.0 mg/L of DO represents only 53% saturation. The same oxygen level at a different temperature has a different biological impact. A practical minimum for intensive production is temperature plus DO, with pH and salinity added when the production system demands it.
How accurate do aquaculture temperature sensors need to be?
It depends on your threshold margin and the cost of a false alarm versus a missed event. Published field results range from 76% to 99% accuracy depending on the sensor, calibration method, and water conditions. Ask vendors for validation data from actual farm deployments, including drift rate, missing-data rate, and performance after fouling, not just lab specifications.
Can AI prevent fish mortality automatically?
AI can classify mortality risk and, in some systems, trigger automatic responses like aeration. A 2025 random-forest model achieved 78.6% accuracy across five risk levels. But AI without a validated response protocol and manual override is dangerous. Start with explainable alerts and human decisions. Add closed-loop automation only after local testing, redundancy, and documented fail-safe procedures.
How often should aquaculture sensors be cleaned and calibrated?
In nutrient-rich or warm water, clean probes weekly. In cleaner systems, monthly may suffice. Calibrate against a reference instrument every 30 to 90 days, depending on manufacturer guidance and your own observed drift. Log every cleaning and calibration event. Biofouling causes gradual accuracy loss that won’t trigger an alarm but will silently degrade your data.
Where should temperature sensors be placed in a pond or tank?
Place sensors where the reading represents the animal’s actual environment. General guidance puts pond probes at 60% to 80% of water depth. In RAS, position them at the sump, biofilter outlet, and fish-tank return. Avoid dead zones, aeration bubble streams, and direct inflow areas. During the first weeks, compare readings from multiple positions to verify your placement is representative.







 +1 508 292 2210

3 Responses