

A wall-mounted sensor reads 23°C. The dashboard glows green. But the canopy on the third rack sits at 26.5°C because LED drivers above it push more heat than the airflow can clear. The root zone runs at 19°C. Relative humidity crept past 78% twenty minutes ago, narrowing the vapor pressure deficit (the force driving transpiration) below what healthy plants need. And the HVAC system is consuming 30 to 40% of total facility energy to hold that single, misleading 23°C number steady.
This is the real vertical farming temperature monitoring problem. Not “which sensor do I buy.” It is a decision-architecture problem: what to measure, where to measure it, what to do when a reading breaks range, and how to connect every data point to both crop quality and operating cost.
I’ve deployed IoT sensors for over 15 years in environments that punish electronics: maritime containers, aviation ground support, industrial supply chains. Vertical farms look cleaner, but persistent humidity, heat cycling, and LED-driven electromagnetic noise make them surprisingly hostile for sensors. The physics of keeping hardware alive and data honest doesn’t change whether you’re tracking a ULD or monitoring basil on a rack.
Here is what the monitoring actually requires, from the measurement layer up.
Temperature Is More Than One Number
A vertical farm contains at least four distinct thermal zones. Mixing them up is the fastest way to misread crop health and waste energy correcting the wrong problem.
- Ambient air is what room sensors capture. Useful for building-level HVAC, but it tells you almost nothing about what the plant experiences three racks up.
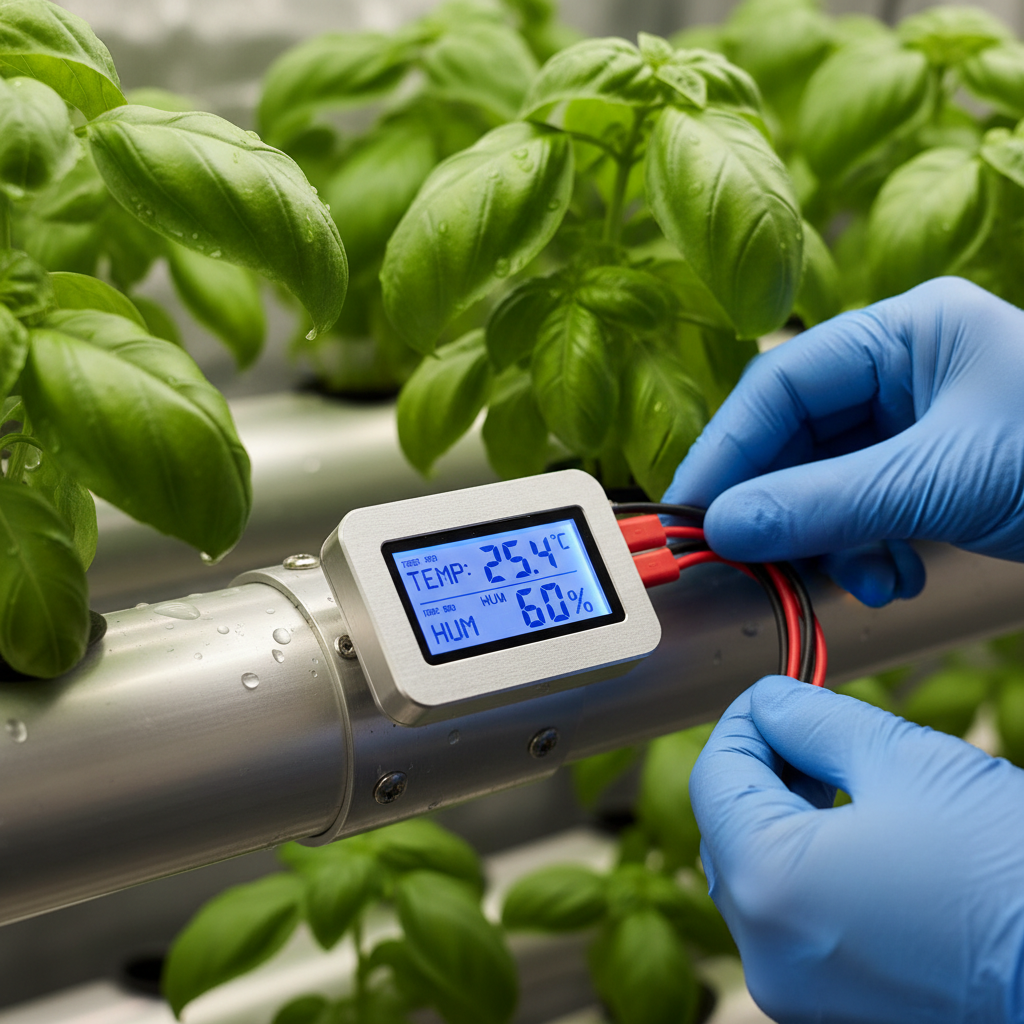
- Canopy-height air sits in the boundary layer around leaves, where transpiration, LED radiation, and airflow converge. This is the temperature your crop recipe should reference.
- Leaf surface temperature reflects the plant’s real thermal and water status. Emerging work has applied infrared thermography to detect stress in vertical-farm basil before visible symptoms appear.
- Root-zone temperature describes conditions around the roots or nutrient solution. Air sensors above the rack cannot see it. A recent study developed air-source heat pump root-zone control precisely because this hidden zone is so often ignored.
In a stacked system with high-intensity LEDs, the gap between ambient air and upper-rack canopy can exceed 3°C. LEDs and electronic equipment add sensible heat, while transpiring plants add latent heat as water vapor. When humidity climbs past the crop’s useful range, transpiration slows, nutrient uptake stalls, and fungal pathogens find their opening.
Temperature monitoring without humidity data is like tracking a container’s GPS without knowing if the door is open. You see location, not condition. The real control target is a stable relationship among temperature, humidity, and VPD, tuned to the crop and growth stage.
| Measurement Layer | What It Tells You | Where It Falls Short |
|---|---|---|
| Ambient air (room) | General space condition, HVAC baseline | Hides rack-level gradients; says nothing about the plant |
| Canopy-height air | Conditions near the leaf boundary layer | Varies by rack and position; one sensor per room is not enough |
| Leaf surface | Plant thermal state, early stress signal | Requires thermal imaging or contact probes, calibration, and defined action thresholds |
| Root zone | Nutrient solution or substrate temperature | Invisible to air sensors; installation is crop- and substrate-specific |
Best practice places air sensors near the center of the growing space at crop height. Not on a wall, not beside the door, not next to a supply vent. Then validate across multiple rack levels, because LEDs and power supplies create thermal stratification that a single probe misses entirely.
Crop Setpoints From Real Research
There is no universal temperature for a vertical farm. Every species, often every cultivar, has a preferred window that shifts with growth stage, photoperiod, and the interaction of temperature with humidity and CO2.
Published research gives us working baselines:
| Crop | Day Temp | Night Temp | RH | CO2 | Source |
|---|---|---|---|---|---|
| Lettuce and basil | 24 ± 2°C | 24 ± 2°C (constant) | 50 to 60% | 450 ppm | NIH growth-optimization study |
| Butterhead and leaf lettuce | 22 to 26°C | 20 to 24°C | Not reported | Not reported | HortScience cultivar study, 2025 |
Two things stand out. First, the day/night differential matters. Lettuce generally benefits from a cooler night that reduces respiration and energy waste. Second, these numbers are starting points, not commandments. Your cultivar, light recipe, airflow pattern, and root-zone conditions will shift the optimum. Run trials, measure saleable yield (not just biomass), and log the environmental conditions that produced your best lot.
The monitoring implication is direct: your platform needs crop-specific schedules with day and night setpoints, zone-level granularity, and the ability to record setpoint, actual reading, duration outside the band, and what happened next. Without that context, a temperature log is just a spreadsheet that proves something went wrong after you’ve already lost the harvest.
Where Sensors Go and Why They Fail
Placement is the easy part. Put sensors at crop height in representative locations. Add coverage at multiple rack levels. Keep them away from doors, supply vents, and direct LED exposure. Validate the map periodically by moving a reference probe through the space and comparing readings. Most growers get this right within the first month.
The harder question is why sensors stop telling the truth after month three.
Vertical farms maintain humidity levels that would be classified as corrosive in many industrial environments. Water vapor condenses on circuit boards. Connectors oxidize. Probe coatings degrade. In my experience deploying IoT hardware across maritime, aviation, and industrial settings, the number one cause of bad data is not the sensor’s spec-sheet accuracy. It is what happens to that sensor after six months in a warm, humid space that cycles between light-on heat and light-off cooling several times a day.
Four failure modes show up repeatedly:
- Calibration drift. A sensor rated ±0.3°C out of the box can drift past ±1°C within a year in high humidity if nobody recalibrates it. Budget for quarterly calibration checks at minimum.
- Electromagnetic interference from LED drivers. High-frequency switching power supplies generate noise that distorts readings from nearby analog sensors. Shielded cables and physical separation help. So does choosing digital-output sensors with on-board signal conditioning.
- Corrosion and condensation on connectors. This kills more sensors than electrical faults do. IP65-rated or better enclosures and conformal coating on PCBs extend life significantly.
- Phantom readings operators learn to ignore. When a sensor drifts or gives intermittent spikes, the most common response is not repair. It is a mental filter: the operator stops trusting it and starts guessing. That is worse than having no sensor at all.
None of this appears on a spec sheet. It shows up in your crop loss data.
From Alert to Action
Most monitoring content on the internet stops at “set up alerts.” That is about 30% of the job.
The real question: when a sensor reads 28°C on rack five, what does the operator (or the automated system) do in the next 90 seconds? If the answer is “check the dashboard and figure it out,” you don’t have a monitoring system. You have an expensive thermometer.
A monitoring system that works includes predefined response protocols tied to specific conditions:
- When temperature rises more than 2°C above setpoint for over 5 minutes, increase airflow to the affected zone. If no response within 10 minutes, reduce LED intensity on that rack. Log the incident.
- When temperature drops more than 3°C below setpoint, check for HVAC overcorrection or compressor fault. Switch to backup heating if available. Flag for maintenance review.
- When temperature swings more than 4°C in under 10 minutes, equipment failure is likely. Trigger an immediate alarm (not just a dashboard notification). Isolate the zone if architecture allows.
- When humidity crosses 75% alongside rising temperature, activate dehumidification, increase air exchange, and check for blocked condensate. This combination creates the fastest path to fungal outbreak.
The critical design choice is where alarm logic lives. A published IoT vertical-farm architecture used 15-minute sensor acquisition and 30-minute cloud refresh intervals. That is adequate for trend analytics. But a compressor that trips at 2:00 AM needs a local alarm that fires in seconds, not a cloud notification that arrives half an hour later (or not at all if the internet connection dropped). Effective vertical farming automation integrates monitoring with immediate response protocols.
Local control and alarm logic for safety. Cloud analytics for optimization, reporting, and multi-site comparison. This is not an either/or question. Build both layers.
Every Degree Is an Energy Decision
HVAC is not just a line item. It is the line item. And the stakes are not theoretical.
A 2025 energy benchmark puts current lettuce production at 10 to 18 kWh per kilogram, with a technical best-practice target of 3.1 to 7.4 kWh per kilogram. That gap represents the distance between a farm that reaches profitability and one that doesn’t. AeroFarms filed for Chapter 11 in 2023. Bowery Farming shut down in late 2024. Energy cost is consistently cited as a primary margin killer in post-mortem analyses.
Temperature monitoring connects to this problem in four specific ways:
- Setpoint precision vs. setpoint necessity. Holding ±0.5°C when the crop tolerates ±2°C means the HVAC cycles harder, compressors run longer, and energy spend climbs with zero yield benefit. Know your crop’s actual tolerance, not the tightest number a controls engineer can achieve.
- Heat recovery. The heat your HVAC removes from the grow room is not waste if the facility has dehumidification needs, water heating, or adjacent zones that need warmth. Integrated systems that reuse waste heat can reduce net consumption significantly compared to separate cooling and heating loops.
- Rack-level zoning. Not every rack grows the same crop or the same growth stage. A single building-wide setpoint forces the HVAC to overshoot some zones and undershoot others. Distributed sensors feeding zone-level controls cut that waste.
- Day/night differential. Dropping night temperature by 2 to 4°C reduces HVAC load during non-productive hours while actively benefiting many leafy crops. Without separate day and night setpoints, you pay to maintain a temperature the crop doesn’t even need at night.
The monitoring ROI is straightforward. If your sensors and controls reduce kWh per kilogram by even 10 to 15%, payback is measured in months. A published container-farm case estimates total infrastructure at approximately EUR 140,000 and payback at three to five years. Better temperature control shortens that window.
Building a Monitoring System Without Lock-In
The biggest risk in vertical-farm monitoring is not picking the wrong sensor. It is building a system where replacing one component means replacing everything.
The pattern I see across industries (aviation, maritime, supply chain) repeats in indoor farming. A vendor sells a sensor that only talks to their gateway, which only feeds their cloud platform, which only exports reports in their format. Two years in, the grower wants to add a root-zone probe from a different manufacturer, switch cloud providers, or export historical data for a new analytics tool. They can’t, because the architecture was designed for lock-in, not for interoperability.
Here is what to require before you commit:
- Open data export. Your data, your format. If you cannot pull time-stamped CSV or API-accessible records from any sensor in your system, the platform owns your operational intelligence. Not you.
- Local failover. The published research architecture supports both remote cloud and local-server operation. If your internet goes down, your alarms and basic control should not go with it.
- Protocol flexibility. MQTT, HTTP, Modbus, BACnet. The more protocols your gateway speaks, the more sensor and actuator options you keep open. Proprietary radio-only systems create expensive dead ends.
- Sensor replaceability. Can you swap a failed temperature probe without reconfiguring the entire system? If replacement requires a vendor service call, that is a maintenance dependency you will regret at scale.
- Manual override. Every automated setpoint needs a human override path. Algorithms optimize for the parameters they were trained on. When a new cultivar, a changed photoperiod, or a mechanical fault shifts the context, an operator must take control immediately.
Evaluate vendors not by sensor count or dashboard aesthetics, but by measured outcomes: temperature uniformity across racks, hours outside setpoint per month, kWh per kilogram, crop-loss percentage, and alarm-to-response time. Any vendor unwilling to benchmark against those metrics is selling features, not results.
At Datanet, this is how we approach every deployment. We integrate hardware from multiple partners into a single monitoring stack, because no single device solves every environment. If your vertical farm needs environmental tracking that survives high humidity and delivers interoperable data, talk to our team: info@datanetiot.com.
Frequently Asked Questions
What temperature should a vertical farm maintain for lettuce?
Published research reports ranges of 24 ± 2°C with 50 to 60% RH and 450 ppm CO2 in one study, and 22 to 26°C by day and 20 to 24°C at night in another. These are starting points. Validate with your specific cultivar, light recipe, and airflow, then track which conditions produce the best saleable yield.
How often should sensors record temperature data?
A published IoT vertical-farm design acquires sensor data every 15 minutes and refreshes the cloud every 30 minutes. That works for trend analysis. For safety events like compressor failure or power loss, you need a local alarm path that responds in seconds, not minutes.
Is a cloud dashboard enough for temperature monitoring?
No. Cloud dashboards excel at analytics, multi-site comparison, and long-term optimization. But they depend on internet connectivity and introduce latency. Pair cloud analytics with local control logic that maintains setpoints and triggers alarms even when the connection drops.
Do I need root-zone temperature sensors?
If you grow in substrate or recirculating nutrient solution, root-zone temperature directly affects nutrient uptake and growth rate, and air sensors above the rack cannot detect it. For high-value crops where root conditions are managed independently from air climate, the added complexity pays for itself in diagnostic clarity.
How do I prevent sensor failures in high-humidity growing environments?
Use IP65-rated or better enclosures. Choose sensors with conformal-coated PCBs. Route cables away from LED drivers to reduce electromagnetic interference. Budget for quarterly calibration checks. No spec sheet accounts for six months of humidity cycling. Maintenance schedules do.
Does better temperature monitoring make a vertical farm profitable?
It reduces avoidable loss and improves repeatability, but profitability also depends on energy cost, labor, rent, crop mix, pricing, and throughput. Current lettuce production runs at 10 to 18 kWh per kilogram. Closing the gap toward the 3.1 to 7.4 kWh benchmark is where monitoring and control most directly affect the bottom line.








 +1 508 292 2210

2 Responses