

A 5,000 m² vertical farm runs 46 temperature sensors, 12 CO2 probes, and a full weather station. Thousands of readings per day. Most of that data never changes a single decision.
Vertical farm environmental monitoring only creates value when it closes a loop. A temperature record that never adjusts HVAC, a camera feed that never shifts harvest timing, an energy meter nobody checks until the quarterly bill arrives: that’s instrumentation, not intelligence. The distinction sounds academic until you look at the farms that raised hundreds of millions, collected beautiful data, and still shut down.
What follows is a field guide: what to measure, how to build the sensor-to-actuator chain, why energy is the variable most dashboards ignore, and what recent closures and recoveries reveal about the economics of monitoring done right.
What Environmental Monitoring Actually Means in a Vertical Farm
Strip away the marketing and the concept is mechanical. Environmental monitoring is the continuous measurement of growing conditions, resource flows, equipment state, and plant health, paired with decisions (automated or human) that correct deviations before they cost yield or dollars. Temperature monitoring in vertical farms exemplifies this principle: measurement becomes valuable only when coupled with HVAC actuation.
The operative word is “paired with.” Recording data is step one. Acting on it is where the return shows up.
The loop has four stages:
- Sense. Probes, cameras, and meters sample the physical and biological state of the farm.
- Compare. Software checks measurements against targets, crop models, or historical baselines.
- Act. Controllers adjust HVAC, lighting, irrigation, nutrient dosing, CO2 injection, or labor schedules.
- Verify. The next measurement confirms whether the intervention worked.
If any stage is missing, you have a monitoring system in name only. A published IoT architecture samples data every 15 minutes and transmits every 30, with local alarms for events that can’t wait for a cloud round trip. That local-first design is not optional. It is the minimum viable architecture for a facility where a two-hour climate deviation can destroy a crop cycle.
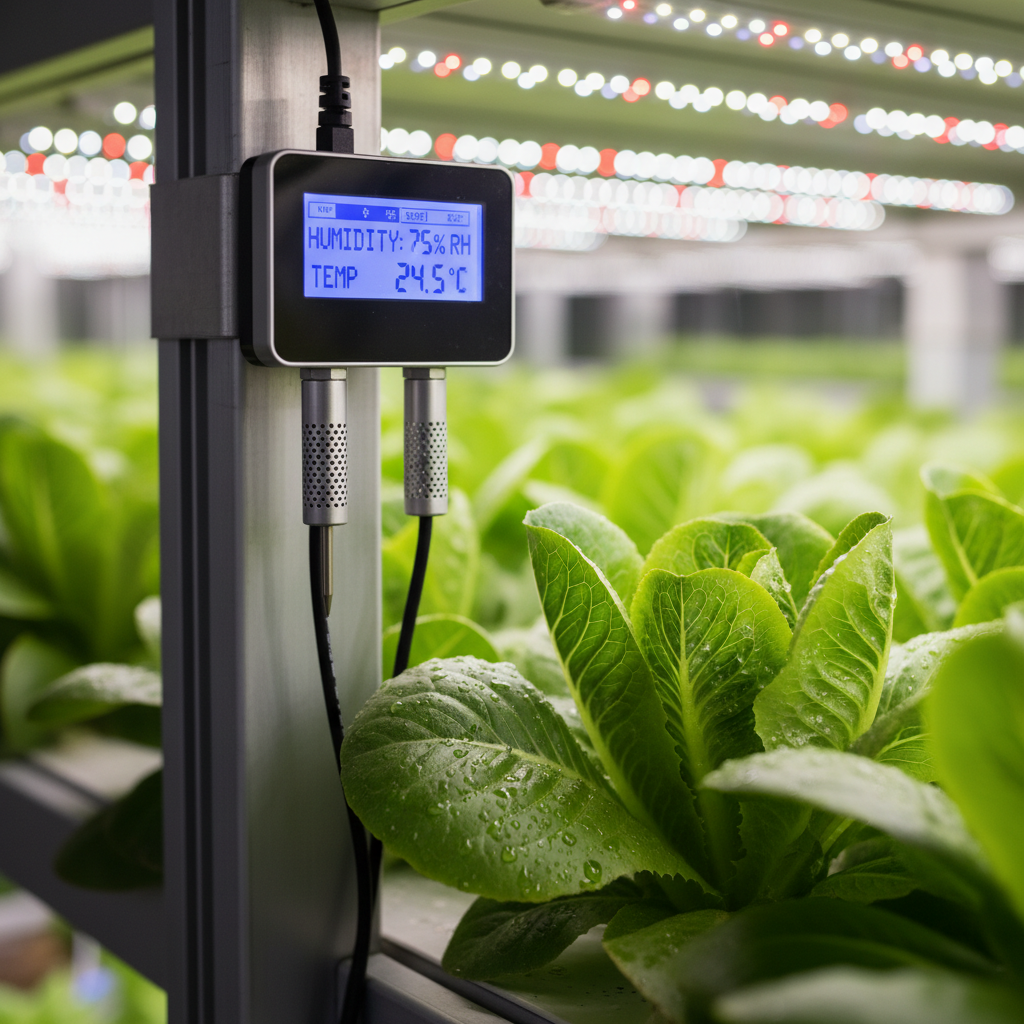
The Seven Variables Worth Measuring
Not every data point deserves sensor budget. The variables below are ranked by their combined impact on crop outcomes and operating cost. The first five are non-negotiable in any indoor growing operation. The last two separate farms that monitor from farms that optimize.
| Variable | What it controls | What drift costs you | Typical bench accuracy |
|---|---|---|---|
| Air temperature | Transpiration, enzyme activity, growth rate | Bolting, tip burn, slow cycles, HVAC waste | ±0.3 °C |
| Relative humidity / VPD | Transpiration balance, disease pressure | Mold outbreaks, calcium deficiency, dehumidifier overrun | ±2% RH |
| CO2 concentration | Photosynthesis rate | Lost yield (under-enriched), wasted gas (over), worker safety risk | ±30 ppm (NDIR) |
| Light (PAR, spectrum, photoperiod) | Morphology, flavor compounds, cycle timing | Stretched plants, delayed harvest, 40-60% of electricity bill | ±5 µmol/m²/s |
| Root-zone chemistry (pH, EC, temp) | Nutrient availability, uptake efficiency | Lockout, toxicity, root disease | ±0.1 pH, ±2% EC |
| Energy consumption by load | Cost per kg, carbon footprint | Invisible margin erosion, misleading sustainability claims | Per-circuit metering |
| Plant condition (imaging, chlorophyll) | Stress detection, harvest readiness, yield forecast | Late intervention, labor misallocation, surprise shortfalls | RGB/multispectral + validated models |
The bench specs above come from a recent review of smart vertical-farm instrumentation. In a wet, chemically aggressive rack environment with condensation and LED reflections, real-world accuracy will be worse. That gap is exactly why calibration practice matters more than spec sheets.
Two variables on the list get consistently ignored in vendor demos. Energy, because it’s framed as a facility cost rather than a crop variable. And plant condition, because camera-based models require crop-specific validation that’s expensive to build and easy to skip. Both deserve deeper treatment, and they get it below.
Architecture: From Sensor to Actuator in One Stack
A monitoring system has five layers. Each one can be a point of failure, and most sales demos only show you two of them.
Physical layer. Sensors and actuators placed where they represent actual growing conditions, not convenient mounting points. Jones Food Company’s commercial facility runs 46 temperature/humidity sensors, 12 CO2 probes, 10 combined climate sensors, two pressure transmitters, and a weather station across 5,000 m² of growing space. That’s roughly one climate sensor per 75 m², mapped to airflow zones, rack tiers, and control boundaries. Sensor density is an engineering decision, not a marketing metric.
Network layer. Wired connections for critical actuators. Wireless (Wi-Fi, LoRa, cellular) for distributed sensing. The choice depends on latency and layout. A CO2 reading that’s 30 minutes old works for trend analysis. It’s useless for a leak alarm.
Edge processing. Local controllers and gateways that keep critical loops alive when the internet drops. Recent reviews identify edge computing as essential for low-latency vertical-farm control. If your HVAC stops because your cloud provider is down, your architecture has a single point of failure in the wrong place. Connected controllers also introduce cybersecurity exposure: a compromised gateway can affect irrigation, lighting, and food production. Network segmentation and access controls are not optional IT projects.
Decision layer. Thresholds for simple alarms. PID control for stable loops like temperature and humidity. Model-predictive control for complex optimization across growth stages. Digital twins that test recipe changes virtually before applying them to live crops. The right level of sophistication depends on scale. A 500 m² leafy-green room doesn’t need a digital twin. A multi-site operation probably does.
Actuator layer. HVAC, LED dimming, irrigation valves, nutrient dosers, CO2 injectors, dehumidifiers. The actuator must respond fast enough to match the variable’s dynamics. Temperature tolerates minutes. pH correction in a recirculating system might need seconds.
One principle holds across all five layers: automate locally, learn centrally. Keep safety loops and fast alarms on-site. Use the cloud for model training, fleet comparison, and historical analytics. And always preserve a manual operating mode for when the software fails or makes a decision you don’t trust.
The Variable Nobody Dashboards: Energy
Here’s the number that belongs on every vertical farm’s home screen but rarely appears there: kWh per kilogram of harvested product.
Electricity dominates the environmental footprint of indoor growing. One lettuce life-cycle assessment attributed 85% of the baseline carbon footprint to electricity, with LED lighting alone consuming an estimated 9.7 kWh/kg. That study reported 8.177 kg CO2e/kg for vertical lettuce versus 0.490 for open-field production: a 16.7x gap.
A different modular-farm study found electricity was the largest contributor across most environmental impact categories, estimating lettuce at 0.87 to 1.18 kg CO2e/kg depending on electricity source, and basil at 1.45 to 2.12 versus 2.9 to 6.2 for conventional basil.
Same crop category. Wildly different carbon numbers. The difference comes down to electricity mix, equipment, utilization rate, and system boundaries.
The implication for monitoring is direct. A water-only sustainability dashboard can reward the wrong design. A farm using 95% less water but drawing 15 kWh/kg from a coal-heavy grid may have a worse total footprint than a greenhouse in a mild climate. Without energy metering by load (lighting, HVAC, pumps, dehumidification separately), there’s no way to know.
Meter everything. Report kWh/kg and kg CO2e/kg alongside yield and quality. Make energy a first-class control variable, not a line item that shows up quarterly in the utility bill.
What Profitable and Failed Farms Reveal About Monitoring
Technology doesn’t override economics. The period from 2023 to 2025 made that painfully clear.
Bowery Farming ceased operations on November 1, 2024, after raising more than $700 million and reaching a reported peak valuation of $2.3 billion. Proprietary automation and a data-intensive growing model weren’t enough when financing and sales couldn’t sustain the burn.
Plenty filed Chapter 11 in March 2025 and emerged two months later, narrowing its focus to premium strawberries. It secured $20.7 million in debtor-in-possession financing to keep its Richmond farm and Laramie R&D running. The technology survived. The original capital structure didn’t.
AeroFarms reported two profitable quarters following its own 2023 bankruptcy, crediting a strategic pivot to high-margin microgreens sold through Whole Foods and Costco. The same account cautioned that two good quarters don’t prove sector-wide viability.
On the integration side, 80 Acres Farms built a full-stack control platform that connects crop software, environmental controls, robotics, AI, digital twins, and logistics coordination. The company reports 300x food per square foot and 17 to 20 crop cycles per year. Those are company claims, not independently audited benchmarks. But the approach illustrates the value of connecting agronomy to energy, labor, and fulfillment in a single closed loop.
The common thread: monitoring must sit beside financial metrics, not above them. Yield per rack, energy per kilogram, labor per harvest, shrink rate, price realization. If your dashboard shows perfect climate data but not contribution margin, you’re watching the plant while the business bleeds. For broader context on where the spending goes, the environmental monitoring market offers a useful reality check on the economics. Understanding what an environmental monitoring plan should include helps avoid the pitfalls that sank these farms.
Calibration, Drift, and the Maintenance Nobody Mentions
Vendor spec sheets list accuracy at the bench. Farms operate in a different reality.
A vertical farm environment is humid, warm, chemically active, and full of reflective surfaces. Condensation fogs optical sensors. Nutrient solution corrodes pH probes. LED light bouncing off white grow channels confuses PAR meters placed at the wrong angle. Electromagnetic interference from dozens of ballasts and drivers can introduce noise in sensitive readings. Over weeks, sensors drift. The ±0.3 °C on the datasheet becomes ±1 °C in practice, and nobody notices because the dashboard still shows green.
Similar calibration challenges exist in aquaculture environmental monitoring where sensors face constant water exposure.
Three practices separate reliable monitoring from decorative monitoring:
Sensor registry. Every probe tracked by serial number, location, install date, and last calibration date. When a reading looks wrong, you need to know whether it’s the sensor or the environment.
Scheduled calibration. pH probes in recirculating hydroponic systems need calibration every two to four weeks. CO2 NDIR sensors drift less but still require annual reference checks. Temperature and humidity sensors should be cross-referenced against a traveling reference instrument at least quarterly.
Replacement budget. pH probes last 12 to 18 months in aggressive nutrient solutions. EC sensors degrade slower but still wear out. Plan for replacements as a recurring operating cost, not a surprise capital request.
If your monitoring vendor doesn’t discuss calibration during the sales process, they’re selling you a dashboard, not a measurement system.
Climate Telemetry Is Not Food Safety Monitoring
This confusion appears often enough to deserve its own section.
Climate telemetry measures temperature, humidity, CO2, light, and other growing conditions. Food safety environmental monitoring, as defined under FDA’s FSMA Preventive Controls rule, is a risk-based verification activity: sampling for environmental pathogens like Listeria when contamination of ready-to-eat food is an identified hazard requiring a preventive control.
They complement each other. Temperature and humidity data can support sanitation investigations and help identify conditions that favor pathogen growth. But a clean-looking climate dashboard does not replace microbiological swabbing. The WHO guidelines for environmental monitoring reinforce this same risk-based logic. UC Davis describes environmental sampling as tied to the food, facility, and preventive control plan, not to the HVAC system.
If you grow ready-to-eat leafy greens (most vertical farms do), your food safety plan likely requires both types. Don’t let a climate monitoring vendor tell you their system covers FSMA compliance. It covers part of it.
How to Choose a Monitoring Stack
Evaluate four layers separately. Any vendor who bundles them into a single score is hiding a weakness.
Measurement quality. What sensors, what stated accuracy, what calibration support, what placement guidance? A platform is only as good as the data feeding it. Ask for the sensor registry template. If they don’t have one, you’ll be building it yourself.
Data interoperability. Open APIs, standard units and timestamps, exportable data, role-based access. If you can’t extract your own data from the system in a usable format, the system owns you. This matters doubly when you need to feed environmental data into an ERP, a food safety plan, or a carbon accounting tool.
Control authority. Does the platform only visualize, or can it safely actuate HVAC, lighting, and irrigation? What happens during a network outage? A system that adjusts temperature is more valuable than one that shows a red alert. But a system that adjusts temperature without a safe local fallback mode is a liability.
Proven economics. Ask for case studies with actual yield, energy, and cost data. Not testimonials. Not “up to 30% improvement.” Specific crops, specific facilities, measured outcomes. If the vendor can’t share any, they either don’t have them or the numbers aren’t favorable.
For the sensor and connectivity layer specifically, interoperability matters more than brand. Environmental monitoring devices that support standard protocols, long battery life, and flexible connectivity give you the freedom to swap platforms without replacing hardware. That’s where we spend most of our time at Datanet: helping operators match environmental tracking devices to the monitoring architecture rather than the other way around.
If your container pool, grow trays, or harvested product leave the farm and become invisible, that’s a separate problem. But inside the four walls, the monitoring stack is the operating system. Choose it like one.
Questions about building or upgrading your environmental monitoring layer? Talk to our team, or reach us at info@datanetiot.com.
Frequently Asked Questions
What is environmental monitoring in a vertical farm?
It is the continuous measurement of growing conditions (temperature, humidity, CO2, light, root-zone chemistry), resource flows (water, energy), equipment state, and plant health, combined with automated or human decisions that correct deviations. The system typically uses sensors, IoT connectivity, edge or cloud processing, and actuators for HVAC, lighting, irrigation, and nutrient dosing.
Which variables should a vertical farm measure first?
Start with air temperature, relative humidity, CO2, PAR light, pH, EC, and root-zone temperature. Add per-load energy metering as early as possible. Plant-level imaging and chlorophyll sensing come next, once the farm has defined decisions those signals will change.
How often should sensors collect data?
There is no single correct interval. Published IoT architectures sample every 15 minutes for climate trends, but safety alarms and fast equipment faults need local, event-driven triggers. Set the interval by how quickly the variable can drift beyond tolerance and how fast the actuator can respond.
Does vertical farm environmental monitoring require AI?
No. Simple thresholds handle basic alarms. PID controllers manage stable climate loops effectively. AI adds value for complex prediction, image-based plant assessment, anomaly detection, and multi-variable optimization. Deploy AI where you have labeled training data, a defined decision it will improve, and a rollback path if the model is wrong.
Is climate telemetry the same as food safety environmental monitoring?
No. Climate telemetry measures growing conditions. Food safety environmental monitoring, per FDA’s FSMA Preventive Controls rule, involves risk-based sampling for pathogens like Listeria in facilities producing ready-to-eat food. Temperature and humidity logs support sanitation analysis but do not replace microbiological verification.
Can environmental monitoring prove vertical farming is sustainable?
Monitoring makes sustainability testable, not guaranteed. Published life-cycle assessments for vertical-farm lettuce range from 0.87 to 8.177 kg CO2e/kg depending on electricity source, utilization, and system boundaries. Without energy metering alongside crop data, sustainability claims are assumptions, not evidence.








 +1 508 292 2210

3 Responses