

Farmed aquatic animals reached 94.4 million tonnes in 2022, surpassing wild capture fisheries for the first time. The industry’s first-sale value now exceeds $312 billion. When a single production system supplies over half the world’s aquatic protein, fish farm monitoring is not optional infrastructure. The real question is whether your system prevents loss or just documents it after the fact.
I come from industrial IoT, not fisheries biology. But after 15-plus years deploying sensor networks, connectivity layers, and tracking systems across supply chains, the pattern is consistent: the gap between “we collect data” and “we prevent failure” is enormous. In aquaculture, where a dissolved-oxygen crash can wipe out 100,000 fish overnight, that gap is counted in dead animals and missing revenue.
The framework below covers what to measure, how the system connects, what happens when monitoring itself fails, and how to choose a setup that fits your operation rather than a vendor’s demo reel.
What Fish Farm Monitoring Actually Covers
Fish farm monitoring is the continuous or scheduled collection, transmission, interpretation, and actuation of environmental, biological, and operational data from an aquaculture facility. The goal: inform or automate decisions that protect fish health, optimize production, and satisfy regulatory requirements.
I emphasize “actuation” because most conversations stop at “sensing.” A probe in the water is a sensor. A monitoring system is a decision loop: measure, transmit, interpret, alert, act, verify. Skip any step and you have data without decisions.
A 2025 systematic review of IoT sensors in aquaculture describes four architectural layers that apply to any fish farm monitoring deployment:
| Layer | Typical Components | What It Answers | Common Failure Mode |
|---|---|---|---|
| Sensing | Temperature, pH, dissolved oxygen, salinity, turbidity, TAN probes, cameras, sonar | Is the environment or stock changing? | Fouling, drift, biofilm, poor placement |
| Processing | Microcontroller, PLC, edge compute, local rules, image inference | Is the reading plausible and urgent? | Power loss, weak calibration, model drift |
| Connectivity | Wi-Fi, SMS, LoRaWAN, NB-IoT, cellular, satellite | Can the signal reach the operator in time? | Rural coverage gaps, latency, bandwidth limits |
| Application & Control | Dashboard, alerts, farm record, aerator/feeder/pump automation | What should happen next (and does it happen automatically)? | Alert fatigue, no response owner, unsafe automation |
The layer most farms underinvest in is the last one. Connecting a sensor reading to an automated aerator startup or feeder adjustment is the difference between documenting a dissolved-oxygen crash and preventing one. Without loop closure, monitoring becomes an expensive way to write post-mortems.
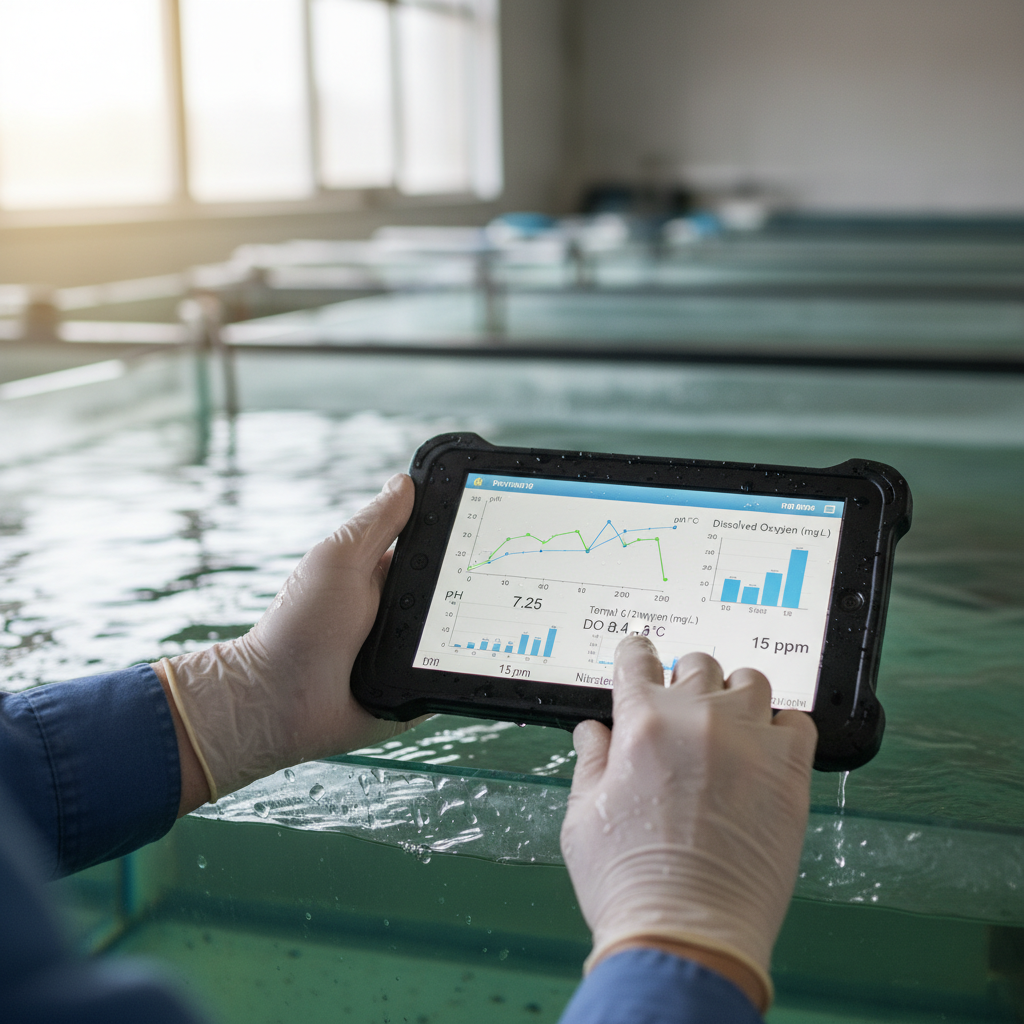
Water Quality Parameters That Keep Fish Alive
Fish live in their medium. When water degrades, they can’t relocate. That makes water quality the first monitoring priority regardless of species or system type.
The core set: temperature, pH, dissolved oxygen (DO), salinity or conductivity, turbidity, and total ammonia nitrogen (TAN). Some operations also track nitrite, nitrate, CO2, ORP, and flow rate. Thresholds are species-specific. An Asian seabass study validated operational ranges of pH 7.0 to 8.5, dissolved oxygen 4 to 8 mg/L, ammonia no higher than 0.05 ppm, and salinity 28 to 32 g/L. Choosing the right water quality sensors for fish farming depends on this: a salmon RAS has different oxygen demands and different ammonia tolerances than a tropical shrimp pond. Copying someone else’s thresholds without species-specific validation is how false confidence starts.
Sampling frequency matters as much as sensor accuracy. That same seabass study measured every six hours. A USDA ARS mortality-detection prototype captured images every 15 minutes. The right cadence depends on how fast conditions can become lethal. In a recirculating system, a CO2 spike or biofilter crash can kill within hours. A six-hour interval might catch the aftermath, not the event.
Then there’s total cost. A DS18B20 temperature sensor runs roughly $2 to $5. An OxyGuard dissolved-oxygen probe costs about $100 and needs calibration every 3 to 6 months. Add cleaning against biofilm, replacement cycles, network service, integration, staff training, and the cost of a false negative. A cheap sensor that drifts undetected is more expensive than no sensor, because it generates false confidence in a number that no longer represents reality.
Monitoring the Fish, Not Just the Water
Water quality tells you the environment. It doesn’t tell you how the animals are responding. A pond with textbook dissolved oxygen and a pond where fish are lethargic, off-feed, or dying look identical on a water-quality dashboard. For the biological layer, you need a second set of eyes (or ears).
Camera-based AI is the most visible development. Aquabyte’s Hydra 360 packages feeding assessment, health monitoring, biomass estimation, and automated sea-lice counting in a single unit. On the research side, MortCam, a USDA ARS prototype, used YOLOv7 trained on 2,000 labeled images to detect dead fish in RAS tanks. It captured an image every 15 minutes and triggered alerts when a mortality threshold of three was exceeded. The constraint worth noting: it was trained on fish weighing 1.5 to 3 kg and performance may degrade below 1 kg. Species, size, lighting, and turbidity all bound what the model can actually see.
Hydroacoustics take a different path. CageEye uses sound waves to map fish distribution and feeding behavior in salmon cages, particularly useful in low-visibility conditions where cameras struggle. For shrimp, Umitron Eagle offers AI analytics for appetite, health, and growth, while Minnowtech’s BRS-1 applies subsurface sonar for biomass estimation. Effective shrimp farm monitoring combines these acoustic and AI tools with water-quality data to protect the crop.
No single modality covers everything. Cameras detect behavior but not dissolved oxygen. Sensors measure chemistry but can’t judge appetite. Sonar works in turbid water but doesn’t count lice. A 2025 AIoT review identifies multimodal integration as the direction for aquaculture monitoring, combining environmental, visual, and acoustic data into unified decision-support systems. But the same review flags cost, technical expertise, limited model portability across species, and cybersecurity as persistent barriers. The buying criterion that cuts through vendor noise: does the system change a decision you actually make, and can it prove the outcome?
Closing the Loop: From Alert to Intervention
This is where the money is. And where most monitoring systems stop short.
A typical installation fires an alert to a phone or dashboard when a threshold is breached. Then what? If the notification hits at 2 AM, who drives to the site? How fast can they get there? Does the system activate backup oxygen or just send a text message?
The closed-loop target: sensors detect a parameter breach, the system triggers an automated response (aerator starts, backup oxygen activates, feeder pauses), and then it verifies that conditions recovered. Humans retain authority over high-risk decisions like medicating, harvesting, or structural intervention. But humans shouldn’t be the sole barrier between an overnight oxygen crash and a dead crop.
Feed is the clearest closed-loop ROI in aquaculture. Feed represents the largest variable cost in most operations. Connecting real-time appetite data to automated feeder control reduces waste, improves feed conversion ratios, and generates payback measurable within a single production cycle. This connection between monitoring data and feeding automation is still one of the most underdeveloped areas in the industry. Most farms treat their sensors and their feeders as separate purchases with separate vendors and separate dashboards.
Then there’s the human factor nobody mentions on spec sheets. Transitioning from manual spot-checks to digital monitoring is not plug-and-play. Staff need to learn how to interpret alerts, distinguish genuine alarms from sensor noise, and maintain the equipment that generates the data. Alert fatigue (too many false positives) is as dangerous as no alerts at all. When operators start ignoring notifications because 90% are noise, the 10% that matter get buried.
One more ROI source that lives outside the sensor catalog: certification. Monitoring data increasingly supports ASC and BAP sustainability certification requirements. Documented water quality records, mortality rates, and environmental compliance can raise the sale price of the end product. For farms selling into European or North American markets where certified seafood commands a premium, monitoring infrastructure pays for itself through market access, not just loss prevention.
When Monitoring Fails: Three Costly Lessons
Monitoring is not a guarantee. Three incidents from 2023 to 2025 illustrate failure modes that no dashboard can prevent on its own.
Sustainable Blue, Nova Scotia, November 2023. A carbon-dioxide-removal filter suffered a structural collapse at this land-based Atlantic salmon farm, killing 100,000 fish valued at $5 million. The loss eliminated 20% of production capacity and interrupted customer supply until June 2024. The CEO described it as a construction failure. The monitoring lesson is blunt: the most sophisticated RAS monitoring system cannot detect a structural failure that happens faster than any sensor cycle. Physical inspection, redundant life-support paths, and emergency shutdown protocols sit alongside analytics, not beneath them.
Tasmania, Australia, February to May 2025. A large and unprecedented mortality event unfolded in the lower D’Entrecasteaux Channel. EPA Tasmania began independent environmental monitoring after antibiotic residues were detected in beach oil globules at parts-per-million levels. Later testing found no further residues in water, sand, or fish at subsequent sampling points, though oxytetracycline was detected in some wild-fish samples collected in late February. The lesson here is about evidence integrity: chain of custody, published uncertainty, and the critical distinction between a preliminary signal and a confirmed cause.
eFishery, Indonesia, 2025. This smart-feeding platform reached unicorn status after a $200 million Series D. Then came whistleblower allegations describing large discrepancies between reported and alleged financial performance, including a contrast between a reported $16 million profit and an alleged $35.4 million loss over nine months. The board appointed FTI Consulting in February 2025 for an independent review. The monitoring implication goes beyond accounting: device telemetry, customer records, feed deliveries, and biological outcomes must all be reconcilable. A connected device is not, by itself, verified impact. Data governance is part of fish farm monitoring.
The common thread: monitoring systems create value only when paired with physical redundancy, auditable data lineage, emergency procedures, and human oversight. A sensor that works perfectly is useless if the structure it’s bolted to collapses, the evidence chain breaks, or the business numbers behind the platform cannot be verified.
How to Choose a Fish Farm Monitoring System
The right system depends on three variables: what you farm, how large your operation is, and which failure you fear most.
Small-scale operations (backyard ponds, small tanks, hatcheries): Start with the basics. DO, temperature, and pH on a validated IoT stack. Compare readings against a reference probe for at least one production cycle before trusting automated alerts. Build response procedures first, add complexity later.
Mid-scale farms (multiple ponds, cages, or RAS units): Layer in automated alerts, feeding integration, and a cloud dashboard that logs data for compliance reporting. Consider cameras or acoustic monitoring for high-value species where biomass or health data changes a real decision.
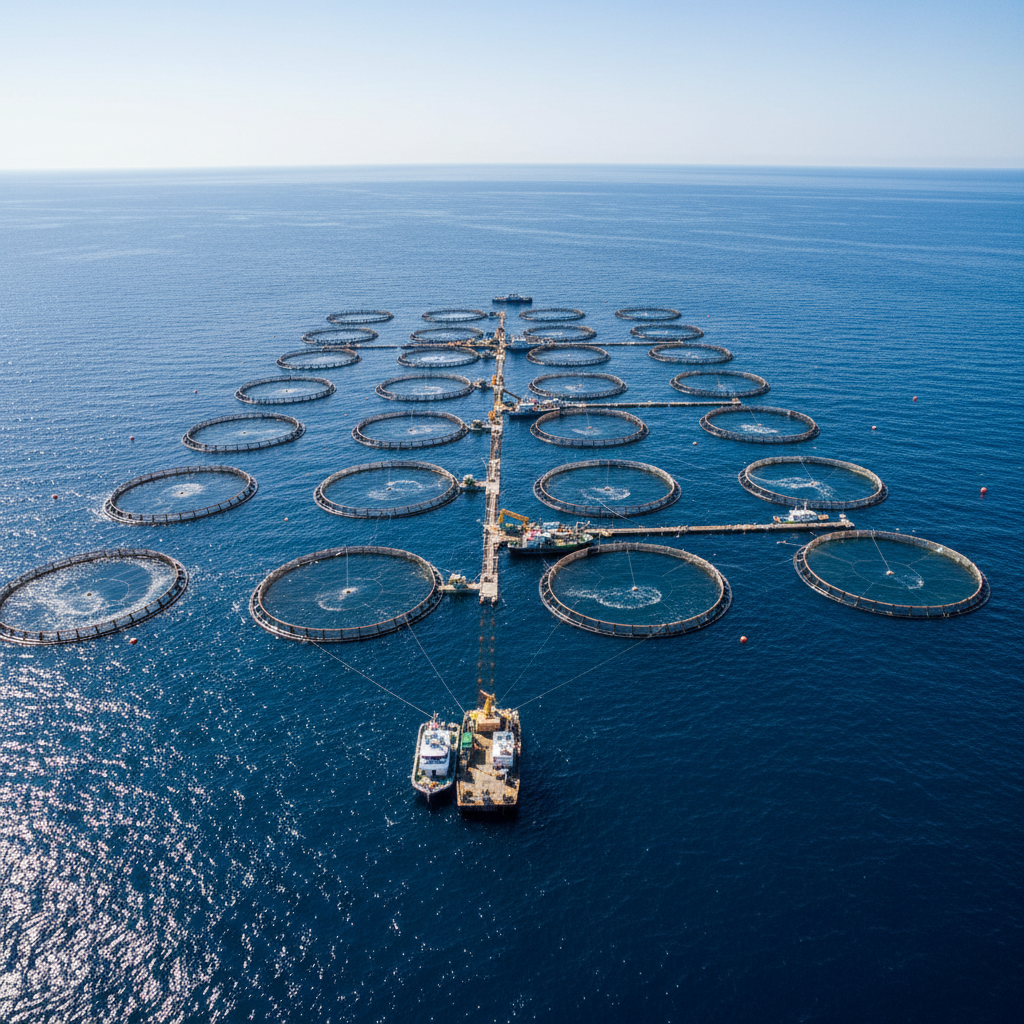
Large or offshore operations: Multimodal monitoring (environmental, visual, acoustic), automated control loops with human-override capability, redundant power and oxygen systems, cybersecurity, and formal data governance. At this scale, asset tracking for cages, vessels, feed barges, and support equipment becomes its own monitoring layer. The question is not whether you can afford full monitoring. It’s whether you can afford the catastrophic loss that comes without it.
Regardless of scale, ask any vendor these five questions before comparing feature lists. For offshore operations that also involve cargo monitoring at sea for feed barges and support vessels, asset tracking becomes an additional monitoring layer:
- Which species, fish size, and water type was this system validated on?
- What happens when connectivity drops? Is there local fallback logic?
- Can raw data be exported to my own systems and to regulators?
- What is the calibration and maintenance schedule, and who owns it?
- What is the measured false-alarm rate, and how do you manage alert fatigue?
The precision aquaculture market is projected to reach $1.43 billion by 2030, growing at 11.1% CAGR. More choices are coming. So are more unproven claims. The smart move: buy the smallest integrated stack that detects the failure you fear most, proves the intervention worked, and scales only when evidence holds under real operating conditions.
If your operation needs environmental monitoring for water temperature, quality, and conditions, or you’re tracking equipment and assets across distributed aquaculture sites, that’s the work we do at Datanet IoT Solutions. Explore our environmental tracking devices or reach out to our team directly. See also the article: Vertical Farm Monitoring System: What Pays Off.
Frequently Asked Questions
What does fish farm monitoring include?
It spans environmental data (water temperature, pH, dissolved oxygen, salinity, turbidity, ammonia), biological data (fish behavior, appetite, biomass, health, mortality), and operational data (equipment status, energy, water flow, feed delivery). A complete system collects, transmits, interprets, and acts on this data in a continuous decision loop.
Which water quality parameters should a fish farm measure?
At minimum: dissolved oxygen, temperature, and pH. Most operations also track salinity or conductivity, turbidity, and total ammonia nitrogen. RAS systems often add nitrite, nitrate, CO2, and flow rate. Exact thresholds are species-specific and should be validated against reference probes for your setup, not copied from generic tables.
How often should monitoring data be collected?
Failure-critical variables like dissolved oxygen should be measured continuously or at intervals short enough to detect a lethal change before it kills the crop. Research systems have used cadences ranging from every 6 hours (water quality probes) to every 15 minutes (mortality cameras). Set your frequency based on how fast conditions can become dangerous for your species, not based on a default setting.
Can AI replace human workers on a fish farm?
No. AI reduces repetitive observation and helps prioritize responses, but current models are trained for specific species, sizes, and conditions. They may not generalize across environments. Human judgment remains necessary for diagnosis, welfare assessment, treatment decisions, and emergency response. AI is a tool inside the loop, not a replacement for the operator.
How much does a fish farm monitoring system cost?
Component costs vary widely. A basic temperature sensor can run $2 to $5, while a dissolved-oxygen probe costs around $100. Total cost of ownership includes calibration, cleaning, replacement, connectivity, software, integration, staff training, and documented response procedures. There is no universal installed price; it depends on species, scale, system type, and the level of automation required.
Can monitoring prevent every fish kill?
No. Monitoring improves detection speed and response quality, but it cannot eliminate structural collapse, design flaws, severe weather, disease outbreaks, or human error. The 2023 Sustainable Blue incident (100,000 fish lost to a physical filter collapse) demonstrates why redundant life-support systems, physical inspection, and emergency protocols must accompany any digital monitoring setup.








 +1 508 292 2210

2 Responses