

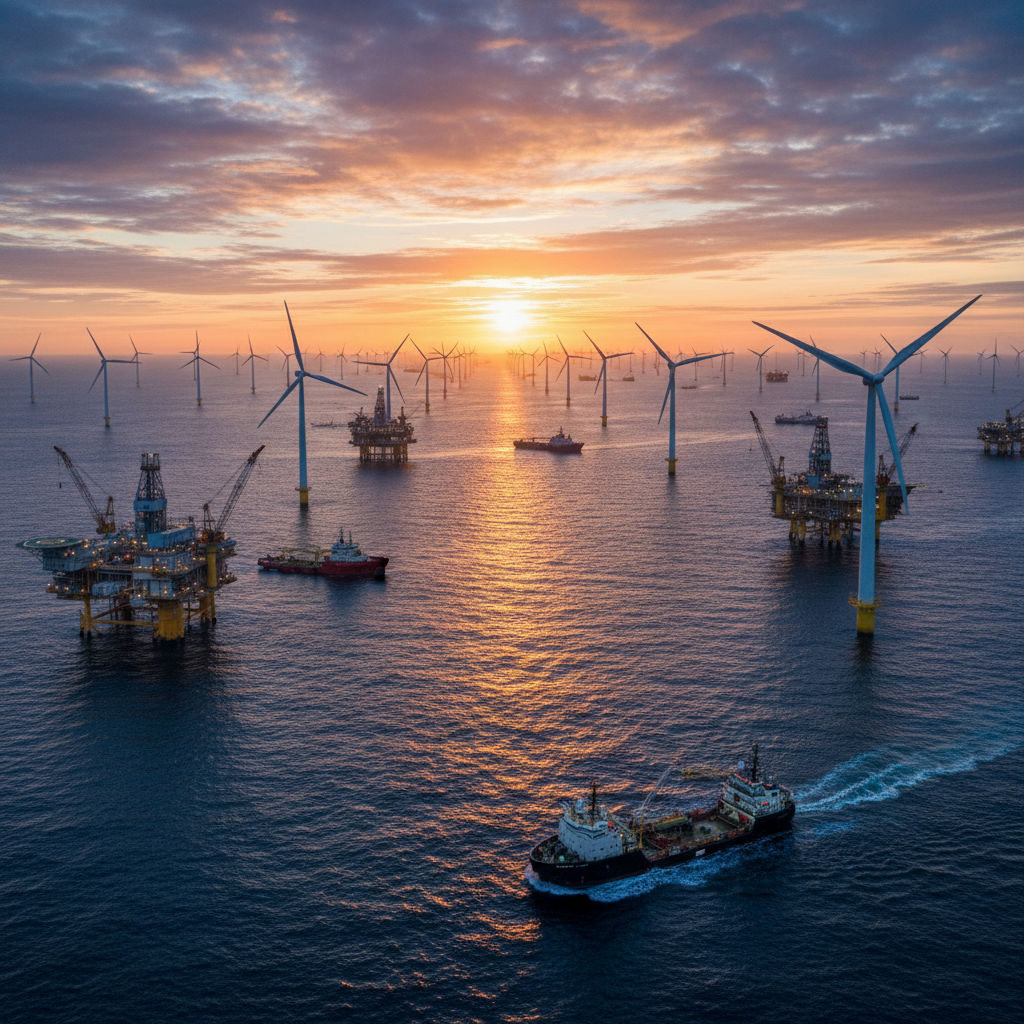
Global offshore wind capacity reached 83 GW in 2024, with IRENA’s 1.5°C pathway demanding 2,000 GW by 2050. That’s a 24x expansion of turbines, foundations, substations, and subsea cables, all exposed to salt, cyclic loading, and brutal access economics. At the same time, mature oil and gas platforms are being pushed past their original design life because life extension beats decommissioning on the spreadsheet. Every one of those assets needs continuous offshore energy asset monitoring.
The awareness is there. The scope isn’t. Most conversations about offshore monitoring live inside the SCADA screen: vibration data, structural loads, condition alarms. That’s one layer. The containers of spare parts sitting on a quayside, the ground support equipment circulating between three platforms, the rented tools that should have been returned months ago? Those rarely make it into the same conversation. They should.
This guide covers the full stack: what offshore energy asset monitoring means in practice, where the economics are sharpest, which technologies deliver returns today, and where the gaps persist.
What Offshore Energy Asset Monitoring Actually Covers
Offshore energy asset monitoring is the continuous, sensor-driven observation of physical assets across the offshore energy lifecycle. That includes wind turbines, oil and gas platforms, FPSOs, subsea pipelines, power cables, substations, and the portable equipment that supports all of them.
The monitoring stack has four layers:
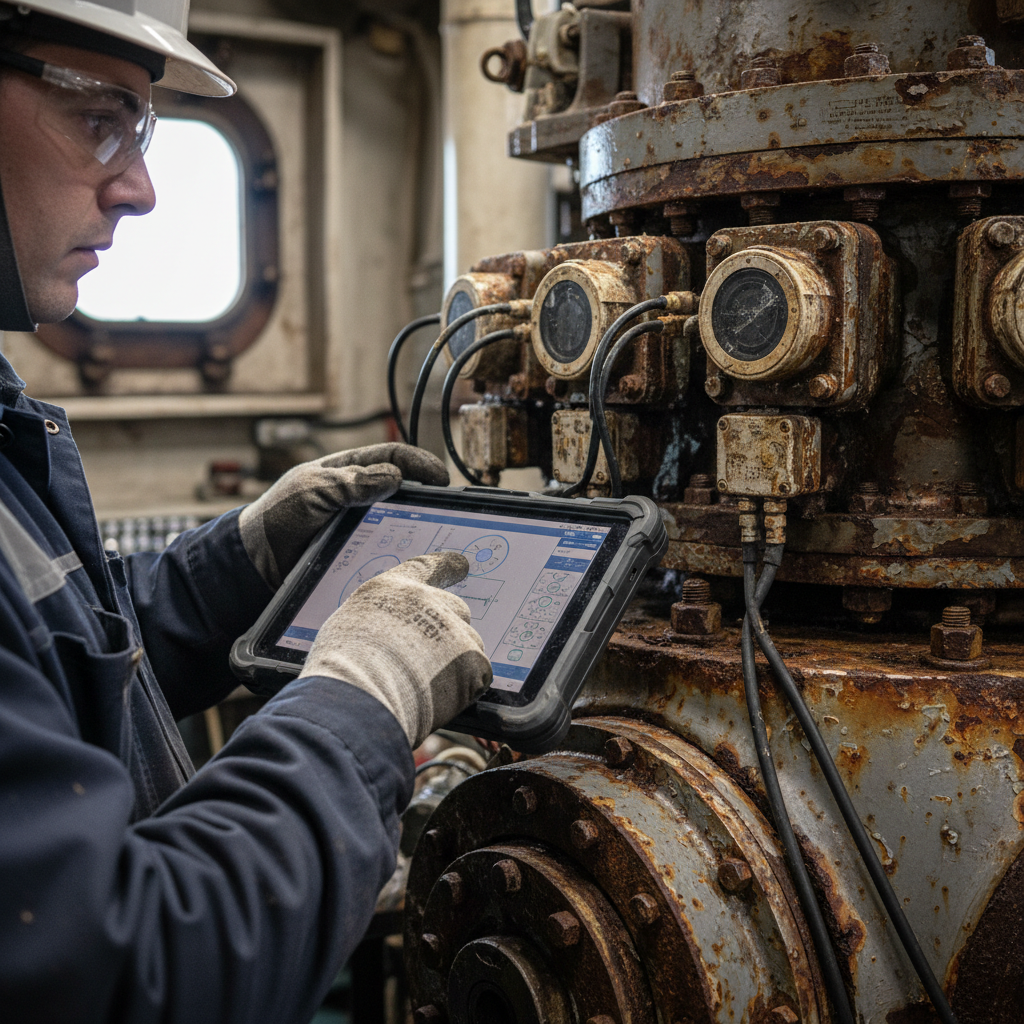
- Sensing. Accelerometers on gearboxes. Strain gauges on monopile foundations. Distributed fibre-optic sensing (DAS/DTS) along export cables. GPS and cellular trackers on containers and ground equipment. This layer collects raw physical data from the asset.
- Communications. Getting data off the asset. Fibre backhaul, private 5G (Equinor runs it on Martin Linge), microwave links, LEO satellite constellations, and edge gateways that pre-process before transmitting to shore.
- Analytics. Turning raw signals into insight. Digital twins, ML-based anomaly detection, condition-monitoring algorithms. The ECMWF’s DTWO project, launched in 2024, couples weather, turbine, and grid models into a single digital twin for offshore wind at continental scale.
- Decision support. Dashboards, alerts, automated work orders, and (increasingly) direct control actions: pitch derating, drone dispatch, valve closure. This is where data becomes operational.
Most content on this topic stops at the structural and process side: the turbine, the platform, the cable. What gets overlooked is the mobile, logistics side of the operation. Hundreds or thousands of containers, tool kits, spare-part crates, and support equipment circulate between shore bases, vessels, and platforms. That’s a distinct monitoring discipline, and losing visibility on those assets is quietly expensive.
The Economics Driving the Monitoring Shift
Offshore asset monitoring isn’t growing because of conference hype. It’s growing because the cost of not monitoring has become indefensible.
| Market segment | 2025 value | Forecast | CAGR |
|---|---|---|---|
| Offshore platform structural monitoring | $3.8 B | $7.1 B by 2034 | 7.2% |
| Digital twin in marine/offshore | n/a | $13.26 B by 2035 | 11.7% |
| Enterprise asset management systems | $16.97 B | $26.41 B by 2030 | ~7.6% |
These are converging markets. The same operator needs structural data, condition data, and logistics data to make a single maintenance decision. Instrumentation and software for offshore assets is growing roughly twice as fast as overall offshore capex because operators are trying to extract more useful life from each structure.
Three numbers explain the urgency:
- 83% of all offshore wind insurance losses come from subsea cable failures, with individual array-cable incidents costing between $1.2 million and $12 million. TGS projects roughly 3,600 cable failures across the global offshore wind fleet between 2024 and 2034.
- Advanced monitoring plus predictive maintenance saves up to 8% of direct O&M costs and reduces lost production by up to 11% on offshore wind farms. For an asset class where O&M runs roughly $400/MWh over project life, those percentages are operational dollars, not rounding errors.
- BSEE reported 1 fatality, 32 injuries, and 130 fire/explosion incidents on the U.S. Outer Continental Shelf in 2024. Continuous monitoring doesn’t eliminate risk. It shifts the detection window from catastrophic to manageable.
The economic argument is settled. The question now is which parts of the stack to prioritize, and which gaps are costing you money you haven’t measured yet.
From Vibration Anomaly to Crew Dispatch
Rather than cataloging every sensor type (there are hundreds), here’s how the layers interact on a real asset.
A 12 MW offshore wind turbine. Accelerometers detect abnormal vibration in the main bearing at 06:00. The edge gateway filters noise and flags the frequency signature. The analytics layer (a convolutional neural network trained on two years of fleet data) assigns a 38% probability of failure within 14 days. The digital twin updates the maintenance schedule and confirms a replacement bearing is at the shore base in Esbjerg. The decision layer pushes a derating command to the turbine controller, creates a work order, and adjusts the crew transfer vessel schedule for Tuesday to include a repair team.
The full loop, from vibration anomaly to crew dispatch, closes in minutes. Under traditional scheduled maintenance, the same fault might wait weeks for the next inspection visit. By then the bearing has failed, the turbine has been offline for days, and the jack-up vessel mobilization costs seven figures.
That’s the structural and condition-monitoring side working as designed. Now consider the logistics side of the same scenario.
The replacement bearing shipped from Rotterdam six weeks ago in a reusable container. It arrived at the shore base. It’s been sitting there. Does operations know exactly which container it’s in? Is the container free for reuse, or still holding inventory? When the damaged bearing comes off the turbine, it goes into another container for MRO return. Does anyone track that container after it leaves the platform?
This is where the stack breaks. Structural monitoring connects seamlessly from sensor to dashboard. Logistics monitoring, for many operators, stops at the shipping manifest.
The Blind Spot Above the Waterline
The offshore energy industry has invested heavily in monitoring what’s underwater and what’s bolted down. Monopiles get strain gauges. Gearboxes get accelerometers. Export cables get distributed acoustic sensing. But the container of spare parts on the quayside? The portable generator cycling between platforms? The rented ROV tooling that should have been returned two months ago?
Those assets move. They cross organizational boundaries (operator to contractor to freight forwarder to port authority). And they go dark at every handoff.
This is the distinction between shipment tracking and asset tracking. Shipment tracking tells you where something is while it’s in transit. The job ends at delivery. Asset tracking follows the physical object through its full lifecycle: deployment, idle time, return, maintenance, reuse. For reusable containers, ground support equipment, and rental tools, the gap between these two concepts is where money disappears—a challenge directly addressed by cargo monitoring at sea solutions.
I’ve seen this pattern across industries. An operator runs a pool of 500 containers for offshore support. At any given time, 30% are unaccounted for. Not lost, exactly. Just invisible. They’re sitting at a contractor’s yard, or stacked at a port with no scan event, or circulating in a loop that nobody mapped. The cost isn’t just the container itself. It’s the emergency purchase of a replacement, the delayed maintenance because the right part can’t be located, the demurrage on a vessel waiting for equipment that’s “somewhere in the system.”
Cellular and satellite-enabled trackers (compact enough to mount on a container or tool case, with multi-year battery life and IP-rated enclosures built for marine environments) close this gap. A solar powered asset tracker extends that battery life even further for equipment that spends long stretches idle at port. They report position and status regardless of which stage of the cycle the asset occupies: in transit, on platform, idle at port, in an MRO loop. The data feeds the same operations picture that tracks structural health and production. If your container pool or portable equipment goes dark after it leaves the dock, that’s the gap ocean equipment tracking is designed to close.
Digital Twins in Offshore Energy: Where They Deliver
The term “digital twin” covers everything from a static 3D model in a slide deck to a continuously updated virtual replica ingesting live sensor data and running physics-based predictions. The gap between those two things is enormous.
In offshore energy, real digital twins exist at scale today, but only at a small number of operators. Equinor runs Kongsberg’s Kognitwin across platforms including Oseberg and Åsgård. Shell started its twin program in 2017 and now applies it to upstream production optimization. BP and Chevron both maintain twins of major assets. The ECMWF’s DTWO project is building what it calls the first-of-its-kind digital twin for offshore wind at European scale, integrating weather models with turbine and grid models.
Where twins deliver measurable value today, including environmental compliance monitoring and broader environmental monitoring technology:
- Predictive maintenance scheduling (the bearing scenario above)
- Life-extension engineering: proving to regulators that a foundation can operate safely beyond its original design life using actual load history, not conservative assumptions from a 20-year-old design code
- Scenario testing (what happens to cable fatigue if we add five turbines to this array?)
Where they’re still maturing:
- Fleet-level benchmarking across different OEMs and foundation types
- Integrating logistics and supply-chain data into the same twin (most twins stop at the structure; spare parts, vessels, and crew are modeled separately, if at all)
- Data-model standardization across vendors, which makes multi-OEM fleets painful to twin
The honest assessment: if you operate a large, homogeneous fleet (50+ turbines from one OEM, or a single major platform), digital-twin ROI is proven. If you run a mixed portfolio with multiple vendors and asset types, expect to spend as much on data integration as on the twin itself.
When Cybersecurity Becomes a Safety Problem
This is the conversation the offshore monitoring industry is only starting to have.
As monitoring systems gain operational control authority (remote tripping, autonomous drone dispatch, converter derating), cybersecurity stops being an IT problem and becomes a safety problem. A compromised vibration sensor feeding false data into a predictive-maintenance model doesn’t just cause a bad maintenance decision. It can mask a real failure until the failure becomes catastrophic.
DNV is running a Joint Industry Project on OT Cyber Security for Offshore Wind, drafting guidelines aligned with IEC 62443. The concern is practical, not theoretical. Offshore SCADA systems, historically designed for reliability rather than security, are now connected to cloud analytics platforms, third-party vendors, and remote operations centers. Every connection is an attack surface.
For operators evaluating monitoring platforms, three questions matter:
- Does the platform support role-based access control and encrypted data transmission end-to-end?
- Is OT traffic segregated from IT traffic?
- Who owns the data, and where is it stored?
None of these are exotic requirements. They’re absent from most monitoring RFPs today.
Five Questions Before You Sign a Monitoring Contract
Whether you’re procuring structural health monitoring, condition-monitoring systems, or operational asset tracking devices, these questions filter vendors fast.
- What happens to my data when I switch vendors? Vendor lock-in in offshore monitoring is real. If your sensor data lives in a proprietary format on a vendor-controlled cloud, migration means starting over. Insist on open data standards and export capabilities from day one.
- Does the system monitor the asset or just the shipment? For portable equipment, containers, and tools: does tracking stop at delivery, or does it follow the full cycle (deployment, idle time, return, MRO)? The difference shows up directly on your balance sheet as ghost inventory and unnecessary purchases.
- What’s the integration cost with my existing systems? The sensor might cost $500. Integrating its data with your ERP, CMMS, and operations dashboard might cost $50,000. Ask for total cost of ownership, not unit price.
- How does the platform handle multi-vendor environments? Unless your entire operation runs on a single OEM (unlikely), your monitoring platform needs to normalize data from multiple sources. The vendor’s answer to this question tells you a lot about their maturity.
- What’s the cyber posture? If the vendor can’t describe their OT security architecture in plain language, that’s your answer.
Offshore energy asset monitoring will only grow more complex as the installed fleet expands and legacy platforms age. The operators who build integrated visibility (structural, operational, and the environmental monitoring sensors that track marine conditions, across fixed and mobile assets) will spend less, react faster, and extend asset life further than those who monitor in silos.
If your monitoring covers turbines and cables but your container pool still travels on faith, there’s a layer of the stack missing. We build end-to-end tracking solutions for offshore and ocean equipment, from hardware to platform integration. Talk to our team or reach us at info@datanetiot.com.
Frequently Asked Questions
What is offshore energy asset monitoring?
It is the continuous, sensor-based observation of offshore wind turbines, oil and gas platforms, subsea pipelines, FPSOs, power cables, and supporting equipment. The goal is to detect faults early, predict failures, optimize maintenance scheduling, and maintain full visibility of both fixed and mobile assets across the offshore lifecycle.
How much does offshore asset monitoring cost?
Upfront monitoring capex typically runs 0.5% to 2% of total project capex. Studies on offshore wind show up to 8% direct O&M savings and 11% reduction in lost production once advanced monitoring and predictive maintenance are deployed. ROI is generally achieved within one to three years, depending on fleet size and failure-cost exposure.
What is the difference between SCADA and asset tracking in offshore energy?
SCADA supervises operational parameters of fixed assets (power output, temperatures, pressures, alarms). Asset tracking monitors the location, status, and lifecycle of mobile physical objects (containers, spare parts, ground equipment) as they move between ports, vessels, and platforms. Most offshore operations need both, but they’re often managed by different teams with no shared dashboard.
Why are subsea cable failures such a big concern?
Around 83% of all offshore wind insurance losses come from subsea cable failures. Individual array-cable incidents cost between $1.2 million and $12 million, and roughly 3,600 failures are projected globally between 2024 and 2034. This economic exposure is driving rapid adoption of distributed acoustic and temperature sensing along power cables, alongside continuous temperature and humidity monitoring of critical components.
How do digital twins reduce offshore maintenance costs?
A digital twin ingests live sensor data and runs physics-based or data-driven models to predict component remaining useful life. Instead of scheduling maintenance by calendar, operators intervene based on actual asset condition. This avoids both premature replacements and unexpected failures, cutting unnecessary vessel mobilizations that can each cost over €1 million.
What role does cybersecurity play in offshore monitoring?
As monitoring systems gain control authority (remote derating, drone dispatch, emergency shutdown triggers), a cyber breach becomes a physical safety risk. DNV’s Joint Industry Project on OT Cyber Security for Offshore Wind is developing IEC 62443-aligned guidelines specifically for this sector. Operators should verify that any monitoring platform supports encrypted data transmission, role-based access, and OT/IT network segregation.




 +1 508 292 2210

3 Responses